ABSTRACT
The bone morphogenetic protein (Bmp) family of secreted molecules has been extensively studied in the context of osteoblast differentiation. However, the intracellular signaling cascades that mediate the osteoblastogenic function of Bmp have not been fully elucidated. By profiling mRNA expression in the bone marrow mesenchymal progenitor cell line ST2, we discover that BMP2 induces not only genes commonly associated with ossification and mineralization but also genes important for general protein synthesis. We define the two groups of genes as mineralization related versus protein anabolism signatures of osteoblasts. Although it induces the expression of several Wnt genes, BMP2 activates the osteogenic program largely independently of de novo Wnt secretion. Remarkably, although Smad4 is necessary for the activation of the mineralization-related genes, it is dispensable for BMP2 to induce the protein anabolism signature, which instead critically depends on the transcription factor Atf4. Upstream of Atf4, BMP2 activates mTORC1 to stimulate protein synthesis, resulting in an endoplasmic reticulum stress response mediated by Perk. Thus, Bmp signaling induces osteoblast differentiation through both Smad4- and mTORC1-dependent mechanisms.
KEYWORDS: Atf4, ER stress, Perk, Smad4, bone morphogenic proteins (BMPs), mTOR, mTORC1, mineralization, osteoblast, protein anabolism
INTRODUCTION
The bone morphogenetic protein (Bmp) family of proteins regulates a wide variety of biological processes during both embryogenesis and adult homeostasis in mammals (1, 2). Bmp ligands bind to the tetrameric complex of type I and type II serine/threonine kinase receptors to activate Smad-dependent and -independent pathways (3). During Smad signaling, Smad1, -5, or -8 (R-Smads), upon phosphorylation by the activated type I receptor, interacts with Smad4 to induce target gene expression in the nucleus (2, 4, 5). However, R-Smads have also been shown to regulate cartilage development independently of Smad4 (6). The Smad-independent pathways include those of TAK1-p38 and phosphatidylinositol 3-kinase (PI3K)–Akt signaling (3, 4, 7, 8). The relative contribution of each intracellular mechanism to Bmp function likely depends on the cellular context.
Since its original discovery in bone, Bmp signaling has been shown to stimulate osteoblast differentiation in a variety of cell culture systems (9–11). The osteogenic function of Bmp is partially mediated though the induction of the transcription factor Sp7 (also known as Osx), which is essential for osteoblast differentiation (12). Several studies in cell cultures have suggested that Sp7 stimulates several common osteoblast marker genes such as the Col1a1, Ibsp, and Bglap genes through binding of the GC-rich Sp1 consensus sequence (13–16). However, a recent genome-wide study with neonatal calvarial osteoblasts expressing Osx-FLAG from the endogenous Osx locus revealed that Osx induces downstream target genes, including the Col1a1 gene, mainly through interactions with Dlx proteins that directly bind an AT-rich motif (17). Besides the upregulation of marker genes, osteoblasts are known to secrete copious amounts of extracellular matrix proteins, most notably type I collagen. However, how Bmp enhances the protein synthesis capacity of the cell is not well understood.
The serine/threonine kinase mammalian target of rapamycin complex 1 (mTORC1) is a central regulator of protein synthesis in mammalian cells (18). mTORC1 stimulates protein synthesis through the phosphorylation of eukaryotic translation initiation factor 4E binding protein 1 (Eif4ebp1) and S6 ribosomal protein kinase (P70S6K) (19). The activity of mTORC1 responds to both the nutritional status and extracellular signals that regulate various cellular activities (20, 21). Recent studies have shown that Wnt or Igf signaling activates mTORC1 to stimulate osteoblast differentiation (22–26). In particular, Wnt-induced mTORC1 signaling leads to intracellular glutamine deficiency that activates the integrated stress response (ISR), resulting in the upregulation of protein anabolism genes (23). Although mTORC1 is also activated by Bmp, it is not known whether Bmp employs the same amino acid-based ISR mechanism to enhance the protein synthesis capacity during osteoblast differentiation (27).
Besides amino acid deficiency, endoplasmic reticulum (ER) stress is well known to induce the ISR. Here, unfolded proteins in the ER activate the protein kinase Perk (also known as Eif2ak3), which phosphorylates and inactivates the α subunit of eukaryotic translation initiation factor 2 (eIF2α) (28, 29). The phosphorylation of eIF2α promotes the translation of the transcription factor Atf4, which, together with its transcriptional target Ddit3 (also known as Chop), activates a host of genes that function to maintain homeostasis in the ER or trigger apoptosis if ER stress remains unmitigated (30). Previous work already demonstrated the functional importance of Atf4 and Perk in bone formation (31, 32). Moreover, Bmp was shown to induce Perk activation during osteoblast differentiation in vitro (33). However, the signaling cascade leading to Perk activation in response to Bmp has not been elucidated.
Here, we present evidence that Bmp signals through a c-Abl–PI3K–mTORC1 cascade to activate the Perk-mediated ISR, inducing the expression of the protein anabolism genes. In contrast, Bmp-Smad4 signaling is critical for the transcription of the genes associated with mineralization. These data support an integrative model wherein Bmp induces the osteoblast phenotype through a dual mechanism.
RESULTS
BMP2 induces mineralization-related and protein anabolism genes during osteoblast differentiation.
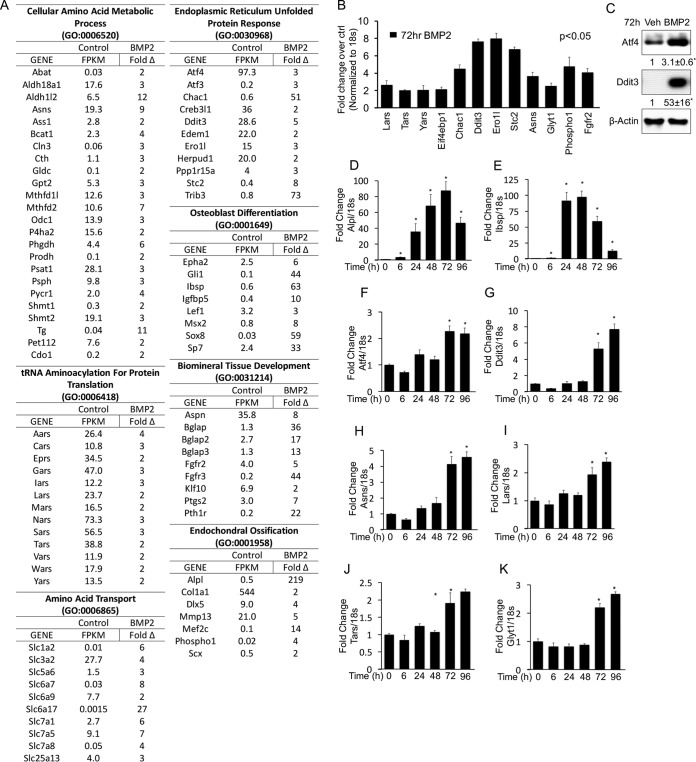
To gain insights about the molecular mechanism underlying osteoblastogenesis, we performed RNA sequencing (RNA-seq) to profile changes in the transcriptome of ST2 cells in response to BMP2 for 72 hours (see the supplemental material for the complete data set). ST2 cells are a mouse bone marrow stromal cell line that undergoes osteoblast differentiation in response to BMP2 (11, 34). We identified 416 genes induced >2-fold by BMP2. Analyses of these induced genes with GOrilla revealed a comprehensive molecular signature for osteoblast differentiation (35). The signature is composed of two primary biological processes based on gene ontology (GO) terms “mineralization related,” comprised of endochondral ossification (GO:0001958; P = 2.46E−04), osteoblast development (GO:0001649; P = 8.5E−05), and biomineral tissue development (GO:0031214; P = 1.46E−06), and “protein anabolism,” encompassing the cellular amino acid metabolic process (GO:0006520; P = 1.13E−8), tRNA aminoacylation for protein translation (GO:0006418; P = 5.27E−05), the endoplasmic reticulum unfolded-protein response (GO:0030968; P = 3.28E−04), and amino acid transport (GO:0006865; P = 1.83E−04). The mineralization-related component includes many genes commonly associated with osteoblasts, including the Alpl, Col1a1, Dlx5, Phospho1, Ibsp, Msx2, Sp7, Bglap, Fgfr2, and Pth1r genes (Fig. 1A). Within the anabolism component are the transcription factors Atf4 and Ddit3 and many of their transcriptional targets involved in ER stress (e.g., Atf3, Chac1, Trib3, and Ero1l) or tRNA aminoacylation (e.g., Eprs, Gars, Iars, and Lars) (30) (Fig. 1A). Thus, nonbiased transcriptome profiling identifies increased expression of protein anabolism genes, in addition to that of mineralization-related genes, as a prominent feature of osteoblast differentiation in response to BMP2.
FIG 1.
BMP2 induces genes involved in mineralization and protein anabolism during osteoblast differentiation in ST2 cells. (A) List of genes induced (>2-fold) by BMP2 after 72 h of treatment, as detected by RNA-seq. Fragments per kilobase per million reads (FPKM) are shown for control cells, while fold induction is shown for BMP2-treated cells. (B) qPCR confirmation of gene induction in response to 72 h of BMP2 treatment. (C) Western blot analyses of ST2 cells treated for 72 h with BMP2. ATF4 and Ddit3 values were normalized to the value for β-actin. Shown are fold changes ± standard deviations for treatment over the vehicle in three independent experiments. (D to K) qPCR analyses of gene induction in response to BMP2 treatment for different durations. *, P < 0.05 (n = 3). Error bars indicate standard deviations.
We next corroborated the RNA-seq results and also examined the kinetics of gene induction by quantitative PCR (qPCR). We confirmed the induction of both mineralization-related and protein anabolism genes by BMP2 after 72 h (Fig. 1B). By Western blotting, we observed increased protein levels for Atf4 and Ddit3 in response to BMP2 (Fig. 1C). The qPCR experiments also demonstrated a significant induction of Alpl and Ibsp by BMP2 within 6 h of treatment (Fig. 1D and E). In contrast, protein anabolism genes such as the Atf4, Ddit3, Asns, Lars, Tars, and Glyt1 (also known as Slc6a9) genes were not significantly induced until after 72 h of treatment (Fig. 1F to K). Thus, the mineralization-related and protein anabolism gene signatures exhibit distinct kinetics of induction in response to BMP2.
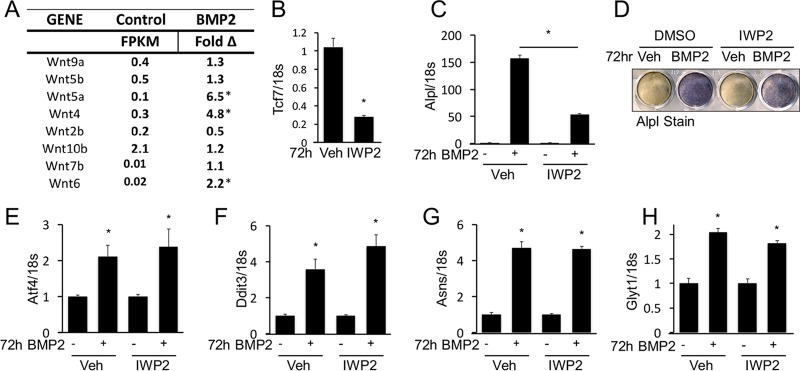
The RNA-seq data showed that BMP2 induced the expression of Wnt4, Wnt5a, and Wnt6 without affecting a number of other Wnt genes (Fig. 2A). Because previous work implicated Wnt in mediating the osteogenic function of Bmp, we examined the potential role of de novo Wnt production in BMP2-induced gene expression (36). When the small molecule IWP2 was used to inhibit Wnt secretion, it markedly reduced the mRNA level of the Wnt/β-catenin target Tcf7 gene, as expected (Fig. 2B). Interestingly, IWP2 significantly blunted the induction of Alpl by BMP2, even though the level of Alpl remained 50-fold higher than that of the control (Fig. 2C and D). However, IWP2 did not impair BMP2-induced expression of Atf4, Ddit3, Asns, or Glyt1 (Fig. 2E to H). Therefore, BMP2 can induce protein anabolism genes independently of de novo Wnt secretion.
FIG 2.
BMP2 induces protein anabolism gene signature independent of Wnt signaling. (A) Expression of Wnt genes in ST2 cells and changes in the response to BMP2 after 72 h, as detected by RNA-seq. FPKM, fragments per kilobase per million reads. *, >2-fold induction. (B to H) Effects of IWP2 treatment on gene expression assayed by qPCR (B, C, and E to H) or Alpl staining (D). *, P < 0.05 (n = 3). Error bars indicate standard deviations.
BMP2 induces protein anabolism genes via a Smad4-independent mechanism.
We next sought to understand how Bmp regulates the protein anabolism genes. We first tested the relevance of Smad4-mediated signaling. Effective knockdown of Smad4 with short hairpin RNA (shRNA) abolished the induction of Alpl, Sp7, and Ibsp by BMP2 after either 6 or 96 h of treatment (Fig. 3A to F). In contrast, Smad4 knockdown had no effect on the induction of the protein anabolism Ddit3, Asns, or Glyt1 gene (Fig. 3G to I). Interestingly, the Bglap gene, a mineralization-related gene that is a prototypic target gene of Atf4, was also unaffected by Smad4 knockdown (Fig. 3J) (31). Overall, Smad4 mediates the rapid induction of several mineralization-related genes by BMP2 but does not contribute to the subsequent activation of protein anabolism genes.
FIG 3.
BMP2 induces gene expression through Smad4-dependent and -independent mechanisms. (A) Western blot analysis of Smad4 protein levels in ST2 cells infected with a lentivirus expressing shRNA for Smad4 or LacZ (control). (B to J) Effects of Smad4 knockdown on BMP2-induced gene expression assayed by qPCR or Alpl staining after 6 h (B and C) or 96 h (D to J) of treatment. *, P < 0.05 (n = 3). Error bars indicate standard deviations.
The PERK-dependent ISR mediates Bmp induction of protein anabolism genes.
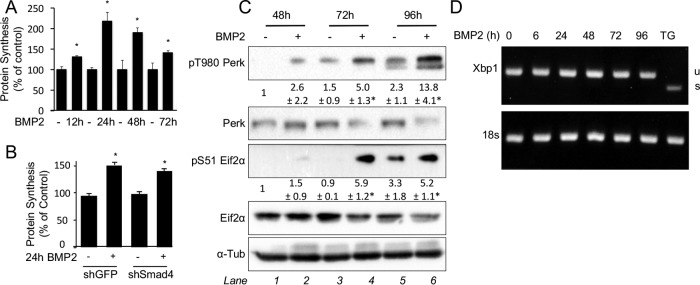
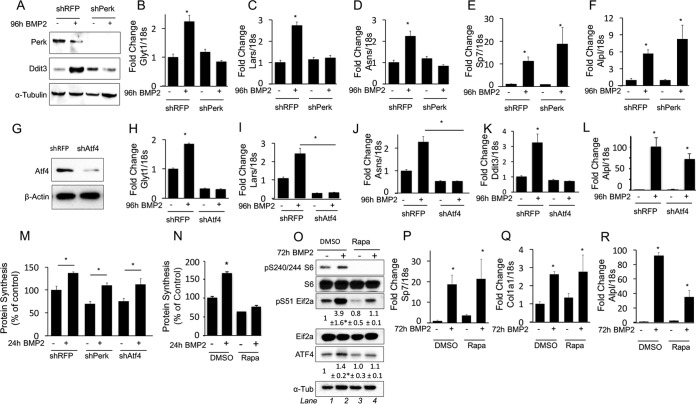
Activation of the protein anabolism genes can be an adaptive response to increased protein synthesis. To test if BMP2 induces protein synthesis in ST2 cells, we performed metabolic labeling using 35S-labeled cysteine and methionine. BMP2 significantly increased protein synthesis after 12 h, prior to the induction of anabolism genes; the increased levels peaked at 24 h but persisted after 72 h (Fig. 4A). Remarkably, Smad4 knockdown had no effect on the induction of protein synthesis by BMP2 (Fig. 4B). To examine whether increased protein synthesis led to ER stress, we assayed Perk phosphorylation (T980) following BMP2 treatment. BMP2 significantly increased Perk phosphorylation after 72 h, a time point coinciding with the induction of protein anabolism genes (Fig. 4C). Perk phosphorylation further intensified after 96 h of BMP2 treatment. However, we did not detect a change in Xbp1 splicing, another marker for ER stress, in response to BMP2 (Fig. 4D). Importantly, shRNA knockdown of Perk abolished the induction of the Ddit3 protein by BMP2 (Fig. 5A). Furthermore, Perk knockdown eliminated the activation of protein anabolism genes (the Glyt1, Lars, and Asns genes) (Fig. 5B to D) but not that of mineralization-related genes (the Sp7 and Alpl genes) by BMP2 (Fig. 5E and F). As Atf4 is a key transcriptional effector downstream of Perk, we next examined the relevance of Atf4 to BMP2 function. Knockdown of Atf4 with shRNA prevented the induction of Glyt1, Lars, Asns, and Ddit3 but not Alpl by BMP2 (Fig. 5G to L). Moreover, knockdown of either Perk or Atf4 did not diminish the induction of protein synthesis by BMP2 despite a lower basal rate (Fig. 5M). On the other hand, inhibition of protein synthesis with rapamycin prevented Perk activation, as assayed by Eif2a phosphorylation, as well as the induction of the Atf4 protein by BMP2 (Fig. 5N and O). Importantly, rapamycin did not impair the induction of the mineralization-related Sp7 and Col1a1 genes, although it partially blunted the induction of Alpl (Fig. 5P to R). Thus, our data support a model in which BMP2 activates protein synthesis and Perk, which in turn induces protein anabolism genes via Atf4.
FIG 4.
BMP2 stimulates protein synthesis and induces ER stress. (A and B) Metabolic labeling in ST2 cells treated with BMP2 for up to 72 h (A) or in Smad4 knockdown ST2 cells treated with BMP2 for 24 h (B). shRNA for green fluorescent protein (shGFP) was used as a control. (C) Western blot analyses of ST2 cells treated with BMP2 for up to 96 h. Phosphoprotein levels were normalized to the levels of the respective total protein. Shown are fold changes ± standard deviations for treatment over the vehicle in three independent experiments. *, P < 0.05 relative to lane 1. α-Tubulin is the loading control. (D) Xbp1 splicing assay in ST2 cells treated with BMP2 for up to 96 h. Thapsigargin (TG) treatment for 12 h was used as a positive control. U, unspliced Xbp1; S, spliced Xbp1.
FIG 5.
Perk and Atf4 mediate induction of protein anabolism genes by BMP2. (A to F) Effects of Perk knockdown on the response to BMP2, assayed by Western blotting (A) or qPCR (B to F). (G to L) Effects of Atf4 knockdown on the response to BMP2, assayed by Western blotting (G) or qPCR (H to L). (M) Protein synthesis in ST2 cells infected with a lentivirus expressing shRNA for red fluorescent protein (shRFP) (control), Perk, or Atf4. (N) Effect of rapamycin (Rapa) on protein synthesis in ST2 cells treated with BMP2. (O) Western blot analyses of ST2 cells treated with BMP2 and rapamycin. Levels of phosphoproteins were normalized to the levels of the respective total proteins, and Atf4 values were normalized to α-tubulin values. Shown are fold changes ± standard deviations over the vehicle control in three independent experiments. *, P < 0.05 relative to lane 1. (P to R) Effects of rapamycin on gene induction by BMP2, assayed by qPCR. *, P < 0.05 (n = 3). Error bars indicate standard deviations.
BMP2 stimulates protein synthesis downstream of c-Abl, PI3K, and mTORC1 activation.
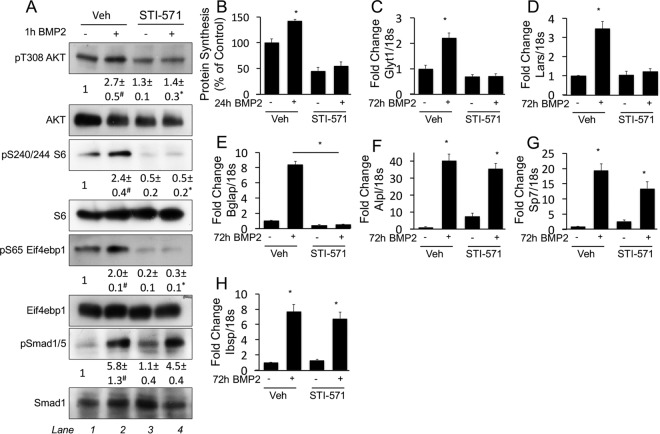
We next investigated the mechanism responsible for the stimulatory effect of BMP2 on protein synthesis. BMP2 was shown to activate the PI3K/Akt pathway downstream of the tyrosine kinase c-Abl in 2T3 cells (7). As PI3K and Akt are upstream activators of mTORC1, a serine threonine kinase known to enhance protein synthesis, we examined the effect of BMP2 on the PI3K/Akt/mTORC1 pathway in ST2 cells. Within 1 h of treatment, BMP2 significantly increased the phosphorylation of Akt at T308, an event downstream of PI3K (Fig. 6A). Moreover, BMP2 induced the phosphorylation of the S6 ribosomal protein at S240/244 and that of Eif4ebp1 at S65, indicating mTORC1 activation (Fig. 6A). Pharmacological inhibition of c-Abl with STI-571 (also known as imatinib [Gleevec]) prevented the BMP2-induced phosphorylation of Akt, Eif4ebp1, and S6 without affecting Smad1/5 phosphorylation (Fig. 6A). Importantly, STI-571 effectively suppressed the induction of protein synthesis and protein anabolism genes by BMP2 (Fig. 6B to D). STI-571 also abolished the induction of Bglap, an established target of Atf4 (Fig. 6E). In contrast, c-Abl inhibition did not impair the induction of Alpl, Sp7, or Ibsp, indicating that Smad signaling was intact (Fig. 6F to H). These results therefore reveal that c-Abl selectively mediates mTORC1 signaling in response to BMP2.
FIG 6.
c-Abl mediates induction of protein synthesis and protein anabolism genes by BMP2. (A) Western blot analyses of serum-starved ST2 cells treated with BMP2 in the presence or absence of STI-571 for 1 h. Phosphoprotein levels were normalized to the levels of the respective total proteins. Shown are fold changes ± standard deviations over the vehicle control in three independent experiments. #, P < 0.05 relative to lane 1; *, P < 0.05 relative to lane 3. (B) Metabolic labeling of ST2 cells treated with or without BMP2 or STI-571 for 24 h. (C to H) Effects of STI-571 on gene induction by BMP2, assayed by qPCR. *, P < 0.05 (n = 3). Error bars indicate standard deviations.
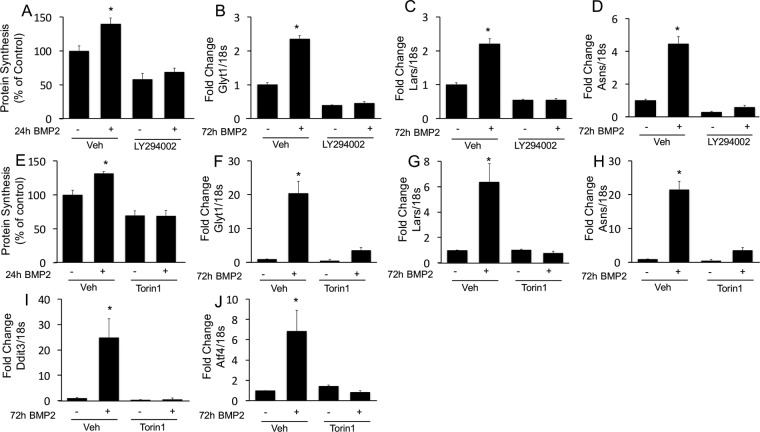
We next further corroborated the role of PI3K and mTORC1 in mediating the function of BMP2. Similarly to c-Abl inhibition, inhibition of PI3K with LY294002 completely suppressed BMP2-induced protein synthesis (Fig. 7A). Inhibition of PI3K also abolished the induction of protein anabolism genes (the Glyt1, Lars, and Asns genes) by BMP2 (Fig. 7B to D). Likewise, the mTOR inhibitor Torin1 eliminated the induction of both protein synthesis and protein anabolism genes (the Glyt1, Lars, Asns, Ddit3, and Atf4 genes) by BMP2 (Fig. 7E to J). Thus, BMP2 signals through c-Abl to activate the PI3K/Akt/mTORC1 axis, resulting in increased protein synthesis and induction of protein anabolism genes.
FIG 7.
mTORC1 signaling mediates induction of protein synthesis and protein anabolism genes by BMP2. (A to D) Effects of the PI3K inhibitor on protein synthesis (A) or gene induction by BMP2 (B to D). (E to J) Effects of the mTOR inhibitor on protein synthesis (E) or gene expression (F to J).
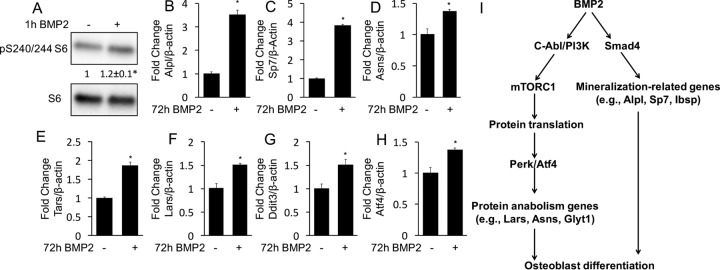
Finally, we tested the relevance of BMP2-mTORC1 signaling in primary cultures of murine bone marrow stromal cells (BMSC). BMP2 activated mTORC1 in BMSC within 1 h of treatment, as indicated by the increased phosphorylation of S6 (Fig. 8A). Moreover, BMP2 induced the expression of not only the mineralization-related Sp7 and Alpl genes but also a number of protein anabolism genes, including the Asns, Tars, Lars, Ddit3, and Atf4 genes (Fig. 8B to H). Altogether, our data support a model in which BMP2 induces osteoblast differentiation by engaging both Smad4 and mTORC1 mechanisms to activate mineralization-related and protein anabolism genes, respectively (Fig. 8I).
FIG 8.
BMP2 activates mTORC1 and induces the expression of protein anabolism genes in BMSC. (A) Western blot analyses of S6 phosphorylation in response to BMP2. *, P < 0.05. Shown are average fold changes ± standard deviations (n = 3). (B to H) Induction of gene expression by BMP2, assayed by qPCR. *, P < 0.05 (n = 3). Error bars indicate standard deviations. (I) Model for bimodal BMP2 signaling during osteoblast differentiation.
DISCUSSION
We have shown that Bmp signaling employs a dual mechanism to induce osteoblast differentiation. On the one hand, Bmp activates genes associated with ossification and mineralization (“mineralization-related signature”) in a Smad4-dependent manner. On the other hand, Bmp signals through a c-Abl–PI3K–mTORC1 cascade to stimulate the expression of a host of genes participating in protein synthesis (“protein anabolism signature”). The activation of the protein anabolism signature is likely independent of Smad4 but relies on Atf4, in response to ER stress triggered by increased protein synthesis. It should be noted that the activation of mTORC1 as well as the induction of the protein anabolism genes in BMSC were less robust than those in ST2 cells. Thus, BMP2 may activate protein anabolism genes via the mTORC1 pathway in a cell context-dependent manner. These findings therefore provide new insights about the regulation of osteoblastogenesis by Bmp.
These data indicate that the mineralization-related and protein anabolism gene signatures exhibit different kinetics of induction by BMP2. Distinct from the mineralization-related genes induced rapidly (the Alpl and Ibsp genes are significantly upregulated after 6 h), the levels of the protein anabolism genes are not increased until after 72 h of BMP2 stimulation. This temporal difference reflects distinct mechanisms, with rapid induction corresponding to canonical Bmp signaling via Smad4 but with the delayed response being mediated by Atf4 secondary to the ISR. Among the mineralization-related genes, the Bglap gene is unique in that it is independent of Smad4 but strictly depends on Atf4, thus behaving like the protein anabolism genes, but this result is consistent with the previous discovery of the Bglap gene as a direct target gene of Atf4 (31). Overall, the mineralization-related and protein anabolism gene signatures are largely regulated by distinct intracellular mechanisms, and both should be evaluated when assessing osteoblast differentiation.
This work has shed new light on the role of Wnt as a mediator of Bmp function during osteoblast differentiation. BMP2 induces the transcription of several Wnt genes in ST2 cells. However, inhibition of Wnt secretion does not diminish the induction of the protein anabolism genes by BMP2, even though it blunts that of Alpl. Our observation is consistent with data from a previous report implicating autocrine Wnt signaling in Alpl expression and osteoblast mineralization in response to BMP2 (36). Thus, Wnt may serve as a secondary signal to amplify Alpl expression during osteoblast differentiation induced by Bmp.
Bmp and Wnt employ different mechanisms to activate the ISR. We have previously shown that Wnt3a activates the ISR through Gcn2 responding to an intracellular glutamine deficiency (23). In contrast, BMP2 induces the ISR predominantly through Perk activation in response to protein synthesis overload. Remarkably, mTORC1 is a common mediator of both Gcn2- and Perk-mediated ISR. It is not clear at present how mTORC1 activation by Wnt or Bmp leads to disparate cell stress pathways. However, we have noticed that compared to Wnt3a, BMP2 causes a quick and large increase in protein synthesis in ST2 cells. Such a discrepancy could explain the ER stress observed with only BMP2 but not Wnt3a. On the other hand, Wnt3a acutely stimulates glucose consumption by ST2 cells, but BMP2 does not have a similar effect (37). Despite these differences, the data indicate that mTORC1 is a common effector downstream of Wnt and Bmp in activating the protein anabolism signature of osteoblasts.
Our results indicate that the nonreceptor tyrosine kinase c-Abl contributes to osteoblastogenesis in response to Bmp. In particular, c-Abl inhibition prevents mTORC1 signaling, ER stress activation, and protein anabolism gene induction in response to BMP2 but does not impair the induction of the mineralization-related genes (e.g., the Alpl, Sp7, and Ibsp genes) (Fig. 6). This finding is consistent with data from a previous report showing that c-Abl−/− mice are osteoporotic due to decreased osteoblast maturation and activity (38). Moreover, patients receiving imatinib mesylate (c-Abl inhibitor) have been reported to show inhibition of bone remodeling (39). Although others have shown that c-Abl phosphorylates Bmpr1a and regulates Smad activation in response to Bmp, we did not observe any effect of c-Abl inhibition on Smad phosphorylation or Smad-dependent gene expression (7, 40). This discrepancy may be due to the different cell types being examined or different modes of c-Abl inhibition or Bmp2 treatment. Nonetheless, our data support a model wherein c-Abl activity is required for Bmp2-induced activation of mTORC1, protein synthesis, and induction of the protein anabolism gene signature during osteoblast differentiation.
MATERIALS AND METHODS
Cell culture.
ST2 cells were cultured in α-MEM (Gibco) supplemented with 10% fetal bovine serum (FBS) (Invitrogen). All experiments were carried out at a seeding density of 13,000 cells/cm2. BMP2 treatments were initiated by replacing the medium with α-MEM supplemented with either 300 ng/ml recombinant human BMP2 (R&D) or the vehicle control (0.1% HCl). In the indicated experiments, growth medium was supplemented with 100 nM Torin1, 10 μM STI-571, 1 μg/ml thapsigargin, 10 μM LY294002, 5 μM IWP2, or 20 nM rapamycin, all purchased from Sigma. For all experiments involving IWP2, STI-571, LY294002, or Torin1, cells were pretreated for 30 min with the respective reagent. For 1-h BMP2 treatments, ST2 cells were serum starved for 6 h prior to the treatments.
BMSC were isolated from tibias and femurs of 2-month-old mice. Briefly, the bones were cleanly dissected and cut off the epiphysis with scissors. Bone marrow cells were collected from the bones by centrifugation and then incubated with red blood lysis buffer. The remaining cells were then passed through a 70-μm cell strainer before being seeded onto a tissue culture plate in α-MEM containing 10% FBS. After daily changes of the medium for 3 days, the cells were allowed to grow until they reached confluence. The cells were then dissociated and seeded at 1.5 × 10⁵ cells per well in a 24-well plate overnight before treatment with 300 ng/ml of BMP2 or the vehicle for 1 h for Western blotting or for 72 h for qPCR.
RNA isolation and qPCR.
Total RNA was isolated from cultured cells by using the RNeasy kit with on-column DNase treatment (Qiagen). Reverse transcription was performed by using 100 ng total RNA with the iScript cDNA synthesis kit (Bio-Rad). Reactions were set up in technical and biological triplicates in a 96-well format on an ABI StepOne Plus machine, using SYBR green chemistry (SsoAdvanced; Bio-Rad). The PCR conditions were 95°C for 3 min followed by 40 cycles of 95°C for 10s and 60°C for 30s. The gene expression level was normalized to the 18S rRNA level, and relative expression was calculated by using the 2−ΔΔCT method. Primers were used at 0.1 μM, and their sequences are listed in Table 1. PCR efficiency was optimized, and melting-curve analyses of products were performed to ensure reaction specificity.
TABLE 1.
PCR primers used in this study
| Gene | Forward primer | Reverse primer |
|---|---|---|
| 18s | CGGCTACCACATCCAAGGAA | GCTGGAATTACCGCGGCT |
| Akp2 | CCAACTCTTTTGTGCCAGAGA | GGCTACATTGGTGTTGAGCTTTT |
| Ibsp | CAGAGGAGGCAAGCGTCACT | GCTGTCTGGGTGCCAACACT |
| Asns | CAAGGAGCCCAAGTTCAGTAT | GGCTGTCCTCCAGCCAAT |
| Smad4 | GCAGCTCTTGGATGAAGTCC | GGCAGCAAACACATCTCTCA |
| Lars | GAGCAGCAAGGGCAAATACTT | GAAAACGTGTGTCCCAAATGAAG |
| Sp7 | CCCTTCTCAAGCACCAATGG | AAGGGTGGGTAGTCATTTGCATA |
| Tars | CCCTGGCCTGAATACATTAACAC | CGGCTTGCTATCTTTTGCTGC |
| Yars | TTATCAAAGGCACCGACTACCA | CGTCGTGTTGTGTGACCAC |
| Eif4ebp1 | GGTGAGTTCCGACACTCCAT | GGGGACTACAGCACCACTCC |
| Chac1 | AGTGGTGACCCTCCTTGA | CCCTCACATTCAGGTACTTCAG |
| Ddit3 | AAGCCTGGTATGAGGATCTGC | GGGGATGAGATATAGGTGCCC |
| Ero1L | AGTCTGCGAGCTACAAGTATTC | TCTCCTCACTCAGAGACTCATC |
| Stc2 | GAGAACGTCGGTGTGATTGT | GACTGCCTCCTTCACATCTTC |
| Glyt1 | TCATGGCTTTGTCGTCTGTCAT | GCGGCAGAGCTGGAACA |
| Phospho1 | AGCTGGAGACCAACAGTTTTC | TCCCTAGATAGGCATCGTAGTC |
| Fgfr2 | ATAAGGTACGAAACCAGCACTG | GGTTGATGGACCCGTATTCATTC |
| Tcf7 | AGCGCTGCCATCAACCAGAC | TGGCCTGCTCTTCTCGAGATAG |
| Bglap | CAGCGGCCCTGAGTCTGA | GCCGGAGTCTGTTCACTACCTTA |
| Col1a1 | CCCAAGGAAAAGAAGCACGTC | ACATTAGGCGCAGGAAGGTCA |
shRNA knockdown.
Lentiviral shRNA constructs were obtained from the RNA interference (RNAi) core at the Washington University School of Medicine. The lentiviral constructs were cotransfected with plasmids pMD2.g and psPax2 into 293 cells. The virus-containing media were collected and filtered. ST2 cells were plated at 13,000 cells/cm2 and infected for 12 h, followed by recovery for 36 h in regular medium. Viral infection delayed and blunted the ISR in ST2 cells in response to BMP2. As a result, in all knockdown experiments, anabolic gene expression and ISR induction were assayed after 96 h of BMP2 treatment, instead of the 72 h normally used with uninfected ST2 cells. All knockdown results were confirmed by two or more shRNA constructs targeting different sequences (Table 2).
TABLE 2.
shRNA sequences used in this studya

Results from shRNA-1 for each gene described in the text.
Western blotting.
ST2 cells were scraped into lysis buffer containing 50 mM Tris (pH 7.4), 15 mM NaCl, 0.5% NP-40, and a protease inhibitor mix (catalog number 04693124001; Roche). The protein concentration was measured by using the bicinchoninic acid (BCA) method (Pierce). Proteins (20 μg) were resolved on a 12% polyacrylamide gel, transferred onto a 0.45-μm-pore-size polyvinylidene difluoride (PVDF) Immobilon-P membrane (Millipore), and detected with specific antibodies to α-tubulin (Santa Cruz), P-T980-Perk (Cell Signaling), Perk (Cell Signaling), P-S51-eIF2α (Cell Signaling), eIF2α (Cell Signaling), Ddit3 (Cell Signaling), ATF4 (Santa Cruz), S6 (Cell Signaling), P-S240/244-S6 (Cell Signaling), P-S65-4EBP1 (Cell Signaling), 4EBP1 (Cell Signaling), P-T308-Akt (Cell Signaling), Akt (Cell Signaling), P-Smad1/5 (Cell Signaling), Smad1 (Cell Signaling), and Smad4 (Abcam). The immunoblots were blocked for 1 h at room temperature with 5% bovine serum albumin (BSA) dissolved in Tris-buffered saline (TBS) with 0.1% Tween, followed by overnight incubation with specific primary antibodies at 4°C. For ATF4 detection, the blots were blocked overnight at 4°C in 7% milk (TBS, 0.1% Tween) before overnight incubation with the antibody at 4°C in 5% milk. Membranes were then washed three times by using TBS–0.1% Tween and further incubated with the horseradish peroxidase (HRP)-conjugated goat anti-rabbit secondary antibody (Invitrogen) in 5% BSA (TBS–0.1% Tween) for 1 h at room temperature (1:5,000). All blots were developed by using either the Immun-Star WesternC chemiluminescence kit or the Clarity ECL substrate (Bio-Rad). Each experiment was repeated a minimum of three times with three independently prepared protein samples.
RNA-seq.
Poly(A) RNA was isolated from 20 μg total RNA by using oligo(dT) beads. mRNA was fragmented and reverse transcribed into double-stranded cDNA. cDNA was blunt ended, followed by the addition of an “A” base to the 3′ end and the ligation of sequencing adapters to the ends. The fragments then underwent PCR amplification for 12 cycles. The resulting libraries were sequenced by using the Illumina HiSeq-2000 instrument with single reads extending 42 bases (GTAC, Washington University). The raw data were demultiplexed and aligned to the reference genome (mm9) by using TopHat. Both Cufflinks and the Partek Genomic Suite were used independently to assemble transcripts and analyze expression. Gene ontology analysis was performed by using the GOrilla platform.
Metabolic labeling.
ST2 cells were seeded at 2.5 × 10⁵ cells into 6-cm plates and cultured for 36 h prior to treatments, followed by two washes with cysteine-methionine-free medium and incubation in labeling medium (10% dialyzed FBS, 165 μCi EasyTag Express 35S mix) for 30 min. Cells were then washed twice with ice-cold phosphate-buffered saline (PBS) and scraped into radioimmunoprecipitation assay (RIPA) buffer. Soluble lysates were spotted onto Whatman paper and precipitated in 5% trichloroacetic acid (TCA), followed by two 5-min washes in 10% TCA, two 2-min washes in 100% ethanol, and one 2-min wash in acetone. Filters were air dried, and 35S incorporation was measured by using a Beckman LS6500 scintillation counter and normalized to the cell number.
Supplementary Material
Footnotes
Supplemental material for this article may be found at https://doi.org/10.1128/MCB.00253-16.
REFERENCES
- 1.Moustakas A, Heldin CH. 2009. The regulation of TGF beta signal transduction. Development 136:3699–3714. doi: 10.1242/dev.030338. [DOI] [PubMed] [Google Scholar]
- 2.Wu MY, Hill CS. 2009. Tgf-beta superfamily signaling in embryonic development and homeostasis. Dev Cell 16:329–343. doi: 10.1016/j.devcel.2009.02.012. [DOI] [PubMed] [Google Scholar]
- 3.Miyazono K, Kamiya Y, Morikawa M. 2010. Bone morphogenetic protein receptors and signal transduction. J Biochem 147:35–51. doi: 10.1093/jb/mvp148. [DOI] [PubMed] [Google Scholar]
- 4.Massague J. 2012. TGFbeta signalling in context. Nat Rev Mol Cell Biol 13:616–630. doi: 10.1038/nrm3434. [DOI] [PMC free article] [PubMed] [Google Scholar]
- 5.Wharton K, Derynck R. 2009. TGFbeta family signaling: novel insights in development and disease. Development 136:3691–3697. doi: 10.1242/dev.040584. [DOI] [PubMed] [Google Scholar]
- 6.Retting KN, Song B, Yoon BS, Lyons KM. 2009. BMP canonical Smad signaling through Smad1 and Smad5 is required for endochondral bone formation. Development 136:1093–1104. doi: 10.1242/dev.029926. [DOI] [PMC free article] [PubMed] [Google Scholar]
- 7.Ghosh-Choudhury N, Mandal CC, Das F, Ganapathy S, Ahuja S, Ghosh Choudhury G. 2013. c-Abl-dependent molecular circuitry involving Smad5 and phosphatidylinositol 3-kinase regulates bone morphogenetic protein-2-induced osteogenesis. J Biol Chem 288:24503–24517. doi: 10.1074/jbc.M113.455733. [DOI] [PMC free article] [PubMed] [Google Scholar]
- 8.Ghosh-Choudhury N, Abboud SL, Nishimura R, Celeste A, Mahimainathan L, Choudhury GG. 2002. Requirement of BMP-2-induced phosphatidylinositol 3-kinase and Akt serine/threonine kinase in osteoblast differentiation and Smad-dependent BMP-2 gene transcription. J Biol Chem 277:33361–33368. doi: 10.1074/jbc.M205053200. [DOI] [PubMed] [Google Scholar]
- 9.Urist MR, Mikulski A, Lietze A. 1979. Solubilized and insolubilized bone morphogenetic protein. Proc Natl Acad Sci U S A 76:1828–1832. doi: 10.1073/pnas.76.4.1828. [DOI] [PMC free article] [PubMed] [Google Scholar]
- 10.Katagiri T, Yamaguchi A, Komaki M, Abe E, Takahashi N, Ikeda T, Rosen V, Wozney JM, Fujisawa-Sehara A, Suda T. 1994. Bone morphogenetic protein-2 converts the differentiation pathway of C2C12 myoblasts into the osteoblast lineage. J Cell Biol 127:1755–1766. doi: 10.1083/jcb.127.6.1755. [DOI] [PMC free article] [PubMed] [Google Scholar]
- 11.Yamaguchi A, Ishizuya T, Kintou N, Wada Y, Katagiri T, Wozney JM, Rosen V, Yoshiki S. 1996. Effects of BMP-2, BMP-4, and BMP-6 on osteoblastic differentiation of bone marrow-derived stromal cell lines, ST2 and MC3T3-G2/PA6. Biochem Biophys Res Commun 220:366–371. doi: 10.1006/bbrc.1996.0411. [DOI] [PubMed] [Google Scholar]
- 12.Nakashima K, Zhou X, Kunkel G, Zhang Z, Deng JM, Behringer RR, de Crombrugghe B. 2002. The novel zinc finger-containing transcription factor osterix is required for osteoblast differentiation and bone formation. Cell 108:17–29. doi: 10.1016/S0092-8674(01)00622-5. [DOI] [PubMed] [Google Scholar]
- 13.Ortuno MJ, Susperregui AR, Artigas N, Rosa JL, Ventura F. 2013. Osterix induces Col1a1 gene expression through binding to Sp1 sites in the bone enhancer and proximal promoter regions. Bone 52:548–556. doi: 10.1016/j.bone.2012.11.007. [DOI] [PubMed] [Google Scholar]
- 14.Ortuno MJ, Ruiz-Gaspa S, Rodriguez-Carballo E, Susperregui AR, Bartrons R, Rosa JL, Ventura F. 2010. p38 regulates expression of osteoblast-specific genes by phosphorylation of osterix. J Biol Chem 285:31985–31994. doi: 10.1074/jbc.M110.123612. [DOI] [PMC free article] [PubMed] [Google Scholar]
- 15.Koga T, Matsui Y, Asagiri M, Kodama T, de Crombrugghe B, Nakashima K, Takayanagi H. 2005. NFAT and Osterix cooperatively regulate bone formation. Nat Med 11:880–885. doi: 10.1038/nm1270. [DOI] [PubMed] [Google Scholar]
- 16.Niger C, Lima F, Yoo DJ, Gupta RR, Buo AM, Hebert C, Stains JP. 2011. The transcriptional activity of osterix requires the recruitment of Sp1 to the osteocalcin proximal promoter. Bone 49:683–692. doi: 10.1016/j.bone.2011.07.027. [DOI] [PMC free article] [PubMed] [Google Scholar]
- 17.Hojo H, Ohba S, He X, Lai LP, McMahon AP. 2016. Sp7/Osterix is restricted to bone-forming vertebrates where it acts as a Dlx co-factor in osteoblast specification. Dev Cell 37:238–253. doi: 10.1016/j.devcel.2016.04.002. [DOI] [PMC free article] [PubMed] [Google Scholar]
- 18.Cornu M, Albert V, Hall MN. 2013. mTOR in aging, metabolism, and cancer. Curr Opin Genet Dev 23:53–62. doi: 10.1016/j.gde.2012.12.005. [DOI] [PubMed] [Google Scholar]
- 19.Thoreen CC, Chantranupong L, Keys HR, Wang T, Gray NS, Sabatini DM. 2012. A unifying model for mTORC1-mediated regulation of mRNA translation. Nature 485:109–113. doi: 10.1038/nature11083. [DOI] [PMC free article] [PubMed] [Google Scholar]
- 20.Dibble CC, Manning BD. 2013. Signal integration by mTORC1 coordinates nutrient input with biosynthetic output. Nat Cell Biol 15:555–564. doi: 10.1038/ncb2763. [DOI] [PMC free article] [PubMed] [Google Scholar]
- 21.Sengupta S, Peterson TR, Sabatini DM. 2010. Regulation of the mTOR complex 1 pathway by nutrients, growth factors, and stress. Mol Cell 40:310–322. doi: 10.1016/j.molcel.2010.09.026. [DOI] [PMC free article] [PubMed] [Google Scholar]
- 22.Chen J, Tu X, Esen E, Joeng KS, Lin C, Arbeit JM, Ruegg MA, Hall MN, Ma L, Long F. 2014. WNT7B promotes bone formation in part through mTORC1. PLoS Genet 10:e1004145. doi: 10.1371/journal.pgen.1004145. [DOI] [PMC free article] [PubMed] [Google Scholar]
- 23.Karner CM, Esen E, Okunade AL, Patterson BW, Long F. 2015. Increased glutamine catabolism mediates bone anabolism in response to WNT signaling. J Clin Invest 125:551–562. doi: 10.1172/JCI78470. [DOI] [PMC free article] [PubMed] [Google Scholar]
- 24.Inoki K, Ouyang H, Zhu T, Lindvall C, Wang Y, Zhang X, Yang Q, Bennett C, Harada Y, Stankunas K, Wang CY, He X, MacDougald OA, You M, Williams BO, Guan KL. 2006. TSC2 integrates Wnt and energy signals via a coordinated phosphorylation by AMPK and GSK3 to regulate cell growth. Cell 126:955–968. doi: 10.1016/j.cell.2006.06.055. [DOI] [PubMed] [Google Scholar]
- 25.Xian L, Wu X, Pang L, Lou M, Rosen CJ, Qiu T, Crane J, Frassica F, Zhang L, Rodriguez JP, Xiaofeng J, Shoshana Y, Shouhong X, Argiris E, Mei W, Xu C. 2012. Matrix IGF-1 maintains bone mass by activation of mTOR in mesenchymal stem cells. Nat Med 18:1095–1101. doi: 10.1038/nm.2793. [DOI] [PMC free article] [PubMed] [Google Scholar]
- 26.Chen J, Long F. 2015. mTORC1 signaling promotes osteoblast differentiation from preosteoblasts. PLoS One 10:e0130627. doi: 10.1371/journal.pone.0130627. [DOI] [PMC free article] [PubMed] [Google Scholar]
- 27.Lim J, Shi Y, Karner CM, Lee SY, Lee WC, He G, Long F. 2016. Dual function of Bmpr1a signaling in restricting preosteoblast proliferation and stimulating osteoblast activity in mouse. Development 143:339–347. doi: 10.1242/dev.126227. [DOI] [PMC free article] [PubMed] [Google Scholar]
- 28.Walter P, Ron D. 2011. The unfolded protein response: from stress pathway to homeostatic regulation. Science 334:1081–1086. doi: 10.1126/science.1209038. [DOI] [PubMed] [Google Scholar]
- 29.Wang S, Kaufman RJ. 2012. The impact of the unfolded protein response on human disease. J Cell Biol 197:857–867. doi: 10.1083/jcb.201110131. [DOI] [PMC free article] [PubMed] [Google Scholar]
- 30.Han J, Back SH, Hur J, Lin YH, Gildersleeve R, Shan J, Yuan CL, Krokowski D, Wang S, Hatzoglou M, Kilberg MS, Sartor MA, Kaufman RJ. 2013. ER-stress-induced transcriptional regulation increases protein synthesis leading to cell death. Nat Cell Biol 15:481–490. doi: 10.1038/ncb2738. [DOI] [PMC free article] [PubMed] [Google Scholar]
- 31.Yang X, Matsuda K, Bialek P, Jacquot S, Masuoka HC, Schinke T, Li L, Brancorsini S, Sassone-Corsi P, Townes TM, Hanauer A, Karsenty G. 2004. ATF4 is a substrate of RSK2 and an essential regulator of osteoblast biology; implication for Coffin-Lowry syndrome. Cell 117:387–398. doi: 10.1016/S0092-8674(04)00344-7. [DOI] [PubMed] [Google Scholar]
- 32.Wei J, Sheng X, Feng D, McGrath B, Cavener DR. 2008. PERK is essential for neonatal skeletal development to regulate osteoblast proliferation and differentiation. J Cell Physiol 217:693–707. doi: 10.1002/jcp.21543. [DOI] [PubMed] [Google Scholar]
- 33.Saito A, Ochiai K, Kondo S, Tsumagari K, Murakami T, Cavener DR, Imaizumi K. 2011. Endoplasmic reticulum stress response mediated by the PERK-eIF2(alpha)-ATF4 pathway is involved in osteoblast differentiation induced by BMP2. J Biol Chem 286:4809–4818. doi: 10.1074/jbc.M110.152900. [DOI] [PMC free article] [PubMed] [Google Scholar]
- 34.Tu X, Joeng KS, Nakayama KI, Nakayama K, Rajagopal J, Carroll TJ, McMahon AP, Long F. 2007. Noncanonical Wnt signaling through G protein-linked PKCdelta activation promotes bone formation. Dev Cell 12:113–127. doi: 10.1016/j.devcel.2006.11.003. [DOI] [PMC free article] [PubMed] [Google Scholar]
- 35.Eden E, Navon R, Steinfeld I, Lipson D, Yakhini Z. 2009. GOrilla: a tool for discovery and visualization of enriched GO terms in ranked gene lists. BMC Bioinformatics 10:48. doi: 10.1186/1471-2105-10-48. [DOI] [PMC free article] [PubMed] [Google Scholar]
- 36.Rawadi G, Vayssiere B, Dunn F, Baron R, Roman-Roman S. 2003. BMP-2 controls alkaline phosphatase expression and osteoblast mineralization by a Wnt autocrine loop. J Bone Miner Res 18:1842–1853. doi: 10.1359/jbmr.2003.18.10.1842. [DOI] [PubMed] [Google Scholar]
- 37.Esen E, Chen J, Karner CM, Okunade AL, Patterson BW, Long F. 2013. WNT-LRP5 signaling induces Warburg effect through mTORC2 activation during osteoblast differentiation. Cell Metab 17:745–755. doi: 10.1016/j.cmet.2013.03.017. [DOI] [PMC free article] [PubMed] [Google Scholar]
- 38.Li B, Boast S, de los Santos K, Schieren I, Quiroz M, Teitelbaum SL, Tondravi MM, Goff SP. 2000. Mice deficient in Abl are osteoporotic and have defects in osteoblast maturation. Nat Genet 24:304–308. doi: 10.1038/73542. [DOI] [PubMed] [Google Scholar]
- 39.Berman E, Nicolaides M, Maki RG, Fleisher M, Chanel S, Scheu K, Wilson BA, Heller G, Sauter NP. 2006. Altered bone and mineral metabolism in patients receiving imatinib mesylate. N Engl J Med 354:2006–2013. doi: 10.1056/NEJMoa051140. [DOI] [PubMed] [Google Scholar]
- 40.Kua HY, Liu H, Leong WF, Li L, Jia D, Ma G, Hu Y, Wang X, Chau JF, Chen YG, Mishina Y, Boast S, Yeh J, Xia L, Chen GQ, He L, Goff SP, Li B. 2012. c-Abl promotes osteoblast expansion by differentially regulating canonical and non-canonical BMP pathways and p16INK4a expression. Nat Cell Biol 14:727–737. doi: 10.1038/ncb2528. [DOI] [PMC free article] [PubMed] [Google Scholar]
Associated Data
This section collects any data citations, data availability statements, or supplementary materials included in this article.


