

ABSTRACT
The erythropoietin (Epo) gene is under tissue-specific inducible regulation. Because the kidney is the primary EPO-producing tissue in adults, impaired EPO production in chronic kidney disorders results in serious renal anemia. The Epo gene contains a liver-specific enhancer in the 3′ region, but the kidney-specific enhancer for gene expression in renal EPO-producing (REP) cells remains elusive. Here, we examined a conserved upstream element for renal Epo regulation (CURE) region that spans 17.4 kb to 3.6 kb upstream of the Epo gene and harbors several phylogenetically conserved elements. We prepared various Epo gene-reporter constructs utilizing a bacterial artificial chromosome and generated a number of transgenic-mouse lines. We observed that deletion of the CURE region (δCURE) abrogated Epo gene expression in REP cells. Although transgenic expression of the δCURE construct rescued Epo-deficient mice from embryonic lethality, the rescued mice had severe EPO-dependent anemia. These mouse lines serve as an elaborate model for the search for erythroid stimulatory activity and are referred to as AnRED (anemic model with renal EPO deficiency) mice. We also dissected the CURE region by exploiting a minigene harboring four phylogenetically conserved elements in reporter transgenic-mouse analyses. Our analyses revealed that Epo gene regulation in REP cells is a complex process that utilizes multiple regulatory influences.
KEYWORDS: erythropoietin, HIF, HRE, hypoxia, kidney, renal anemia
INTRODUCTION
Erythropoietin (EPO) regulates red blood cell (RBC) production in animals (1). Hypoxic stress induced by blood loss, high-altitude environments, chronic diseases, or other factors induces EPO production, and EPO stimulates the differentiation and proliferation of proerythroblasts to mature erythroid cells (1). Mice lacking Epo or its receptor (Epor) gene die in utero at approximately embryonic day 12.5 (E12.5) with impaired primitive and definitive erythropoiesis (2–5). EPO-producing tissues undergo switching during development (2, 6), as is the case for the hematopoietic tissues (7). EPO production in mice starts at E8.5 in neuronal tissues (2). Subsequently, EPO production begins in the embryonic liver at E9.5, and the liver becomes the main tissue for EPO production during the late embryonic and newborn periods (8). The kidney becomes the main tissue for EPO production after birth (5, 8). The liver and brain continue to produce a low level of EPO in adults (9), but EPO from the kidney constitutes approximately 80% of circulating EPO in peripheral blood; other tissues cannot compensate for the loss of renal EPO production (10).
The cells that produce EPO in the kidney have long been enigmatic. We have attempted to identify these cells by exploiting a homologous-recombination knock-in of the green fluorescent protein (GFP) reporter gene into the Epo locus within a bacterial artificial chromosome (BAC). Analyses of the BAC transgenic mouse identified renal EPO-producing (REP) cells as interstitial fibroblast-like cells that express neuronal markers (11). REP cells also express the fibroblast markers CD73 and PDGFRβ (12, 13). Importantly, under normal conditions, the majority of CD73-positive fibroblasts in the kidney do not express the Epo gene (OFF-REP cells) (14), and only a small portion of the CD73-positive fibroblasts in the corticomedullary junction area express the Epo gene (ON-REP cells) (12). OFF-REP cells retain EPO-producing potential, and many of them express the Epo gene upon exposure to severe chronic anemia (14). Of note, REP cells transform into myofibroblasts (MF-REP cells) and stop producing EPO under chronic kidney disease (CKD) conditions (15). We surmise that this transformation is the underlying mechanism of severe anemia in patients with CKD (16). However, the mechanism by which Epo gene expression in REP cells is repressed upon exposure to stress or myofibroblastic transformation of REP cells remains elusive.
The Epo gene is the first hypoxia-inducible gene characterized in detail (17–21). The regulatory mechanisms of the gene have been analyzed extensively using the hepatoma cell lines Hep3B and HepG2 because these cells produce EPO in response to hypoxia (22). A hypoxia-responsive element (HRE) has been identified in the 3′ flanking region of the gene, known as the 3′ hypoxia-inducible enhancer of the gene (23–25). Based on these discoveries, hypoxia-inducible factors (HIFs) were identified as transcription factors responsible for the hypoxia response (26). One of the three alpha subunits of HIFs (HIFα) heterodimerizes with a beta subunit (HIFβ or ARNT [aryl hydrocarbon receptor nuclear transporter]), and the heterodimer binds to the HRE (27). Importantly, the 3′ enhancer is responsible for EPO production only in the liver but is dispensable for gene expression in REP cells (8). Expression of the Epo gene in REP cells is under regulation distinct from that in the liver. Although a kidney enhancer likely regulates Epo gene expression in REP cells, there is no available cell line recapitulating the nature of REP cells, hampering our attempts to identify a kidney enhancer of the gene.
Several pioneering studies of human EPO gene regulation have suggested that the regulatory element(s) responsible for Epo gene expression in the kidney may reside in the upstream region of the gene (28–30). Reporter transgenic-mouse approaches exploiting λ-phage-based and cosmid-based transgenes covering the upstream region of the human EPO gene have demonstrated that a region encompassing 14 kb to 6 kb upstream of the transcription start site (TSS) harbors the renal enhancer(s) of the EPO gene (28, 29). Intriguingly, an anemia-inducible DNase I-hypersensitive site (HS) has been identified approximately 9 kb upstream from the TSS. This DNase I HS harbors sequence motifs resembling the 3′ enhancer (30), and an HRE motif in the region is conserved phylogenetically within vertebrates (31). When evaluated using a reporter transfection-transactivation assay in Hep3B cells, the HRE retained transactivation activity in response to hypoxia (31), implying that the HRE may act as a core element of the renal enhancer of the EPO gene. The function of this element in renal EPO gene expression awaits in vivo verification.
We have been studying the expression and regulation of the murine Epo gene in BAC-based reporter transgenic mice. Our results indicate that regulatory elements sufficient to recapitulate renal Epo gene expression reside within the 180-kb region surrounding the Epo gene (2, 11, 32). However, the precise localization and characteristics of the elements are unknown. In this study, we identified and characterized the enhancer directing Epo gene expression in mouse kidney using BAC-based reporter transgenic-mouse analysis. The results clearly demonstrate that a 14-kb region upstream of the Epo gene is indispensable for renal Epo gene expression in vivo. This region is referred to as the conserved upstream element for renal Epo regulation (CURE) region because the region harbors phylogenetically conserved elements. By exploiting a transgenic-complementation rescue approach in an Epo knockout mouse with a 60k-Epo BAC transgene deleting the CURE region, we established a mouse model of EPO-dependent anemia that recapitulates some of the critical characteristics of human renal anemia pathophysiology. The model mice suffer from severe anemia due to decreased expression of renal Epo and are referred to as anemic model with renal EPO-deficiency (AnRED) mice.
RESULTS
The 17-kb upstream region recapitulates Epo gene regulation in REP cells.
We determined that the 60-kb 5′ and 120-kb 3′ flanking sequences of the Epo gene (60k-GFP) (Fig. 1A) are sufficient to recapitulate gene expression in transgenic mice (8, 11). We also determined that GFP expression under transcriptional regulation by the 22-kb upstream and 163-kb downstream regions in the Epo locus (22k-GFP) (Fig. 1A) faithfully recapitulates endogenous Epo gene expression in mice (32). In these reporter transgenic-mouse assays, GFP-positive cells were observed in the kidney and liver in mice bearing these genetically modified BACs. Indeed, GFP-positive cells were reproducibly observed for the BAC reporter construct 22k-GFP in mice under anemic conditions (Fig. 1B). The GFP reporter gene was integrated 5′ of the translational start site in exon II by replacing a part of exon II and all of exons III and IV.
FIG 1.

A 17-kb upstream region recapitulates Epo gene expression in REP cells. (A) Diagram of transgenic constructs of 60k-GFP, 22k-GFP, 17k-GFP, and 17kXM-GFP. The locations of the Epo and Pop7 genes and restriction enzyme sites are depicted above the diagram. The MluI site was artificially inserted into the 3′ region of the GFP gene. (B to D) Immunohistochemical staining of GFP in the kidneys and livers of transgenic mice. Samples were derived from 22k-GFP (B), 17k-GFP (C), and 17kXM-GFP (D) transgenic mice under anemic conditions. REP cells are marked by GFP in the kidney sections from each transgenic mouse line (arrowheads). Note that GFP-positive cells were not observed in the livers of 17kXM-GFP mice but were observed in the livers of 22k-GFP and 17k-GFP mice (arrows). (E to G) GFP expression from 17k-GFP identifies REP cells in the kidney by double immunohistochemical staining with CD73. Note that REP cells seldom express GFP under normal conditions (E), whereas the number of GFP-positive cells increases under anemic conditions (F, arrowheads). g, glomerulus. (G) High-magnification images indicating that GFP-positive cells are REP cells also expressing CD73. Scale bars, 100 μm (B to F) and 25 μm (G).
To evaluate tissue-specific Epo gene regulation in the adult kidney, we generated a series of transgenic GFP reporter constructs using 60k-GFP and 22k-GFP as the starting material (Fig. 1A) and generated reporter transgenic-mouse lines. A pair of constructs, 17k-GFP and 17kXM-GFP, were prepared from the 60k-GFP construct. 17k-GFP contains the 17-kb upstream and 15-kb downstream regions, whereas 17kXM-GFP contains only the 17-kb upstream region as a regulatory element. As in 22k-GFP mice, GFP expression was observed in the kidney and liver in 17k-GFP mice under anemic conditions (Fig. 1C). In contrast, GFP expression was observed in the kidney but not in the liver in 17kXM-GFP mice (Fig. 1D), in good agreement with a previous analysis of mice lacking the 3′ hepatic-enhancer (HE) region of the gene (8).
EPO production in REP cells is virtually suspended in the normoxic steady state but is strongly induced in response to anemic and/or hypoxic insults (11). Therefore, we next attempted to examine GFP expression under normal and anemic conditions in more detail. The number of GFP-positive cells was strikingly increased in the kidneys and livers of 17k-GFP transgenic mice upon phlebotomy and induction of anemia (Fig. 1E and F). Because REP cells are characterized as CD73-positive fibroblast-like cells (12), we conducted double-immunostaining assays of anemic kidneys of 17k-GFP mice with GFP and CD73 antibodies. Higher-magnification images of the double immunostaining revealed that the GFP-positive cells in the anemic kidney also expressed CD73 (Fig. 1G). These results thus support our contention that 17k-GFP retains sufficient elements that regulate Epo gene expression in the adult kidney.
The CURE region is indispensable for inducing Epo gene expression in REP cells.
We next more closely examined the regions within 17k-GFP. We first searched for phylogenetically conserved genomic regions in the 17-kb upstream region of the genes in the placental mammal basewise conservation by PhyloP from the UCSC genome browser. We identified four highly conserved regions in the 14-kb region between 17.4 kb and 3.6 kb upstream of the Epo gene TSS (Fig. 2A). Most of this 5′ conserved region coincides with the Pop7 gene. We refer to the 14-kb region containing these conserved regulatory elements as the CURE region.
FIG 2.

The CURE region is critical for inducible renal Epo gene expression. (A) Diagram of 60k-Epo and δCURE-GFP transgenes. The dashed line indicates deletion of the CURE region. Placental mammal basewise conservation scores (PhyloP) of the locus surrounding the Epo gene (obtained from UCSC genome browser output [mm9] [http://genome.ucsc.edu]) are depicted above the diagram. (B and C) Immunohistochemical staining for GFP in cryosections of kidney (B) and liver (C) from normal (left) and anemic (right) δCURE-GFP mice. Note that while GFP expression of δCURE-GFP is detectable in the anemic liver (arrow), no GFP-positive cells are apparent in the anemic kidney. Scale bars, 100 μm.
We prepared the transgene δCURE-GFP by deleting the CURE region from the 60k-GFP BAC construct (Fig. 2A) and generated seven lines of mice harboring the δCURE-GFP transgene. We expected that if the CURE region was important for regulating the Epo gene in REP cells, the transgenic mice would not exhibit GFP expression in REP cells. We observed that all seven lines of mice did not express GFP in the kidney, irrespective of anemia induction (Fig. 2B and Table 1), whereas one line exhibited reporter GFP expression detectable by immunostaining in the liver in response to anemia (Fig. 2C). These results support our contention that the CURE region retains regulatory elements sufficient for renal Epo gene expression in response to anemic stress.
TABLE 1.
Summary of transgenic-mouse analysis
| Transgenic-mouse line transgene | Reporter protein |
|||
|---|---|---|---|---|
| Name | No. of lines expressed (no. of lines analyzed) |
|||
| Kidney | Liver | Brain | ||
| 22k-GFP | GFP | 3 (4) | 3 (4) | NDa |
| 17k-GFP | GFP | 6 (6) | 6 (6) | 2 (2) |
| 17kXM-GFP | GFP | 4 (5) | 0 (5) | ND |
| δF2-60k-GFP | GFP | 1 (2) | 1 (2) | 0 (2) |
| δCURE-GFP | GFP | 0 (7) | 1 (7) | 1 (7) |
| miniEpoHE-tdT | tdTomato | 2 (5) | 2 (5) | 0 (5) |
| δF3miniEpoHE-tdT | tdTomato | 1 (5) | 0 (5) | 0 (5) |
| sF2-mP-GFP | GFP | 0 (4) | 0 (4) | 0 (4) |
ND, not determined.
A δCURE-Epo construct retains regulatory activity that maintains homeostatic Epo gene expression levels.
The expression of the Epo gene is under positive and negative regulatory influences, and the two mechanisms are important for the maintenance of erythroid homeostasis (11, 14, 28–30, 33). This notion is strongly supported by the observation that mouse lines with transgenes harboring limited regions of the mouse Epo or human EPO gene locus exhibit polycythemia (14, 28–30, 33). This polycythemia appears to be caused by insufficiency of regulatory elements within the transgenes, and the induction of polycythemia is one of the main obstacles in establishing EPO-dependent renal anemia models. Therefore, we examined whether the deletion of the CURE region affects the homeostasis of erythropoiesis through hematopoietic-index analysis of the transgenic mice.
Because the δCURE-Epo transgenic mice retain one extra copy of the Epo gene, we crossed the δCURE-Epo mice with heterozygous Epo knockout mice (Epo+/−) and generated δCURE-Epo::Epo+/− mice to adjust the copy number of the Epo gene (Fig. 3A).
FIG 3.

δCURE-Epo does not induce polycythemia in transgenic mice. (A) Mating strategy to obtain δCURE-Epo::Epo+/− mice. (B) Copy numbers of the δCURE-Epo transgene in each δCURE-Epo::Epo+/− mouse line. The structures of the δCURE-Epo transgene and primer sets for copy number detection (blue arrows) are depicted above the qPCR results. The qPCR results were standardized utilizing the Gata2 or Myb locus. Estimated transgene copy numbers are depicted in blue. The data are means and SD (n = 3 to 8). (C) Hematocrit percentages for each line of adult male δCURE-Epo::Epo+/− mice. Note that no polycythemia was observed in these transgenic mice. The data are means and SD (n = 3 to 6).
We monitored the transgene copy numbers by quantitative PCR (qPCR) of genomic DNAs. Five pairs of primers were exploited in this analysis (−50 kb, −20 kb, −18 kb, −14 kb, and HE) (Fig. 3B); the primer sequence information is shown in Table S3 in the supplemental material. We established eight lines of the δCURE-Epo transgenic mice (Fig. 3B) and mated them with Epo+/− mice that were generated by homologously replacing the Epo locus with the GFP gene (Epo-GFP) (12, 14). The amplicon corresponding to the kb −14 region was missing in all lines of mice tested (Fig. 3B). Of the eight lines, line 331 exhibited 4 (or 5) copies of the δCURE-Epo transgene. The remaining lines displayed 1 or 2 copies of the δCURE-Epo transgene. Although lines 110 and 330 appeared to have shorter transgenes that were not detectable by the primer pair set at 50 kb upstream, all the lines, including lines 110 and 330, harbored the region spanning from 20 kb upstream to the Epo gene body except the CURE region (Fig. 3B).
All eight lines of δCURE-Epo::Epo+/− mice had normal hematocrit (Hct) values and did not exhibit any polycythemia (Fig. 3C). These results are particularly important because they clearly indicate that the δCURE-Epo transgene harbors a negative regulatory feedback mechanism for Epo gene regulation. In contrast, in the small-plasmid transgenic mice that we generated previously (14), all the transgenic-mouse lines except one (i.e., the ISAM mouse line) exhibit polycythemia, perhaps due to the lack of the gene-regulatory regions required for negative feedback. We conclude that in the case of δCURE-Epo::Epo+/− mice, the transgene possesses regulatory regions that suppress excessive and ectopic transgene expression under normal conditions.
The δCURE-Epo transgene rescues Epo-deficient mice from embryonic lethality, but the rescued mice exhibit severe anemia.
We then determined if the δCURE-Epo transgene rescues homozygous Epo gene knockout mice (Epo−/−) from embryonic lethality. To obtain δCURE-Epo::Epo−/− genotype mice, we mated all eight δCURE-Epo::Epo+/− mouse lines with Epo+/− mice (Fig. 4A). Four (lines 330, 331, 110, and 111) of the eight lines generated live newborns (Table 2). These rescued mice exhibited apparent anemia but grew into fertile adults. In all the rescued lines, the snouts and paws were markedly whiter than those of the littermate controls (Epo+/−) in the adult stage (Fig. 4B). These results indicate that the δCURE-Epo transgene partially rescues the EPO deficiency of the Epo−/− mice and that the δCURE-Epo::Epo−/− mice mimic a typical EPO-deficient condition.
FIG 4.

Severe anemia in AnRED mice due to deprivation of erythropoiesis. (A) Mating strategy to obtain δCURE-Epo::Epo−/− (AnRED) mice. (B) Snouts and paws of AnRED (line 110) and littermate control (Epo+/−) mice. (C) PCR products derived from transgenes integrated into δCURE-GFP transgenic mice and AnRED mice. The blue arrows at the top show the positions of forward and reverse primers against the δCURE-Epo BAC clone. Amplicons (7.83 and 8.56 kb) recovered from the genomes of δCURE-GFP transgenic mice and AnRED mice are indicated by blue and green arrowheads, respectively. PCR products derived from circular δCURE-GFP and δCURE-Epo BAC DNAs were used as size controls (asterisks). (D) Hematocrits of adult male AnRED mouse lines (n = 4 or 5) and male Epo+/− controls (n = 7). The data are means and SD; **, P < 0.005 compared with Epo+/− (Student's t test). (E) Mean corpuscular volume (MCV) values for adult AnRED mouse lines (n = 3 to 12) and Epo+/− controls (n = 3). The data are means and SD. (F) Mean corpuscular hemoglobin concentration (MCHC) values for adult AnRED mouse lines (n = 3 to 12) and Epo+/− controls (n = 3). The data are means and SD. (G) Peripheral blood cells of adult AnRED (line 110) (top) or Epo+/− (bottom) mice by May-Grünwald-Giemsa staining. Scale bars, 10 μm. (H and I) Turnover of RBCs from the AnRED (line 110; n = 7) and normal control mice (Epo+/−, n = 4; δCURE-Epo::Epo+/−, n = 3) (H) and RBC life spans of AnRED and control mice (I). The data are means and SD. (J) Peripheral blood of adult AnRED (line 110) (top) or Epo+/− (bottom) mice subjected to new methylene blue staining. The arrows indicate reticulocytes. The percentages of reticulocytes of AnRED (lines 331 and 110) and Epo+/− mice were calculated using more than 1,500 RBCs randomly selected from 3 to 5 fields. Scale bars, 10 μm. The data are means and SD; *, P < 0.05 compared with Epo+/− mice (Student's t test).
TABLE 2.
Numbers of pups in each genotype from δCURE-Epo::Epo+/− × Epo+/− crossesb
| Line | No. of pups with genotype: |
|||||
|---|---|---|---|---|---|---|
| WTa (1/7) | δCURE-Epo (1/7) | Epo+/− (2/7) | δCURE-Epo::Epo+/− (2/7) | AnRED (1/7) | Total | |
| 1326 | 20 | 14 | 31 | 14 | 0 | 79 |
| 327 | 19 | 16 | 23 | 14 | 0 | 72 |
| 328 | 2 | 4 | 1 | 24 | 0 | 31 |
| 329 | 14 | 8 | 23 | 15 | 0 | 60 |
| 330 | 9 | 12 | 23 | 25 | 5 | 74 |
| 331 | 6 | 4 | 29 | 12 | 6 | 57 |
| 110 | 8 | 16 | 18 | 35 | 9 | 86 |
| 111 | 15 | 12 | 16 | 24 | 4 | 71 |
WT, wild type.
Numbers in parentheses are expected ratios.
By means of long genomic PCR assays utilizing a primer set recognizing sequences located 18.6 kb upstream (forward primer) and 3.7 kb downstream (reverse primer) from the Epo gene transcription start site, we confirmed that the bulk of the Epo-BAC DNA containing a 17-kb upstream region and a downstream hepatic enhancer region was integrated into the genome of the transgenic mice in the right order (Fig. 4C). Because the δCURE-Epo::Epo−/− mice represent an ideal model for kidney-originated EPO-deficient anemia, we refer to these mice as AnRED mice, and we performed further characterization of three lines (lines 110, 330, and 331).
The hematocrit values of adult AnRED mice were reduced to approximately 20%, showing normocytic and normochromic anemia (Fig. 4D to F). May-Grünwald-Giemsa staining of AnRED RBCs revealed no apparent morphological abnormality (Fig. 4G). In addition, the RBC life span of AnRED mice was comparable to that of nonanemic control mice (Fig. 4H and I). It is noteworthy that the frequency of the RNA-rich reticulocytes was decreased in AnRED mice, although this trend was not statistically significant in line 331 mice (Fig. 4J). Thus, reduced RBC production is the most likely cause of anemia in AnRED mice.
Weak expression of Epo from the δCURE-Epo transgene in REP cells.
We surmised that anemia in the AnRED mice was provoked by a severe decrease in Epo expression in the kidney due to the deletion of the CURE region from the Epo-BAC transgene. When we compared Epo-GFP gene expression from the endogenous Epo locus by quantitative reverse transcription (qRT)-PCR analysis in three EPO-producing tissues (i.e., liver, kidney, and brain), we found that Epo-GFP expression was detectable in all three EPO-producing tissues of AnRED mice, but the Epo-GFP expression level was strikingly higher in the kidney than in the liver and brain (Fig. 5A). Immunohistochemical analyses of GFP in the kidneys also showed that GFP-expressing REP cells were easily detectable in the interstitial region of the AnRED mouse renal cortex (Fig. 5B), but the cells were rarely detectable in the control Epo+/− mice even in the corticomedullary junction (Fig. 5C). Similarly, GFP was expressed in hepatocytes of AnRED mice but not in Epo+/− hepatocytes (Fig. 5D and E). Thus, Epo-GFP expression in EPO-producing cells is strongly activated in the AnRED mice due to chronic anemia.
FIG 5.

Deletion of the CURE region abrogates transgenic Epo gene expression in AnRED mice. (A) qRT-PCR analysis of Epo-GFP expression from the endogenous Epo gene locus in the liver, kidney, and brain of AnRED line 110 (n = 3), line 330 (n = 4), and line 331 (n = 3) mice. The data represent relative expression levels, with data for the liver set at 1. The data are means and SD; *, P < 0.05 compared to each tissue sample of the same line (Student's t test). (B to E) Immunohistochemical staining for GFP in cryosections of kidneys (B and C) and livers (D and E) of AnRED (B and D) and littermate Epo+/− (C and E) mice. CD73 is a cell surface marker of renal fibroblasts and REP cells (B and C, red stain). Note that nearly all GFP-positive cells in the kidney express CD73. Scale bars, 100 μm. g, glomerulus. (F) Transgene-derived Epo gene expression in the mice used in panel A. (G) Levels of transgene-derived Epo gene expression in the liver, kidney, and brain in AnRED mice (line 110; n = 9) in comparison with the levels of endogenous Epo gene expression in healthy (n = 5) and anemic (n = 5) wild-type mice. Three out of nine data sets of AnRED mice were used in panel A. The data represent relative expression levels of mRNAs, with data for normal wild-type kidney set at 1. ND, not detectable. The data are means and SD; *, P < 0.05 compared to kidney samples from AnRED and healthy wild-type mice (Student's t test). (H) Results of ELISA analysis for EPO protein in plasma from AnRED (line 110, n = 9; line 330, n = 4; line 331, n = 5), Epo+/− (n = 5), and healthy (Nor; n = 6) or anemic (Ane; n = 5) wild-type mice. The data are means and SD; *, P < 0.05 compared to samples from each line of AnRED and healthy wild-type mice (Student's t test).
In contrast, the expression levels of transgenic Epo mRNA were comparable between kidneys and livers of AnRED mice, and the level was moderately higher in brains (Fig. 5F). In addition, when we compared Epo mRNA levels from the δCURE-Epo transgene of AnRED mice with those from the endogenous Epo genes of normal and phlebotomized wild-type mice, we found that Epo mRNA levels in the kidneys of AnRED mice were remarkably lower than those in normal wild-type mice (Fig. 5G, green bars), even though the hematocrit levels were severely reduced in the AnRED mice. Epo mRNA levels in the livers of the AnRED mice were slightly elevated compared to those of the normal wild-type mice but less than 1/10 those of the phlebotomized mice (Fig. 5G, brown bars). We surmise that this discrepancy may be due to differential hypoxia regulation under acute and chronic hypoxic conditions (34–36). Intriguingly, the level of Epo gene expression in brains of wild-type mice was comparable to that in AnRED mice and tended to be elevated by acute hypoxic stimuli (Fig. 5G, blue bars). Consistent with the qRT-PCR results, plasma-EPO concentrations of AnRED mice were significantly lower than those of normal wild-type mice (Fig. 5H). These results support our conclusion that EPO production in REP cells is markedly enfeebled in AnRED mice, resulting in chronic severe anemia.
The CURE region is dispensable for Epo expression in the brain.
Some glial cells inducibly express Epo in response to hypoxic stress (9). Consistent with this observation, immunostaining revealed that GFP-positive cells actually resided in the AnRED mouse brain (Fig. 6A). To address the regulatory mechanisms of Epo gene expression in the brain, we examined Epo gene regulation by reporter transgenic-mouse analysis under anemic conditions. For this purpose, we used the 17k-GFP transgenic-mouse line, which retains sufficient regulatory elements to recapitulate endogenous Epo gene regulation in REP cells and hepatocytes, and the δCURE-GFP transgenic-mouse line, which lacks the important regulatory element for renal Epo gene regulation.
FIG 6.
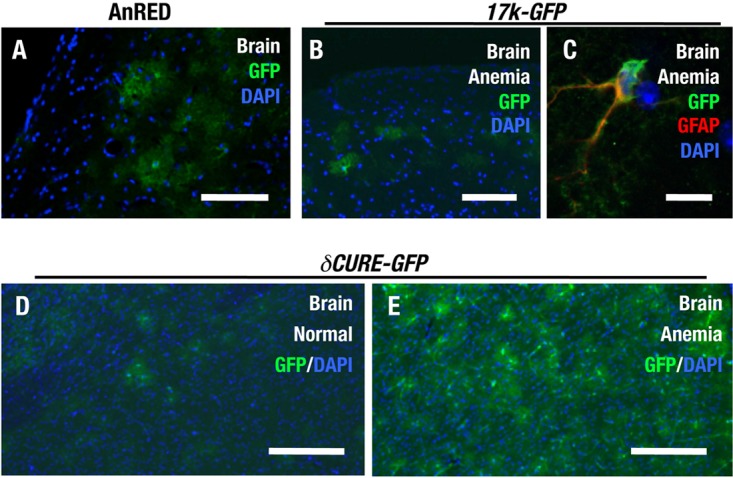
δCURE-GFP induces transgene expression in the brain under anemic stress. (A) Immunohistochemical staining for GFP in a cryosection of AnRED brain. (B and C) Immunohistochemical staining for GFP in a cryosection of 17k-GFP brain (B) and double immunohistochemical staining for GFP and GFAP (C). Note that the GFP-positive cells in the brain of the 17k-GFP mouse are GFAP-positive astrocytes. (D and E) Immunohistochemical staining for GFP in cryosections of the brain of normal δCURE-GFP (D) and anemic δCURE-GFP (E) mice. Scale bars, 100 μm (A, B, D, and E) and 25 μm (C).
Immunostaining analysis with the anti-GFP antibody detected GFP-positive cells in the brains of anemic 17k-GFP mice (Fig. 6B). Higher-magnification images of double immunostaining with the anti-GFAP antibody revealed that these cells express the astrocyte marker GFAP (Fig. 6C). Importantly, δCURE-GFP mice also exhibited GFP expression in the brain, even under normal conditions (Fig. 6D), and the number of these GFP-positive cells increased in response to anemic stress (Fig. 6E). Our results also suggest that Epo gene expression in the brain is under negative regulation through the CURE region. These results imply that Epo gene expression in brain astrocytes is regulated in a unique manner distinct from that operating in the kidney.
Epo gene expression in the fetal stage is independent of the CURE region.
We maintained AnRED mouse lines by crossing with Epo+/− mice. Despite severe anemia, the AnRED mouse was viable and fertile. Because Epo−/− mice are embryonic lethal, three other mouse genotypes, i.e., AnRED (δCURE-Epo::Epo−/−), δCURE-Epo::Epo+/−, and Epo+/−, are predicted in an equal ratio (1/3). In fact, in this crossing, we obtained AnRED mice and two other genotype littermates in Mendelian ratios (Table 3). This result suggests that Epo gene expression in the embryonic stage is supported by the regulatory elements that reside in the δCURE-Epo transgene (2).
TABLE 3.
Numbers of pups in each genotype from AnRED (δCURE-Epo::Epo−/−) × Epo+/− crossesa
| Line | No. of pups with genotype: |
|||
|---|---|---|---|---|
| Epo+/− (1/3) | δCURE-Epo::Epo+/− (1/3) | AnRED (1/3) | Total | |
| 330 | 18 | 18 | 16 | 52 |
| 331 | 13 | 5 | 5 | 23 |
| 110 | 5 | 12 | 10 | 27 |
| 111 | 3 | 3 | 2 | 8 |
| Total | 39 | 38 | 33 | 110 |
Numbers in parentheses are expected ratios.
To confirm this assumption, we compared GFP expression in E10.5 17k-GFP embryos with that in E10.5 δCURE-GFP embryos. In the E10.5 embryonic stage, neural epithelium cells, optical vesicle cells, and fetal liver cells express the Epo gene (2). In fact, immunostaining analyses indicated that E10.5 17k-GFP embryos expressed GFP in the fetal liver (Fig. 7A), neural epithelium (Fig. 7B), and optic vesicle (Fig. 7C). Importantly, we detected strong GFP expression in the fetal liver (Fig. 7D), neural epithelium (Fig. 7E), and optic vesicle (Fig. 7F) of E10.5 δCURE-GFP embryos. GFP expression was not observed in any of these tissues from E10.5 wild-type embryos (Fig. 7G to I). These results thus indicate that embryonic EPO-producing cells at E10.5 express the Epo gene independently of the CURE region, enabling sufficient EPO expression in the AnRED mouse during the developmental stage.
FIG 7.
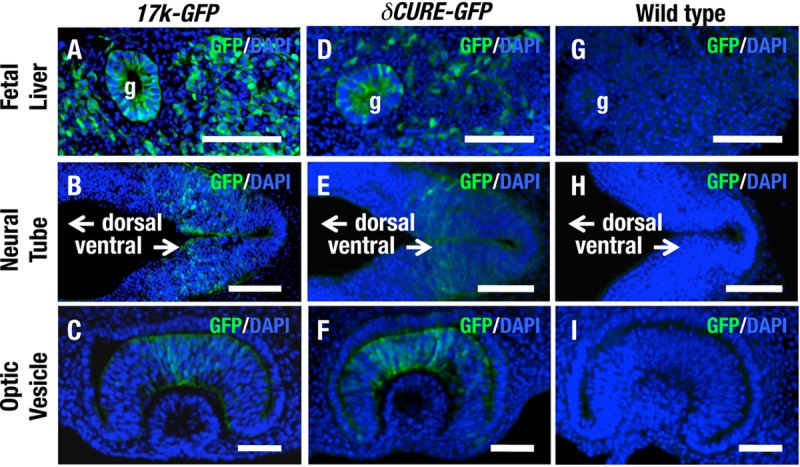
GFP expression from δCURE-GFP recapitulates fetal EPO expression. Immunohistochemical staining for GFP in cryosections of fetal liver (A, D, and G), neural tube (B, E, and H), and optic vesicle (C, F, and I) of 17k-GFP (A to C), δCURE-GFP (D to F), and wild-type (G to I) mice at E10.5. The neural tubes indicated in B, E, and H are located adjacent to otic vesicles; dorsal and ventral sides are indicated by arrows. Scale bars, 100 μm. g, gut.
Regulatory elements responsible for inducible Epo gene expression in REP cells.
The CURE region encompasses a 14-kb locus upstream of the Epo gene and includes several regulatory elements important for Epo gene expression in REP cells. However, the functions of the cis-acting elements remain to be clarified. To identify elements critical for Epo gene expression in REP cells, we first searched for phylogenetically conserved elements, because the gene is well conserved between humans and mice (37–40). As described above, we identified four highly conserved regions in the CURE region using the UCSC genome browser. Including these elements, we delimited four regulatory regions (F1 to F4) in the 17-kb upstream region of the gene, three of which (F1 to F3) are included in the CURE region (Fig. 8A). The F4 element contains promoter-proximal regions.
FIG 8.
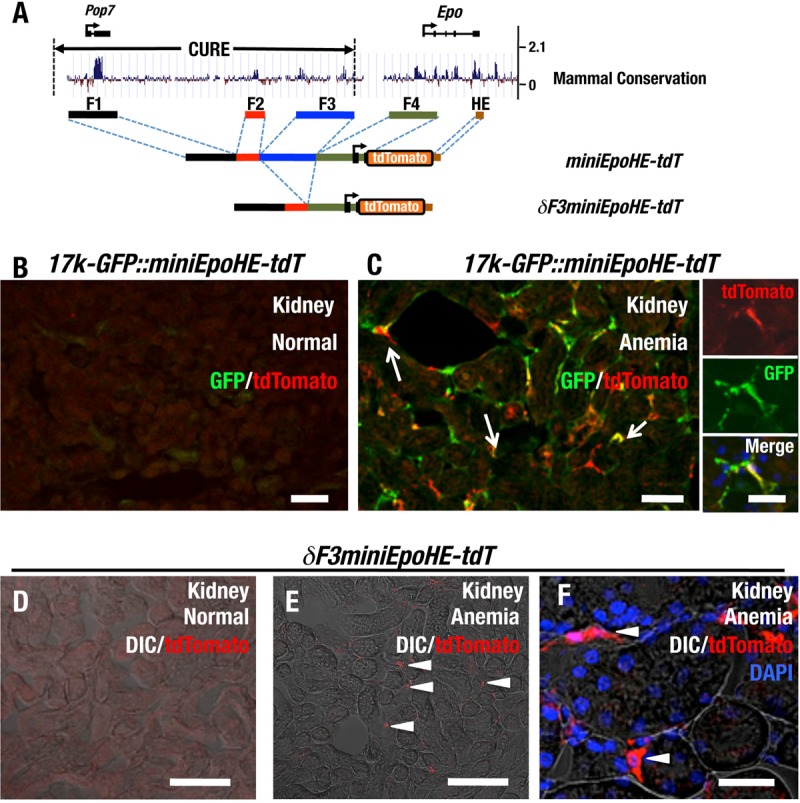
Highly conserved regions in the 17-kb upstream region of the Epo gene retain renal Epo gene-regulatory elements. (A) Diagram of transgenic constructs of miniEpoHE-tdT and δF3miniEpoHE-tdT. The placental mammal basewise conservation (PhyloP) data around the Epo gene locus from the UCSC genome browser output (mm9) (http://genome.ucsc.edu) are shown at the top. The locations of the Pop7 gene, the Epo gene, and the CURE region are depicted above the diagram. (B and C) Immunohistochemical staining for tdTomato and GFP in a cryosection of the kidney of the 17k-GFP::miniEpoHE-tdT compound mouse under normal (B) and anemic (C) conditions. Many of the tdTomato-positive cells also expressed GFP in the anemic kidney (arrows). (D to F) Immunohistochemical staining for tdTomato in cryosections of the kidneys of δF3miniEpoHE-tdT mice under normal (D) and anemic (E and F) conditions. tdTomato-positive cells were detectable under anemic conditions (arrowheads), located in the interstitial region of the cortex. Scale bars, 100 μm (B, C [left], D, and E) and 25 μm (C [right] and F).
To examine the contributions of these conserved regions to the transcriptional activity of the gene, we generated two minigenes utilizing the four regions (Fig. 8A). One was a miniEpoHE-tdT construct in which the F1 to F4 fragments, the tdTomato gene, and the HE region downstream of the Epo gene were linked. The other was a δF3miniEpoHE-tdT construct lacking the F3 region from miniEpoHE-tdT. We generated five transgenic-mouse lines for each construct (Table 1).
To evaluate inducible tdTomato expression, we analyzed transgene expression in the kidney and liver under normal and anemic conditions by immunostaining analyses using the anti-DsRed antibody. Two of the five miniEpoHE-tdT lines exhibited tdTomato accumulation in the kidney (Table 1). We crossed these transgenic-mouse lines with the 17k-GFP line and obtained 17k-GFP::miniEpoHE-tdT compound transgenic-mouse lines. We then compared the expression profiles of 17k-GFP and miniEpoHE-tdT. Few GFP- and/or tdTomato-positive cells were observed in uninduced kidney (Fig. 8B), but upon anemic induction, REP cells expressing both tdTomato and GFP were observed (Fig. 8C). These results indicate that cis-regulatory elements sufficient for renal Epo gene expression exist in these four conserved regions.
Of the four cis-acting regions, F4 includes the promoter and first exon of the Epo gene plus the first intron, which has been assumed to harbor an important regulatory element (32). Inspection of the other regions revealed that F1 includes the Pop7 gene (Fig. 8A) and F2 harbors a conserved HRE motif. In contrast, we did not identify an important annotation for F3. Therefore, to narrow down the regulatory domains and verify the reproducibility of this minigene approach, five lines of δF3miniEpoHE-tdT transgenic mice were established in which F3 was deleted from miniEpoHE-tdT (Table 1). Transgene expression was monitored in REP cells under normal (Fig. 8D) and anemic (Fig. 8E) conditions. The results revealed that one of the five lines expressed the tdTomato reporter gene in the kidney in an inducible manner. A higher-magnification image of the immunostaining clearly demonstrated that the tdTomato-positive cells in the anemic kidney were located in the interstitial region of the renal cortex (Fig. 8F), indicating that these tdTomato-positive cells are indeed REP cells. These results imply that the F1, F2, and F4 regions include the REP cell-specific and anemic-stress-inducible cis-acting regulatory elements of the Epo gene.
An HRE in F2 is a functional HRE with activity comparable to that of the 3′ HRE in vitro.
Inducible Epo gene expression in REP cells has been assumed to be regulated by an unknown HRE because the HE region that contains the only known functional HRE in this locus is dispensable for gene expression in the kidney. Therefore, we assumed, based on the results of the minigene analyses, that the phylogenetically conserved HRE located in the F2 region (−8kHRE) may act as the HRE essential for Epo gene expression in REP cells (Fig. 9A).
FIG 9.

HRE at −8 kb is not necessary or sufficient for renal Epo gene regulation. (A) Diagram of a transgenic construct of δF2-60k-GFP. The mammalian conservation of the −8kHRE element is shown, utilizing UCSC genome browser output (mm9). The conserved HRE is boxed. (B and C) Luciferase reporter assay. (B) Hep3B cells were cotransfected with each firefly luciferase reporter construct, along with the Renilla luciferase control plasmid. After transfection, Hep3B cells were incubated under normoxic and hypoxic (1% O2) conditions for 24 h. All the results are displayed as the ratio of firefly to Renilla luciferase activity. The mutated sequence of −8kHRE in the Mu-sF2-Luc construct is depicted in red. (C) Note that the hypoxia-inducible luciferase activity of sF2-mPLuc is strong and comparable with that of HE-mPLuc, and the activity is dependent on the −8kHRE motif. (D) Double immunohistochemical staining for GFP and CD73 in cryosections of the kidneys of anemic sF2-mP-GFP mice. All the mice analyzed from nine lines did not express GFP in the kidney. CD73 was used as a renal fibroblast marker (including REP cells). (E) Immunohistochemical staining for GFP in renal cryosections of δF2-60k-GFP under normoxic conditions (left) and anemic conditions (right). Note that anemia-inducible GFP expression from the δF2-60k-GFP transgene is detectable in REP cells (arrowheads) of mice without the F2 element. Scale bars, 100 μm.
To determine if −8kHRE is functional, we first conducted a reporter transfection-transactivation assay. We generated luciferase-reporter constructs using the 624-bp region of the Epo gene promoter (mP) linked to a short F2 (sF2) region spanning 264 bp containing −8kHRE or mutated −8kHRE (Mu-sF2) (Fig. 9B). The HE region harboring one previously verified HRE was used as a positive control. Each construct was cotransfected into the hepatoma cell line Hep3B with a Renilla luciferase control construct. Because we detected luciferase reporter activity under both normoxic and hypoxic (1% O2; 24 h) conditions, the test luciferase activity was adjusted to the Renilla luciferase activity, and we calculated the fold induction (Fig. 9C).
The relative luciferase activity of the mP-Luc construct was approximately 10-fold higher under hypoxic conditions than under normoxic conditions (Fig. 9B), indicating that the mP region harbors some transactivation activity in response to hypoxic stress. In contrast, the sF2-mP-Luc construct exhibited much higher luciferase activity than mP-Luc in a hypoxia-inducible manner (Fig. 9B). This hypoxia-inducible transcriptional activity was abrogated in Mu-sF2-mP-Luc transfection, and the inducible activity of Mu-sF2-mP-Luc was nearly comparable to that of the mP-Luc construct. We also tested HRE in the HE enhancer of the Epo gene using an HE-mP-Luc construct. Transfection of the HE-mP-Luc construct resulted in even higher luciferase activity than transfection of the sF2-mP-Luc construct. The assessment of fold induction, i.e., hypoxia versus normoxia, revealed that transfection of sF2-mP-Luc and HE-mP-Luc increased the inducible expression of luciferase activity by greater than 40-fold and 60-fold, respectively (Fig. 9C). These results indicate that −8kHRE is a functional HRE with activity nearly identical to that of the classic 3′ HRE.
An HRE in F2 is not necessary and sufficient for Epo gene expression in REP cells.
Based on the results of the transfection analysis, we hypothesized that sF2 might retain enhancer activity driving Epo gene expression in REP cells. To investigate this hypothesis, we generated two transgenic-mouse lines (Table 1). One was established using a plasmid-based construct containing the sF2 and mP regions (sF2-mP-GFP) (Fig. 9D), while the other was established with the 60k-BAC transgene in which the F2 region of 60k-GFP was deleted (δF2-60k-GFP) (Fig. 9A). In the former case, 9 lines were established, but all the sF2-mP-GFP lines did not induce GFP reporter gene expression in the kidney, even under anemic conditions (Fig. 9D). These results suggest that the sF2 region is insufficient to drive Epo gene expression in REP cells. In the latter case, one of the two established lines exhibited anemia-inducible GFP expression in REP cells (Fig. 9E), suggesting that deletion of the F2 region in δF2-60k-GFP did not affect Epo gene expression from this BAC transgene. Taken together, these results suggest that although −8kHRE is a functional HRE in the transfection-transactivation study, the HRE per se is not sufficient for Epo gene expression in REP cells in vivo.
DISCUSSION
Evidence suggests that the cis-acting regulatory element(s) for Epo gene transcription in the kidney resides in the 5′ region of the gene (28). The HRE located at kb −8 (−8kHRE) has been postulated to be functional for renal Epo gene expression because the HRE overlaps a DNase I HS (30) and is functional in Luc reporter transfection-transactivation analyses (31). In this study, we attempted to verify the contributions of the HRE and other upstream elements in proximity to the HRE to Epo gene expression in REP cells in vivo (Fig. 10A). Minigene transgenic-mouse analyses revealed that three phylogenetically conserved regions in the Epo gene upstream CURE region are sufficient to drive inducible Epo reporter transgene expression in REP cells (Fig. 10B). Consistent with this observation, deletion analyses of the upstream regulatory regions demonstrated that the CURE region is indispensable for renal Epo gene expression (Fig. 10C). However, contrary to our expectations, deletion analyses of the F2 region, which contains −8kHRE, maintained expression of the reporter gene in REP cells of transgenic-mouse kidneys, indicating that −8kHRE is dispensable for reporter expression in REP cells. These results indicate that Epo gene expression in REP cells is under the influence of multiple regulatory elements.
FIG 10.

The AnRED mouse is an improved mouse model of renal anemia. Shown is regulation of the endogenous Epo gene expression and related transgene expression in REP cells. (A) REP cells exploit several regulatory elements located in proximity to the Epo gene for gene expression. Of these, three elements in the CURE region (F1, F2, and F3) are critical for the massive induction of Epo gene expression in the anemic state. The hepatic enhancer (3′ HRE) appears to be dispensable for Epo gene expression in REP cells (dashed arrow). (B) The miniEpo-tdT transgene retains sufficient machinery for Epo gene regulation in REP cells. The miniEpo-tdT transgene directs anemia-inducible expression of a reporter gene in REP cells. (C) The δCURE-Epo transgene retains activity that suppresses ectopic expression. The δCURE-Epo transgene lacking the CURE region retains not only hepatic Epo gene regulatory activity but also negative regulatory activities that suppress excessive and/or ectopic transgenic-reporter expression. (D) The 3.3k-Epo3′ transgene harbors the hepatic enhancer but has lost the activity that suppresses ectopic expression of the transgene. The 3.3k-Epo3′ transgene does not cover the comprehensive regulation that CURE plus AnRED can execute. In addition, the 3.3k-Epo3′ transgene is too short to avoid position effect variations that are inevitable with the transgenic-mouse approach. Hence, 3.3k-Epo3'::Epo−/− mice usually exhibit varying hematocrit values, whereas AnRED mice exhibit stable hematocrit values.
Deletion of the CURE region spanning from 17.4 to 3.6 kb upstream of the Epo gene abrogated expression of the gene in the kidney. Based on this finding, we developed novel AnRED mouse lines exhibiting severe EPO-deficient anemia. Comparison of the AnRED mouse with the ISAM model mouse, an alternative chronic severe anemia model mouse that we established previously (14), revealed several intriguing features that are retained in AnRED mice. The transgene exploited for the generation of the ISAM mouse is an 8.8-kb fragment encompassing the 3.3-kb upstream and 4.5-kb downstream regions of the Epo gene (3.3k-Epo3′) (Fig. 10D). Although we established many lines of transgenic mice with this construct and used it for the rescue of Epo gene knockout mice, only one line, i.e., the ISAM mouse, exhibited severe renal anemia (14). The other established mouse lines had polycythemia. We surmise that these diverse phenotypes of 3.3k-Epo3′ might be due to the presence of incomplete regulatory elements in the transgene and/or position effects in the transgene.
We therefore precisely delineated the upstream regulatory elements of the Epo gene and established transgenic-mouse lines that faithfully recapitulate Epo gene expression except for REP cells. Because the CURE region is critical for Epo gene expression in REP cells, we attempted to exploit the δCURE-Epo transgene, which retains a much longer region than the 3.3k-Epo3′ transgene (Fig. 10C). As expected, all δCURE-Epo transgenic-mouse lines crossed with Epo heterozygous mice (Epo+/−) consistently exhibited normal hematocrit values, and all established AnRED lines reproducibly exhibited chronic severe anemia. These observations suggest that the δCURE-Epo transgene possesses regulatory elements that suppress excessive and/or ectopic transgene expression under normal conditions, indicating that there are multiple regulatory regions for Epo gene expression in animals, in addition to those for the kidney and liver (8).
In this study, we experienced low positive numbers in certain transgene constructs, for instance, one or two positives out of five lines in miniEpoHE-tdT and δF3miniEpoHE-tdT transgenic-mouse analyses and one positive out of seven lines in the δCURE-GFP case. The former may be due to position effects, as these minitransgene constructs are plasmid based and easily affected by the regulatory influences residing in integrated positions. In contrast, as in the BAC-based δCURE-GFP case, we surmise that failures in transgene integration may be one of the reasons for the low positive numbers.
We determined that the Epo gene 3′ enhancer is specific for gene expression in the liver and refer to this enhancer as a hepatic enhancer (HE). Closer analyses of the HE further revealed that there are two distinctive stages of embryonic livers during development, i.e., Hep-E and Hep-L, in terms of HE usage in Epo gene expression (8). Hep-L corresponds to the liver after E13.5, whereas Hep-E corresponds to the liver before E13.5. Epo gene expression in the Hep-L stage liver requires the HE (8). In contrast, and to our surprise, Epo gene expression in the Hep-E stage liver does not require the HE (8). Whereas precise regulatory elements for gene expression in Hep-E are not clear, we recently determined that Hep-E stage livers of 17k-GFP reporter transgenic-mouse embryos express GFP (2), suggesting that the CURE region may also contribute to Epo gene expression in Hep-E. However, deletion of the CURE region does not affect transgene expression in Hep-E, clearly demonstrating that the regulatory mechanism of Epo gene expression in the Hep-E stage liver differs from that operating in REP cells.
The promoter region and the first intron of the Epo gene exhibit high-level conservation between humans and mice, suggesting that these regions may make important contributions to Epo gene expression (11). In fact, we identified a GATA-binding motif in the promoter region that acts as a negative regulatory element that represses ectopic expression of the gene in certain non-EPO-producing cells, including embryonic epidermis (2, 11, 41). In this regard, the Epo gene promoter region retains hypoxia-inducible transactivation activity in luciferase reporter transfection-transactivation assays. This observation suggests that the promoter-adjacent region may be utilized for Epo gene expression in the Hep-E stage liver and inducible expression of the Epo gene in other tissues.
Myofibroblastic transformation of REP cells in CKD causes renal anemia (16). In a unilateral ureteral obstruction (UUO) model, REP cells are transformed into MF-REP cells and stop EPO production (15). The damaged REP cells in this model exhibit significant plasticity in terms of EPO production (15), suggesting that epigenetic silencing of the Epo gene underlies gene repression in MF-REP cells in CKD. Recently, FOXD1-positive renal fibroblasts were determined to include REP cells, and hypermethylated status was detected in the cells under UUO conditions in the −8kHRE region, as well as the Epo gene coding locus (42–44). Consistent with these observations, we demonstrate here that the CURE region containing the −8kHRE is necessary for renal Epo gene regulation. These broad observations suggest that Epo gene repression under CKD conditions is regulated by methylation of not only the Epo gene locus but also the renal regulatory elements in the CURE region.
In conclusion, we have demonstrated that the CURE region, harboring three phylogenetically conserved elements, is essential for Epo gene expression in REP cells. Based on this knowledge, we established AnRED mice by deleting kidney-specific Epo gene regulation. Further studies are needed to delineate Epo gene regulation in REP cells because Epo gene expression appears to be subject to a very complicated mechanism, and details remain elusive.
MATERIALS AND METHODS
Generation of transgene constructs.
The 22k-GFP, 60k-Epo, and 60k-GFP BAC-based transgenes were described previously (8, 11, 32). The XhoI-HindIII fragment was isolated from 60k-GFP and used as the 17k-GFP transgene (2). To construct 17kXM-GFP, the MulI site was inserted in the 3′ region of the EGFP gene of 60k-GFP, and the XhoI-MulI fragment was used as a transgene.
To construct vectors targeting the F2 region and the CURE region, approximately 1-kb 5′- and 3′-homologous sequences of the respective regions were amplified by PCR. To generate targeting constructs, the 5′- and 3′-homologous sequences were cloned into a vector containing a neomycin resistance gene cassette. The primer sets for targeting vector construction are described in Table S1 in the supplemental material, along with the other primer sets. These two targeting vectors were used to construct δF2-60k-GFP, δCURE-Epo, and δCURE-GFP. The recombinant BAC clones were verified by PCR amplification and sequencing.
To construct F2-F4miniEpo-tdT/pBSII-SK, we ligated the F2, F3, and mP fragments and the tdTomato gene into the pBluescript2-SK vector (Agilent) using the GeneArt Seamless Cloning and Assembly kit (Invitrogen). We also ligated the F2 and mP fragments and the tdTomato gene into a pBluescript2-SK vector using the same method to construct dF3-F2-F4miniEpo-tdT/pBSII-SK. The F1 and HE regions were amplified by PCR, and the amplicons were subcloned into the pGEM-T Easy vector (Promega) and the pBluescript2-SK vector, respectively. To construct miniEpoHE-tdT and δF3miniEpoHE-tdT, these F1 and HE fragments were extracted and inserted upstream of the F2 fragment and downstream of the tdTomato gene of F2-F4miniEpo-tdT/pBSII-SK and dF3-F2-F4miniEpo-tdT/pBSII-SK, respectively. To construct sF2-mP-GFP, the heat shock gene promoter of the HSP-GFP construct was removed (8), and the PCR-amplified sF2 and mP fragments were ligated in the 5′ flanking region of the GFP gene.
Gene-modified mouse lines.
The 22k-GFP, 17k-GFP, 17kXm-GFP, miniEpoHE-tdT, and δF3miniEpoHE-tdT transgenes were linearized, whereas the δF2-GFP, δCURE-GFP, and δCURE-Epo transgenes were used as circular constructs. These transgenes were microinjected into fertilized eggs obtained from BDF1 mice (CLEA, Japan). The numbers of established transgenic-mouse lines of each construct are summarized in Table 1 and Table 2. The endogenous Epo gene (C57BL/6) and the transgenic Epo gene (129sv) were distinguished by difference in the downstream region of the Epo gene. For genotyping δCURE-Epo, we used strain-specific primer sets that recognize the distinguishable sequence. For long-range genomic PCR, we used a pair of 40-mer specific primers and KOD FX DNA polymerase (Toyobo). The sequences of primer sets for genotyping are shown in Table S2 in the supplemental material. Animal experiments were performed according to the Regulations for Animal Experiments and Related Activities of Tohoku University.
Copy number detection.
Genomic DNA was obtained from tail samples of δCURE-Epo::Epo+/− mice. Copy number detection was performed with the QuantStudio 12k Flex system (Applied Biosystems) and qPCR with the Thunderbird qPCR mix (Toyobo). The value for each sample was adjusted using the Myb and Gata2 genes. The sequence information for all the primers used in qPCR analysis is provided in Table S3 in the supplemental material.
Blood analysis and phlebotomy.
To induce anemia, defined as a Hct of less than 20%, mice were bled six times from the retro-orbital plexus or submandibular vein at 6, 18, 30, 42, 54, and 68 h before analysis. We analyzed EDTA anticoagulated peripheral blood samples using an automatic cell counter (Nihon-Kohden). Plasma EPO concentrations were measured with a Quantikine enzyme-linked immunosorbent assay (ELISA) mouse erythropoietin immunoassay kit (R&D systems). Peripheral blood smears were stained with May-Grünwald-Giemsa stain. To analyze reticulocytes, peripheral blood samples were stained with new methylene blue stain and made smear samples. Three to five fields of stained smears were captured, and the reticulocytes were counted with ImageJ software.
RBC life span.
RBCs were marked by intravenous administration of d-biotinyl-N-hydroxysuccinimide (Bachem) at 50 mg/kg of body weight. Approximately 20 μl of peripheral blood was collected from the tail vein at 1, 8, 15, 22, 29, and 36 days after the injection. Biotinylated RBCs were incubated with allophycocyanin-conjugated streptavidin (BD Biosciences) and analyzed with FACSVERSE (BD Bioscience).
Quantitative reverse transcription-PCR.
Total tissue RNA was extracted using Isogen (Nippon-Gene), and cDNA was synthesized using the SuperScript RT III first-strand synthesis system (Thermo Fisher Scientific) or a ReverTra Ace qPCR RT kit (Toyobo). qPCR of reverse-transcribed samples (qRT-PCR) was performed using an ABI7300, ABI7500, QuantStudio 6, or QuantStudio 12k Flex system (Applied Biosystems) with target-specific primers and Power SYBR green PCR master mix (Applied Biosystems) or Thunderbird qPCR mix (Toyobo). The expression levels of Hprt and Gapdh were used as internal standards. The sequence information for all primers used in the qRT-PCR analysis is provided in Table S4 in the supplemental material.
Histological analysis.
For immunohistochemical analysis, tissues were fixed in 4% paraformaldehyde-PBS (Nacalai Tesque) for 3 h. The fixed tissues were embedded in Tissue-Tek OCT (Sakura Finetek). The frozen sections (25-μm thickness) were blocked with Protein Block Serum-Free (Dako) and immunostained with the following antibodies as the primary antibody: anti-GFP antibody (Medical and Biological Laboratories), anti-DsRed antiserum (Clontech), anti-CD73 antibody (eBioscience), anti-GFAP antibody (Sigma), and anti-CD105 antibody (Biolegend). Alexa Fluor 488-conjugated anti-rabbit IgG antibody and Alexa Fluor 555-conjugated anti-rat IgG antibody (Thermo Fisher Scientific) were used as secondary antibodies. Cryosections were counterstained with DAPI (4′,6-diamidino-2-phenylindole) (Thermo Fisher Scientific). An LSM 510 Meta or LSM 780 confocal microscope equipped with ZEN2008 software (Carl Zeiss) was used to detect fluorescence signals.
Cell culture and reporter analysis.
Hep3B cells were cultured in Dulbecco's modified Eagle's medium with 10% fetal bovine serum and 1% penicillin-streptomycin (Thermo Fisher Science) under normoxic conditions (95% air and 5% CO2) at 37°C. The mP-Luc and the HE-mP-Luc constructs were as previously described (41). The sF2 fragment was amplified by PCR and ligated into the 5′ flanking region of mP in the mP-Luc construct to construct sF2-mP-Luc. To insert a mutation into sF2-mP-Luc, we performed inverse PCR with a specific primer set (see Table S1 in the supplemental material). Reporter constructs were transfected into Hep3B cells using Lipofectamine (Thermo Fisher Scientific) or FuGene (Promega). For hypoxic-stress induction, 60 to 80% confluent Hep3B cells in culture dishes were incubated under hypoxic conditions (1% O2, 5% CO2 at 37°C) for 24 h.
Statistical analysis.
Average values were calculated, and error bars indicate standard deviations (SD). Differences were analyzed by Student's t test. A P value of <0.05 was considered statistically significant.
Supplementary Material
ACKNOWLEDGMENTS
We thank Naoshi Obara, Masahiro Nezu, Tomokazu Souma, Xiaoqing Pan, and Chisa Sato for help with the transgenic-mouse analyses. We also thank Koichiro Kato, Aya Goto, Hiromi Suda, Eriko Naganuma, Atsuko Konuma, and Yuko Kikuchi for technical help and the Biomedical Research Core of Tohoku University Graduate School of Medicine for technical support. We are grateful to Chugai Pharmaceutical Co. Ltd. for comments and advice.
We declare that we have no conflict of interest. The funders had no role in the study design, data collection and analyses, the decision to publish, or preparation of the manuscript.
This work was supported in part by Grants-in-Aid from MEXT/JSPS KAKENHI (grant no. 26111002 and 24249015 to M.Y., 15H04759 to R.S., 15H04691 to N.S., and 00708117 to I.H.); the Platform for Drug Discovery, Informatics, and Structural Life Science from the Japan Agency for Medical Research and Development (AMED) (M.Y., N.S., and R.S), AMED-Core Research for Evolutional Science and Technology (AMED-CREST) (R.S.), the Suzuken Memorial Foundation (N.S.), and the Senri Life Science Foundation (N.S.).
Footnotes
Supplemental material for this article may be found at https://doi.org/10.1128/MCB.00451-16.
REFERENCES
- 1.Jelkmann W. 2007. Erythropoietin after a century of research: younger than ever. Eur J Haematol 78:183–205. doi: 10.1111/j.1600-0609.2007.00818.x. [DOI] [PubMed] [Google Scholar]
- 2.Suzuki N, Hirano I, Pan X, Minegishi N, Yamamoto M. 2013. Erythropoietin production in neuroepithelial and neural crest cells during primitive erythropoiesis. Nat Commun 4:2902. doi: 10.1038/ncomms3902. [DOI] [PubMed] [Google Scholar]
- 3.Malik J, Kim AR, Tyre KA, Cherukuri AR, Palis J. 2013. Erythropoietin critically regulates the terminal maturation of murine and human primitive erythroblasts. Haematologica 98:1778–1787. doi: 10.3324/haematol.2013.087361. [DOI] [PMC free article] [PubMed] [Google Scholar]
- 4.Wu H, Liu X, Jaenisch R, Lodish HF. 1995. Generation of committed erythroid BFU-E and CFU-E progenitors does not require erythropoietin or the erythropoietin receptor. Cell 83:59–67. doi: 10.1016/0092-8674(95)90234-1. [DOI] [PubMed] [Google Scholar]
- 5.Suzuki N, Ohneda O, Takahashi S, Higuchi M, Mukai HY, Nakahata T, Imagawa S, Yamamoto M. 2002. Erythroid-specific expression of the erythropoietin receptor rescued its null mutant mice from lethality. Blood 100:2279–2288. doi: 10.1182/blood-2002-01-0124. [DOI] [PubMed] [Google Scholar]
- 6.Dame C, Fahnenstich H, Freitag P, Hofmann D, Abdul-Nour T, Bartmann P, Fandrey J. 1998. Erythropoietin mRNA expression in human fetal and neonatal tissue. Blood 92:3218–3225. [PubMed] [Google Scholar]
- 7.Ciau-Uitz A, Monteiro R, Kirmizitas A, Patient R. 2014. Developmental hematopoiesis: ontogeny, genetic programming and conservation. Exp Hematol 42:669–683. doi: 10.1016/j.exphem.2014.06.001. [DOI] [PubMed] [Google Scholar]
- 8.Suzuki N, Obara N, Pan X, Watanabe M, Jishage K, Minegishi N, Yamamoto M. 2011. Specific contribution of the erythropoietin gene 3′ enhancer to hepatic erythropoiesis after late embryonic stages. Mol Cell Biol 31:3896–3905. doi: 10.1128/MCB.05463-11. [DOI] [PMC free article] [PubMed] [Google Scholar]
- 9.Weidemann A, Johnson RS. 2009. Nonrenal regulation of EPO synthesis. Kidney Int 75:682–688. doi: 10.1038/ki.2008.687. [DOI] [PubMed] [Google Scholar]
- 10.Jacobson LO, Goldwasser E, Fried W, Plzak L. 1957. Role of the kidney in erythropoiesis. Nature 179:633–634. doi: 10.1038/179633a0. [DOI] [PubMed] [Google Scholar]
- 11.Obara N, Suzuki N, Kim K, Nagasawa T, Imagawa S, Yamamoto M. 2008. Repression via the GATA box is essential for tissue-specific erythropoietin gene expression. Blood 111:5223–5232. doi: 10.1182/blood-2007-10-115857. [DOI] [PubMed] [Google Scholar]
- 12.Pan X, Suzuki N, Hirano I, Yamazaki S, Minegishi N, Yamamoto M. 2011. Isolation and characterization of renal erythropoietin-producing cells from genetically produced anemia mice. PLoS One 6:e25839. doi: 10.1371/journal.pone.0025839. [DOI] [PMC free article] [PubMed] [Google Scholar]
- 13.Maxwell PH, Osmond MK, Pugh CW, Heryet A, Nicholls LG, Tan CC, Doe BG, Ferguson DJP, Johnson MH, Ratcliffe PJ. 1993. Identification of the renal erythropoietin-producing cells using transgenic mice. Kidney Int 44:1149–1162. doi: 10.1038/ki.1993.362. [DOI] [PubMed] [Google Scholar]
- 14.Yamazaki S, Souma T, Hirano I, Pan X, Minegishi N, Suzuki N, Yamamoto M. 2013. A mouse model of adult-onset anaemia due to erythropoietin deficiency. Nat Commun 4:1950. doi: 10.1038/ncomms2950. [DOI] [PubMed] [Google Scholar]
- 15.Souma T, Yamazaki S, Moriguchi T, Suzuki N, Hirano I, Pan X, Minegishi N, Abe M, Kiyomoto H, Ito S, Yamamoto M. 2013. Plasticity of renal erythropoietin-producing cells governs fibrosis. J Am Soc Nephrol 24:1599–1616. doi: 10.1681/ASN.2013010030. [DOI] [PMC free article] [PubMed] [Google Scholar]
- 16.Nangaku M, Eckardt KU. 2006. Pathogenesis of renal anemia. Semin Nephrol 26:261–268. doi: 10.1016/j.semnephrol.2006.06.001. [DOI] [PubMed] [Google Scholar]
- 17.Miyake T, Kung CK, Goldwasser E. 1977. Purification of human erythropoietin. J Biol Chem 252:5558–5564. [PubMed] [Google Scholar]
- 18.Jacobs K, Shoemaker C, Rudersdorf R, Neill SD, Kaufman RJ, Mufson A, Seehra J, Jones SS, Hewick R, Fritsch EF, Kawakita M, Shimizu T, Miyake T. 1985. Isolation and characterization of genomic and cDNA clones of human erythropoietin. Nature 313:806–810. doi: 10.1038/313806a0. [DOI] [PubMed] [Google Scholar]
- 19.Lin FK, Suggs S, Lin CH, Browne JK, Smalling R, Egrie JC, Chen KK, Fox GM, Martin F, Stabinsky Z. 1985. Cloning and expression of the human erythropoietin gene. Proc Natl Acad Sci U S A 82:7580–7584. doi: 10.1073/pnas.82.22.7580. [DOI] [PMC free article] [PubMed] [Google Scholar]
- 20.McDonald JD, Lin FK, Goldwasser E. 1986. Cloning, sequencing, and evolutionary analysis of the mouse erythropoietin gene. Mol Cell Biol 6:842–848. doi: 10.1128/MCB.6.3.842. [DOI] [PMC free article] [PubMed] [Google Scholar]
- 21.Shoemaker CB, Mitsock LD. 1986. Murine erythropoietin gene: cloning, expression, and human gene homology. Mol Cell Biol 6:849–858. doi: 10.1128/MCB.6.3.849. [DOI] [PMC free article] [PubMed] [Google Scholar]
- 22.Goldberg MA, Glass GA, Cunningham JM, Bunn HF. 1987. The regulated expression of erythropoietin by two human hepatoma cell lines. Proc Natl Acad Sci U S A 84:7972–7976. doi: 10.1073/pnas.84.22.7972. [DOI] [PMC free article] [PubMed] [Google Scholar]
- 23.Beck I, Ramirez S, Weinmann R, Caro J. 1991. Enhancer element at the 3′-flanking region controls transcriptional response to hypoxia in the human erythropoietin gene. J Biol Chem 266:15563–15566. [PubMed] [Google Scholar]
- 24.Pugh CW, Tan CC, Jones RW, Ratcliffe PJ. 1991. Functional analysis of an oxygen-regulated transcriptional enhancer lying 3′ to the mouse erythropoietin gene. Proc Natl Acad Sci U S A 88:10553–10557. doi: 10.1073/pnas.88.23.10553. [DOI] [PMC free article] [PubMed] [Google Scholar]
- 25.Semenza GL, Nejfelt MK, Chi SM, Antonarakis SE. 1991. Hypoxia-inducible nuclear factors bind to an enhancer element located 3′ to the human erythropoietin gene. Proc Natl Acad Sci U S A 88:5680–5684. doi: 10.1073/pnas.88.13.5680. [DOI] [PMC free article] [PubMed] [Google Scholar]
- 26.Semenza GL, Wang GL. 1992. A nuclear factor induced by hypoxia via de novo protein synthesis binds to the human erythropoietin gene enhancer at a site required for transcriptional activation. Mol Cell Biol 12:5447–5454. doi: 10.1128/MCB.12.12.5447. [DOI] [PMC free article] [PubMed] [Google Scholar]
- 27.Wu D, Potluri N, Lu J, Kim Y, Rastinejad F. 2015. Structural integration in hypoxia-inducible factors. Nature 524:303–308. doi: 10.1038/nature14883. [DOI] [PubMed] [Google Scholar]
- 28.Semenza GL, Koury ST, Nejfelt MK, Gearhart JD, Antonarakis SE. 1991. Cell-type-specific and hypoxia-inducible expression of the human erythropoietin. Proc Natl Acad Sci U S A 88:8725–8729. doi: 10.1073/pnas.88.19.8725. [DOI] [PMC free article] [PubMed] [Google Scholar]
- 29.Madan A, Lin C, Hatch SL II, Curtin PT. 1995. Regulated basal, inducible, and tissue-specific human erythropoietin gene expression in transgenic mice requires multiple cis DNA sequences. Blood 85:2735–2741. [PubMed] [Google Scholar]
- 30.Köchling J, Curtin PT, Madan A. 1998. Regulation of human erythropoietin gene induction by upstream flanking sequences in transgenic mice. Br J Haematol 103:960–968. doi: 10.1046/j.1365-2141.1998.01081.x. [DOI] [PubMed] [Google Scholar]
- 31.Storti F, Santambrogio S, Crowther LM, Otto T, Abreu-Rodriguez I, Kaufmann M, Hu CJ, Dame C, Fandrey J, Wenger RH, Hoogewijs D. 2014. A novel distal upstream hypoxia response element regulating oxygen-dependent erythropoietin gene expression. Haematologica 99:e45–e48. doi: 10.3324/haematol.2013.102707. [DOI] [PMC free article] [PubMed] [Google Scholar]
- 32.Suzuki N, Obara N, Yamamoto M. 2007. Use of gene-manipulated mice in the study of erythropoietin gene expression. Methods Enzymol 435:157–177. doi: 10.1016/S0076-6879(07)35009-X. [DOI] [PubMed] [Google Scholar]
- 33.Fandrey J. 2004. Oxygen-dependent and tissue-specific regulation of erythropoietin gene expression. Am J Physiol Regul Integr Comp Physiol 286:R977–R988. doi: 10.1152/ajpregu.00577.2003. [DOI] [PubMed] [Google Scholar]
- 34.Ou LC, Salceda S, Schuster SJ, Dunnack LM, Brink-Johnsen T, Chen J, Leiter JC. 1998. Polycythemic responses to hypoxia: molecular and genetic mechanisms of chronic mountain sickness. J Appl Physiol 84:1242–1251. [DOI] [PubMed] [Google Scholar]
- 35.Holmquist-Mengelbier L, Fredlund E, Löfstedt T, Noguera R, Navarro S, Nilsson H, Pietras A, Vallon-Christersson J, Borg A, Gradin K, Poellinger L, Påhlman S. 2006. Recruitment of HIF-1alpha and HIF-2alpha to common target genes is differentially regulated in neuroblastoma: HIF-2alpha promotes an aggressive phenotype. Cancer Cell 10:413–423. doi: 10.1016/j.ccr.2006.08.026. [DOI] [PubMed] [Google Scholar]
- 36.Ginouvès A, Ilc K, Macías N, Pouysségur J, Berra E. 2008. PHDs overactivation during chronic hypoxia “desensitizes” HIFalpha and protects cells from necrosis. Proc Natl Acad Sci U S A 105:4745–4750. doi: 10.1073/pnas.0705680105. [DOI] [PMC free article] [PubMed] [Google Scholar]
- 37.Moritz KM, Lim GB, Wintour EM. 1997. Developmental regulation of erythropoietin and erythropoiesis. Am J Physiol 273:R1829–R1844. [DOI] [PubMed] [Google Scholar]
- 38.Galson DL, Tan CC, Ratcliffe PJ, Bunn HF. 1993. Comparison of the human and mouse erythropoietin genes shows extensive homology in the flanking regions. Blood 82:3321–3326. [PubMed] [Google Scholar]
- 39.David RB, Blom AK, Sjaastad OV, Harbitz I. 2001. The porcine erythropoietin gene: cDNA sequence, genomic sequence and expression analyses in piglets. Domest Anim Endocrinol 20:137–147. doi: 10.1016/S0739-7240(01)00089-3. [DOI] [PubMed] [Google Scholar]
- 40.Wen D, Boissel JP, Tracy TE, Gruninger RH, Mulcahy LS, Czelusniak J, Goodman M, Bunn HF. 1993. Erythropoietin structure-function relationships: high degree of sequence homology among mammals. Blood 82:1507–1516. [PubMed] [Google Scholar]
- 41.Imagawa S, Suzuki N, Ohmine K, Obara N, Mukai HY, Ozawa K, Yamamoto M, Nagasawa T. 2002. GATA suppresses erythropoietin gene expression through GATA site in mouse erythropoietin gene promoter. Int J Hematol 75:376–381. doi: 10.1007/BF02982127. [DOI] [PubMed] [Google Scholar]
- 42.Steinmann K, Richter AM, Dammann RH. 2011. Epigenetic silencing of erythropoietin in human cancers. Genes Cancer 2:65–73. doi: 10.1177/1947601911405043. [DOI] [PMC free article] [PubMed] [Google Scholar]
- 43.Chang YT, Yang CC, Pan SY, Chou YH, Chang FC, Lai CF, Tsai MH, Hsu HL, Lin CH, Chiang WC, Wu MS, Chu TS, Chen YM, Lin SL. 2016. DNA methyltransferase inhibition restores erythropoietin production in fibrotic murine kidneys. J Clin Invest 126:721–731. doi: 10.1172/JCI82819. [DOI] [PMC free article] [PubMed] [Google Scholar]
- 44.Kobayashi H, Liu Q, Binns TC, Urrutia AA, Davidoff O, Kapitsinou PP, Pfaff AS, Olauson H, Wernerson A, Fogo AB, Fong GH, Gross KW, Haase VH. 2016. Distinct subpopulations of FOXD1 stroma-derived cells regulate renal erythropoietin. J Clin Invest 126:1926–1938. doi: 10.1172/JCI83551. [DOI] [PMC free article] [PubMed] [Google Scholar]
Associated Data
This section collects any data citations, data availability statements, or supplementary materials included in this article.