

ABSTRACT
Stress granules (SGs) are large macromolecular aggregates that contain translation initiation complexes and mRNAs. Stress granule formation coincides with translational repression, and stress granules actively signal to mediate cell fate decisions by signaling to the translation apparatus to (i) maintain translational repression, (ii) mount various transcriptional responses, including innate immunity, and (iii) repress apoptosis. Previous work showed that G3BP1 is phosphorylated at serine 149, which regulates G3BP1 oligomerization, stress granule assembly, and RNase activity intrinsic to G3BP1. However, the kinase that phosphorylates G3BP1 was not identified, leaving a key step in stress granule regulation uncharacterized. Here, using chemical inhibition, genetic depletion, and overexpression experiments, we show that casein kinase 2 (CK2) promotes stress granule dynamics. These results link CK2 activity with SG disassembly. We also show that casein kinase 2 phosphorylates G3BP1 at serine 149 in vitro and in cells. These data support a role for casein kinase 2 in regulation of protein synthesis by downregulating stress granule formation through G3BP1.
KEYWORDS: casein kinase 2, G3BP1, stress granule
INTRODUCTION
Stress granules (SGs) are macromolecular aggregates that assemble in response to stressors that impair translation (1). In most cases, stress granules assemble in response to translational repression mediated by eukaryotic initiation factor 2α (eIF2α) phosphorylation at serine 51 (2–4). However, eIF2α-independent stresses that inhibit the activity of other translation initiation factors also induce SG assembly. These stresses include eIF4A inhibition by either pateamine A or hippuristanol, eIF4G depletion or cleavage during viral infection, and inhibition of eIF4E-eIF4G interactions during hydrogen peroxide stress (5–8). Many components of the translational machinery, poly(A)-containing mRNAs, and RNA-binding proteins concentrate in stress granules (9, 10). Some proteins, such as Ras-GAP SH3-binding protein (G3BP1), T-cell intracellular antigen 1 (TIA1), and fused in sarcoma (FUS), are considered to be nucleating RNA-binding proteins that can induce stress granule formation when overexpressed, independent of exogenous stressors. These proteins are proposed to mediate stress granule assembly dependent on transient oligomerization (11–13), and posttranslational modifications are likely to regulate changes in protein phases underlying the process (9, 14–16).
Much work on stress granules has focused on proteins that may promote assembly of SGs. With the exception of one or two studies that describe how posttranslational modifications might affect SG assembly, relatively few studies have investigated effector proteins that regulate SG assembly and disassembly. Casein kinase 2 (CK2) has been described as a stress-activated protein kinase initially identified based on its activity on the milk protein casein (17). Casein kinase 2 is a heterotetramer composed of 2 catalytic (α and/or α′) subunits and 2 regulatory (β) subunits. The substrate specificity of CK2 is complicated because of differential expression of its subunits among tissues and the constitutively active nature of the kinase. CK2 catalytic subunits are active in cells without the regulatory β subunits, but substrate specificity changes when the regulatory subunits associate. Much work has focused on the CK2 heterotetramer, but activity of catalytic dimers and a noncatalytic role for the β subunit have been previously described (18–20). Several translation factors are phosphorylated by CK2, including subunits of eukaryotic initiation factors eIF3 and eIF5 (21, 22). While it is not clear how CK2-mediated phosphorylation of eIF3 regulates protein synthesis, phosphorylation of eIF5 has been associated with increased initiation of protein synthesis (23). CK2-mediated phosphorylation of eIF5 promotes cell cycle transition at the G2/M boundary. These pathways for regulating protein synthesis help explain the correlation between CK2 activity and elevated rates of cell proliferation.
Stress granule assembly is driven by complex interactions between many RNA-binding proteins containing islands of low amino acid complexity (9, 11, 16, 24). Since they are very dynamic structures where many incorporated proteins quickly exchange with cytoplasmic pools of those proteins (25–27), posttranslational modifications are implicit in regulating these protein-protein associations. A recent report indicated that the SG nucleating proteins are exchanged more rapidly than those that are incapable of inducing SG aggregation (i.e., ZBP1 and YB1) (25). What regulatory mechanisms promote stress granule disassembly and resumed protein synthesis during the poststress recovery phase is not well understood. However, the difference in dynamics between nucleating proteins and other SG-resident proteins highlights the principle that understanding posttranslational and epigenetic modification of SG nucleating proteins is critical to understanding SG dynamics.
G3BP1 is a well-studied SG nucleating protein. Several posttranslational modifications of G3BP1 are known, but their consequences for SG dynamics are mostly uncharacterized. For example, G3BP1 has been shown to be phosphorylated, ubiquitinated, methylated, acetylated, and poly(ADP) ribosylated (28–33). G3BP1 phosphorylation is the best-characterized posttranslational modification of G3BP1. Originally, G3BP1 was identified as a phosphorylation-dependent regulator of Ras signaling (33), although recent work has called regulation of Ras signaling by G3BP1 into question and has shown that RasGAP does not affect stress granule assembly (34). Three G3BP1 phosphorylation sites were identified in the original study that were hyperphosphorylated in quiescent cells in comparison to dividing cells (33). The same group later showed that the three sites correspond to serines 149 and 232, with an additional site as yet unidentified (12). They also linked S149 phosphorylation of G3BP1 with reduced ability to dimerize and concentrate in SGs; however, these conclusions were based on an apparent 50% change in S149 phosphorylation during arsenite stress (12). No change was observed at either S232 or the third, unidentified phosphorylation site. These observations suggest that another posttranslational modification(s) works in concert with S149 to affect G3BP1 function in stress granules. Indeed, we have recently shown that rapid demethylation of G3BP1 promotes SG assembly (35). Phosphorylation at S149 was also shown to regulate G3BP1 endoribonuclease (RNase) activity (36), which illustrates the importance of S149 phosphorylation in a range of G3BP1 activities (37–40). However, G3BP1 endoribonuclease activity was later unlinked from RasGAP (34). Thus, some confusion exists regarding the role of phosphorylation events in SG formation and other RNA-regulatory activities of G3BP1, and no group has identified the kinases responsible for modifying S149 or S232 of G3BP1.
Here, we show that inhibition of CK2 chemically or with small interfering RNAs (siRNAs) impairs recovery from arsenite stress. We show that the catalytic subunits associate with stress granules while the regulatory β subunit does not. These findings led us to identify G3BP1 as a target of CK2 both in vitro and in cells. We found that CK2 modifies S149 of G3BP1, which is a well-characterized signal to disassemble stress granules. Although phosphorylation of S149 was shown to antagonize stress granules, the kinase responsible remained unidentified until now. Superresolution microscopy revealed that CK2α is buried deep within a stress granule, in contrast to protein kinase R (PKR), which is generally located at the surface of the stress granule, consistent with CK2 activity on key SG components buried deep within a stress granule. We utilized proximity ligation assays to demonstrate that CK2-G3BP1 foci increase during arsenite stress and through an hour of recovery from arsenite stress. Considering the important role of SGs in regulating protein synthesis and cell growth, these findings support a new mechanistic role for CK2 as a regulator of cellular stress and proliferation by promoting SG disassembly and, thus, continued protein synthesis.
RESULTS
CK2 regulates SG disassembly during stress recovery.
Since stress granules are tightly linked to translational control, we are interested in delineating pathways that converge on stress granules and regulate their assembly. Therefore, we pretreated cells with the specific CK2 inhibitor tetrabromocinnamic acid (TBCA) prior to arsenite stress and investigated the proportion of cells with SGs during arsenite stress and recovery. We found that TBCA did not alter SG formation but that continuous treatment with TBCA during recovery from arsenite stress caused an increase in the number of cells with residual stress granules relative to the vehicle control (Fig. 1A and B). At 2 h of recovery, cultures treated with TBCA had twice as many cells retaining stress granules as the controls. TBCA treatment alone did not induce stress granules under the conditions of our experiments (Fig. 1C). Although these results were not statistically significant, they were reproducible in HeLa cells and suggested CK2 may play a role in SG disassembly (data not shown). Since chemical kinase inhibitors nonspecifically inhibit other kinases, we tested 5-oxo-5,6-dihydroindolo-(1,2-a)quinazolin-7-yl acetic acid (IQA) (41), another CK2 inhibitor, for its ability to repress stress granule disassembly. After 2 h of recovery from arsenite stress in both HeLa and U2OS cells treated with IQA, there was a 2-fold increase in cells with SGs (Fig. 1D). This is similar to what we observed with TBCA, except that there seemed to be a biphasic response not observed with TBCA, where early time points of recovery (1 h) showed no difference but later time points (2 h) had more cells with stress granules when treated with IQA. This indicates that off-target effects of the chemical inhibitors and/or the function of CK2 in regulation of SGs is complicated. To evaluate whether CK2 is important in resolving SGs formed in response to other stressors, we examined SGs that form in response to PKR activation. To activate PKR, we used Mengo virus with mutated L protein (Mengo-Zn), rendering the virus ineffective in antagonizing SGs, as previously reported (42). Mengo-Zn infection has been shown to induce SGs by activating PKR due to accumulation of double-stranded RNA (dsRNA) (43). Pretreatment of cells with IQA caused a 2.5-fold increase in the percentage of cells with SGs 10 h postinfection, further supporting a role for CK2 as a regulator of SG dynamics (Fig. 1E).
FIG 1.

Chemical inhibition of CK2 slows recovery from arsenite stress. (A) U2OS cells were pretreated with vehicle alone (Veh) or the CK2 inhibitor TBCA, followed by arsenite stress (Ars) or arsenite stress and recovery for either 1 h (1 h rec) or 2 h (2 h rec). The cells were fixed and stained for TIA1 (green) and G3BP1 (red). (B) Cells with stress granules were quantified and are presented as percentages. Over 150 cells were counted. (C) U2OS cells were treated with TBCA for 2 h without arsenite stress and stained for TIA1 (green) and G3BP1 (red). (D) HeLa or U2OS cells were treated with IQA for 2 h and then either treated with arsenite or treated with arsenite and allowed to recover for the indicated times. Cells with stress granules were quantified as for panel B. (E) HeLa cells were treated with IQA for 2 h and infected with Mengo-Zn, a picornavirus containing two point mutations in the L protein previously shown to induce SGs through PKR activation (42, 43), at an MOI of 10. Ten hours postinfection, the cells were fixed and stained for stress granule assembly. Percentages of cells with stress granules were quantified as for panel B. A chi-square test was performed on the data in panels B and E, and the results are indicated; ns, not significant; ***, P ≤ 0.001. The error bars represent standard errors between fields of cells.
To further explore if CK2 activity promotes SG disassembly and recovery, we genetically depleted CK2 and then examined SGs during arsenite treatment and the recovery period. We used this approach in case the effects observed with TBCA treatment were due to off-target effects often observed with chemical inhibitors of kinases. SGs were monitored by immunofluorescence microscopy (IF) after depletion of all three CK2 subunits. We found that U2OS cells treated with control siRNAs (siControl) displayed normal stress and recovery kinetics, while 50% more cells treated with siRNA to deplete CK2 (siCK2) still contained SGs after 1 h of recovery (Fig. 2A and B). Since G3BP1 and its homolog G3BP2 are considered key SG components and are known to be critical for SG assembly (44), we also depleted G3BP1 and G3BP2 individually. Depletion of either G3BP1 or G3BP2 resulted in 50% fewer cells containing SGs after 1 h of recovery than in the control siRNA-treated group (Fig. 2B). CK2 depletion also increased the number of SGs per cell, similar to the results obtained for the percentage of cells with SGs (Fig. 2B). Western blot analysis of cells depleted of CK2α, G3BP1, or G3BP2 confirmed efficient reduction in protein levels (Fig. 2C). Taken together, these results demonstrate that depletion of stress granule nucleating proteins themselves is not sufficient to completely impair SG formation in our system and help to put the effects of CK2 inhibition in perspective.
FIG 2.

Genetic depletion of CK2 delays SG recovery. (A) U2OS cells were treated with either nontargeting (siControl), CK2 (siCK2), G3BP1 (siG3BP1), or G3BP2 (siG3BP2) siRNA, followed by arsenite treatment (Ars) or recovery from arsenite stress for 1 h (1 h Rec) or 2 h (2 h Rec). The cells were then fixed and stained for G3BP1 (green) and TIA1 (red). (B) Each condition was quantified by counting over 150 cells. The percentages of cells with SGs (top) and average SGs per cell (bottom) are shown, with error bars denoting standard errors. A chi-square test was performed on the data, and the results are indicated; *, P ≤ 0.01; **, P ≤ 0.05; ***, P ≤ 0.001. (C) Depletion of G3BP1, G3BP2, and CK2α was confirmed by Western blotting. Knockdown efficiency was evaluated using ImageJ. Normalized band intensities are shown under each Western blot. IB, immunoblot. (D) U2OS cells were depleted of CK2α, CK2α′, both CK2α and CK2α′, or two independent groups of siRNAs targeting the whole CK2 complex (α, α′, and β; siCK2-1 and siCK2-2), as indicated. The cells were stained as for panel A and quantified as for panel B for both percentages of cells with stress granules (left) and numbers of stress granules per cell (right). (E) Western blot analysis of the conditions in panel D showing efficient depletion of the catalytic CK2α and CK2α′ subunits.
Although we showed the same results with chemical inhibition and siRNA-mediated depletion of CK2, many siRNAs have nonspecific targets, and it is possible that one or multiple subunits of CK2 influence the observations we report here. Therefore, we used siRNAs against either the catalytic α or α′ subunit and two totally independent groups of siRNAs targeting the three CK2 subunits together (siCK2-1 and siCK2-2) to address this possibility (Fig. 2D). We found that CK2α is important for the dissolution of stress granules, while depletion of CK2α′ had a weaker effect on SGs when the percentage of cells with stress granules was examined. However, depletion of both catalytic subunits, CK2α and CK2α′, more potently impaired stress granule disassembly during recovery from arsenite stress than siCK2α alone (Fig. 2D). When we counted stress granules per cell to measure recovery, it was clear that both CK2α and CK2α′ are involved in recovery, as we observed more SGs per cell with both siRNA treatments than under the siControl condition (Fig. 2E). Most importantly, when two independent siRNA groups were used to deplete the entire CK2 complex (including CK2β), stress granule dissolution was impaired, indicating that off-target effects of our siRNAs were not responsible for the effects we observed, consistent with the chemical inhibition experiments described above (Fig. 2D). These results were statistically significant. In separate experiments where individual CK2 subunits were depleted, we also saw reduced recovery from arsenite stress when only the regulatory CK2β subunit was depleted (data not shown). Western blot analysis showed efficient depletion of the catalytic subunits in these experiments (Fig. 2F).
To probe the roles of individual CK2 subunits and the effects of elevated CK2 activity on SGs, we expressed individual CK2 subunits or the three subunits together. When overexpressed, the α and α′ subunits of CK2 colocalized with stress granules during arsenite stress and during recovery (Fig. 3A and C). The overexpressed regulatory β subunit of CK2 did not colocalize with stress granules during stress or recovery (Fig. 3A). To determine whether overexpression of CK2 subunits alters SG dynamics, we quantified SGs in IF and compared cells expressing CK2 subunits with adjacent, untransfected cells that were not expressing the CK2 transgenes during arsenite stress and recovery. Strikingly, the α and β subunits of CK2 repressed SG formation under arsenite stress conditions at statistically significant levels compared with untransfected adjacent cells (Fig. 3B). The trend was similar during expression of the α′ subunit, but it was not statistically significant. Expression of all 3 subunits of CK2 was equally effective in comparison to the individual α and β subunits in reducing SG abundance during arsenite treatment (Fig. 3B). We also analyzed stress granule formation in cells transfected with green fluorescent protein (GFP). In untreated cells, GFP transfection induced stress granule formation in a small percentage of cells, while stress granules were rarely observed in untransfected cells (Fig. 3D). These results are consistent with previous findings from our laboratory (45). When GFP-transfected samples were treated with arsenite, nearly 100% of the cells contained stress granules regardless of whether they expressed GFP (Fig. 3D). This observation was opposite to what we observed when CK2 subunits were expressed, indicating the specificity of regulation of stress granules by CK2. We confirmed expression of the subunits by Western blotting with eIF3C as a loading control (Fig. 3C). The α and α′ subunits were expressed at levels similar to each other, but it was not possible to compare the levels of these subunits with those of the β subunit because they were expressed with different tags in the experiments.
FIG 3.

Overexpression of CK2 subunits impairs stress granule formation. (A) U2OS cells were transfected with constructs expressing HA-tagged CK2α or CK2α′ or myc-tagged CK2β, as indicated (green). The cells were allowed to express the transgene for approximately 16 h prior to stress treatment. The cells were subsequently stressed with 500 μM arsenite or stressed and allowed to recover for 90 min, followed by processing for immunofluorescence assay (IFA). The cells were counterstained for G3BP1 or TIA1 (red) to stain stress granules and with DAPI (4′,6-diamidino-2-phenylindole) (blue) to stain DNA. The boxed areas are enlarged on the right. (B) U2OS cells treated as for panel A with the addition of a group containing overexpression of all three (α, α′, and β) CK2 subunits. The cells were imaged, and SGs were quantified in over 50 cells per condition. A chi-square test was performed on the data, and the results are indicated; ns, not significant; **, P ≤ 0.05; ***, P ≤ 0.001. The error bars represent standard errors between fields of cells. Both 500 μM arsenite-stressed (Ars) and 90-min recovery (Rec) conditions are shown. (C) Cells transfected as for panels A and B were Western blotted for HA-tagged CK2α or CK2α′ or myc-tagged CK2β (α-HA and α-myc, respectively), CK2α′, and eIF3C as a loading control to confirm similar levels of overexpression in the experiments. (D) Cells expressing GFP alone were either left untreated (Untreated) or stressed with 500 μM arsenite (Ars). The cells were quantified as for panel B.
To confirm that CK2 catalytic activity is required for stress granule disassembly, we performed stress recovery experiments with wild-type and dominant-negative catalytic subunits (CK2α or CK2α′) (46). In these experiments, stress granule disassembly was similar in transfected and adjacent untransfected cells when wild-type CK2α or CK2α′ was expressed (Fig. 4). There was a slight yet not statistically significant decrease in cells with SGs when wild-type CK2α was expressed, and often the cells had smaller stress granules (Fig. 4A and C). However, there were roughly 10-fold more cells with stress granules during the recovery period when the dominant-negative mutant CK2α K68M was expressed compared to adjacent untransfected cells (Fig. 4). We did not see a difference in the percentage of cells with stress granules when looking at dominant-negative CK2α′ K69M, consistent with our results shown in Fig. 3, suggesting that CK2α activity is more important in SG dissolution (Fig. 4). However, it is worth noting that expression of either wild-type or dominant-negative CK2α′ in these experiments reproducibly elevated levels of endogenous CK2α, making the effects of the CK2α′ transgene difficult to interpret (Fig. 4D).
FIG 4.

Overexpression of a CK2α dominant-negative subunit delays stress granule recovery. (A) U2OS cells were transfected with constructs expressing Flag-tagged wild-type CK2α or dominant-negative CK2α [DN(K68M)], Flag-CK2α′ or dominant-negative CK2α′ [DN(K69M)], or GFP. The cells were allowed to express the transgene for approximately 16 h prior to stress treatment. The cells were subsequently stressed with 500 μM arsenite or stressed and allowed to recover for 90 min, followed by processing for IFA. The cells were stained for Flag (green) to stain overexpressing cells, G3BP1 (red in the merged column and gray in the extracted column) to stain stress granules, and DAPI (blue). (B) Both transfected cells (black bars) and adjacent untransfected cells (gray bars) were imaged, and SGs were quantified in over 50 cells per condition. A chi-square test was performed on the data, and the results are indicated; ***, P ≤ 0.001. The error bars represent standard errors between fields of cells. Both 500 μM arsenite stressed (Ars) and 90-min recovery (Rec) conditions are shown. (C) Western blotting of Flag-tagged CK2 transgenes, total CK2α, total CK2α′, G3BP1, and GAPDH, as indicated, from the conditions shown in panel A. Endogenous and transgenic CK2 subunits are indicated.
CK2 subunits colocalize with stress granules and can be found buried deep in stress granules.
To investigate the subcellular localization of the three CK2 subunits during stress, we performed IF on U2OS cells treated with arsenite. We observed that endogenous CK2α concentrated in SGs together with G3BP1 (Fig. 5A). CK2α′ was also present in stress granules marked by TIA1, but CK2β was not observed within stress granules under the conditions of our experiments (Fig. 5A). These results further support a role for CK2 in regulation of SG dynamics and are consistent with colocalization of overexpressed CK2 subunits in these cells (Fig. 3A).
FIG 5.

Subunits of CK2 differentially colocalize with arsenite-induced stress granules. (A) U2OS cells were stressed with 500 μM arsenite for 45 min, fixed, and stained for the indicated CK2 subunits (red). The cells were counterstained for stress granules with either G3BP1 or TIA1, as indicated (green), and nuclei (DAPI) (blue). (B) U2OS cells were stressed, fixed, and stained for CK2α or PKR (red) as for panel A. CK2α was counterstained for G3BP1 (green), while PKR was counterstained for TIA1 (green) to mark stress granules. The cells were examined using superresolution microscopy, and 3D reconstructions were performed with SR GSD 3D (Leica Microsystems) algorithms. Two stress granules are shown with CK2α and G3BP1 staining, with slices taken along the z axis of the 3D reconstruction. The slice progression for each SG is shown in a row from left to right. One stress granule is shown for the PKR control. The arrows show CK2α or PKR foci that are buried within or adjacent to the green stress granules.
To gain further insight into finer localization of CK2α in SGs during arsenite stress, we used superresolution microscopy to measure colocalization of CK2α with G3BP1. As a control, we also imaged dsRNA-dependent protein kinase (PKR) because it was previously shown to colocalize with arsenite-induced SGs and we recently reported a mechanism for SG-dependent activation (42). Images were captured, and three-dimensional (3D) reconstruction was performed with an x/y resolution of 20 nm and approximately 50-nm resolution in the z direction, which is the limit of the instrument. Strikingly, CK2α fluorescence was buried within SGs. In contrast, the PKR control was found mostly closely adjacent to arsenite-induced SGs (Fig. 5B). However, enrichment of CK2α in the SG was only partial, which is consistent with our other experiments (Fig. 3A).
CK2 recognizes S149 of G3BP1.
Because S149 phosphorylation of G3BP1 appears to play a role in SG dynamics in our system and others (12), we considered whether CK2 exerts its effects on stress granules by modification of S149 on G3BP1. The CK2 consensus site contains many acidic residues, consistent with the presence of the known S149 phosphorylation site in a heavily acidic stretch of amino acids within G3BP1 (Fig. 6A). We performed an in silico search using MIT's Scansite to identify potential kinases that have consensus sites matching the S149 phosphorylation site. CK2 was the only kinase out of 70 kinases examined predicted to target S149 of G3BP1 (47). To confirm whether CK2 can phosphorylate G3BP1, we used purified G3BP1 and a CK2 tetramer in in vitro kinase assays with [γ-32P]ATP. Our G3BP1 protein is over 90% pure as measured by Coomassie staining of acrylamide gels but migrates as three bands because it is C-terminally processed in bacteria (Fig. 6B, asterisks). The highest-molecular-mass band is full-length G3BP1 protein. Indeed, we saw three bands marked with 32P in autoradiography from in vitro kinase assays using purified G3BP1 (Fig. 6B). Since CK2 was originally identified based on its activity on the protein casein in rat liver (48), we used dry milk as a control and, as expected, observed modification of both caseins α and β. Strong modification of caseins α and β was not observed in dry milk because over 70% of casein is already phosphorylated, leaving relatively few sites available for modification with 32P. In contrast to G3BP1 and caseins α and β, the RNA-binding proteins PTB and PABP were not modified by CK2 under the conditions we employed, even after long incubations where G3BP1 phosphorylation had peaked (Fig. 6B).
FIG 6.
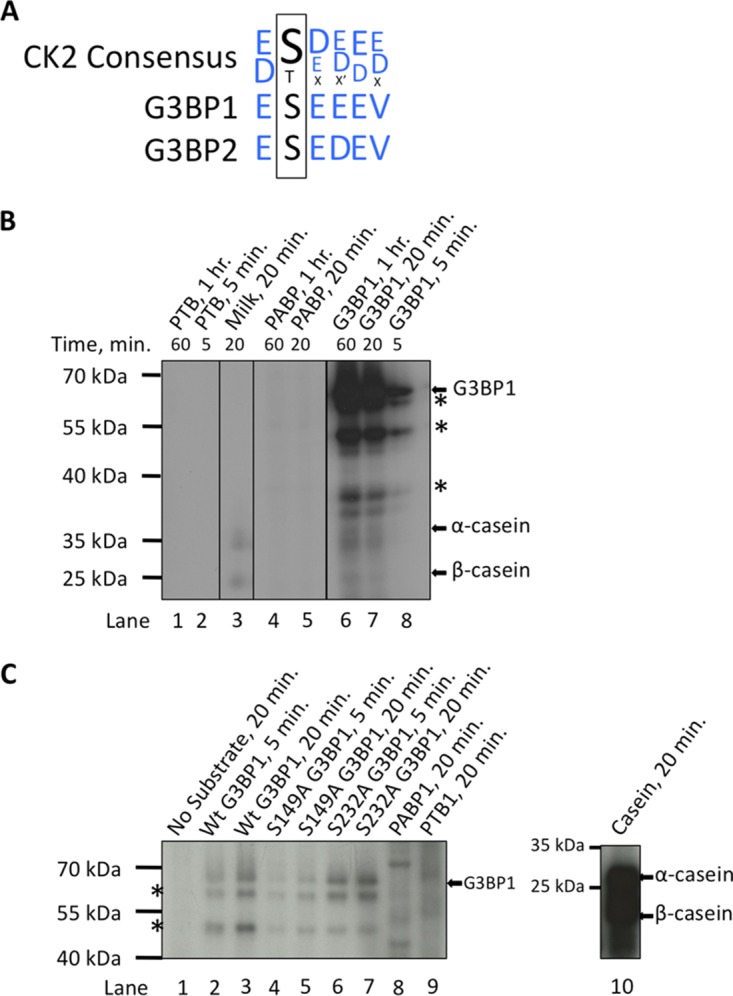
Casein kinase 2 phosphorylates G3BP1 on serine 149. (A) The casein kinase 2 consensus recognition sequence was aligned with the amino acid sequence surrounding serine 149. The amino acid composition surrounding S149 fits the acidophilic preference of CK2. (B) In vitro kinase assays using purified G3BP1 (full length) (arrows) and CK2 with [γ-32P]ATP. The asterisks indicate truncated forms of G3BP1 produced in Escherichia coli. In this experiment, dry milk was used as a positive control for CK2 activity, but ∼70% of milk casein is already phosphorylated. As such, the positive control was weaker than expected. (C) In vitro kinase assays as for panel B, but phospho-null mutants (S149A and S232A) were included for the indicated times. Previous reports indicated that both S149 and S232 are phosphorylated in cells (36), so mutants of those sites were investigated. Dephosphorylated casein was used as a positive control in this experiment in contrast to panel B, resulting in more robust labeling of casein α and β (arrows). (B and C) The negative controls were PTB1 and PABP1 (expected molecular masses, 57 and 70 kDa, respectively).
The role of S232 phosphorylation in regulating G3BP1 function is not known (36). Our in silico analysis did not predict that S232 is modified by CK2. However, we sought to confirm that CK2 modifies S149 and not another site (i.e., S232) within G3BP1. We purified mutants of G3BP1 containing serine-to-alanine substitutions at S149 and S232 (S149A and S232A, respectively) and performed in vitro kinase assays on the purified proteins. The G3BP1 mutants migrated as three bands, similar to wild-type G3BP1. In our experiments, the S149A mutant was not labeled as efficiently as wild-type or S232A protein (Fig. 6C). In fact, mutation of S232 resulted in somewhat stronger 32P modification, raising the possibility of coordinate phosphorylation of S232 and S149. In contrast, PTB and PABP were not labeled by CK2, and dephosphorylated casein was strongly modified (Fig. 6C). The fact that residual labeling of S149A G3BP1 by CK2 occurred indicates that an additional CK2 phosphorylation site may exist, or it could result from promiscuous labeling in vitro. These results indicate that CK2 can phosphorylate purified G3BP1 in solution and support other data (Fig. 1 to 4) that suggest CK2 may help regulate SG formation.
To investigate whether CK2 can phosphorylate G3BP1 in cells, U2OS cells stably expressing GFP-G3BP1 were treated with siRNAs to deplete the CK2 α, α′, and β subunits together (siCK2). All three subunits were codepleted because our previous results were more consistent with a role for the heterotetramer than with individual subunits regulating stress granules. The cells were then either left untreated, stressed with arsenite, or stressed and then allowed to recover in the presence of [32P]orthophosphoric acid. The cells were lysed, and G3BP1 was immunoprecipitated under stringent conditions prior to SDS-PAGE and autoradiography or Western blotting. This procedure yielded two bands, representing phosphorylation levels of endogenous G3BP1 and expressed GFP-G3BP1. The bands from autoradiography were normalized to the equivalent bands from Western blots to account for slight differences in immunoprecipitated material during the procedure. Using this approach, we found that wild-type GFP-G3BP1 was phosphorylated most strongly under normal growth conditions and that phosphorylation decreased by approximately 30% with the addition of arsenite and continued to decrease through the 90-min recovery phase. The 30 to 50% decrease in phosphorylation is similar to that in previous work (12) (Fig. 7A, compare lane 1 with lanes 2 and 3). Phosphorylation of endogenous G3BP1 followed the same trend, decreasing during arsenite stress and further during recovery (Fig. 7A, graph of densitometry). Depletion of CK2 resulted in less G3BP1 phosphorylation in control cells and under all conditions of arsenite treatment (Fig. 7A, compare lanes 1 and 4, 2 and 5, 3 and 6), consistent with CK2 phosphorylation of G3BP1 at only one site. However, G3BP1 was still partly radiolabeled, indicating that other kinases likely phosphorylate G3BP1.
FIG 7.

CK2 phosphorylates G3BP1 in U2OS cells. (A) (Top) U2OS cells stably expressing wild-type GFP-G3BP1 were treated with control (siCon) or CK2 (siCK2) siRNA. Subsequently, the cells were either left untreated (U), stressed with 500 μM arsenite (A), or stressed and allowed to recover for 90 min (R) in the presence of [32P]orthophosphate. Lysates were prepared and Western blotted (WB) for CK2α′, G3BP1 (to detect both GFP-G3BP1 transgene and endogenous G3BP1, as labeled), GAPDH, and GFP (to detect the GFP-G3BP1 transgene), as indicated. Furthermore, the lysates were used in autoradiography to detect phospho-labeled proteins. The lysates were also subjected to immunoprecipitation to capture G3BP1 under stringent conditions. The immunoprecipitated material was subjected to autoradiography. (Bottom) Bands representing immunoprecipitated 32P-labeled GFP-G3BP1 and endogenous (endo) G3BP1 were quantified and normalized to the respective bands in the G3BP1 Western blot. (B) The experiment shown in panel A was performed on U2OS cells stably expressing S149A GFP-G3BP1. (C) G3BP1 was pulled down from U2OS cells treated as for panel A and subjected to LC-MS analysis. Levels of S149 and S232 phosphopeptides are shown in graphical form. The phosphopeptide levels were normalized to total G3BP1 peptides to account for variations in G3BP1 entering the machine. The error bars indicate standard errors of the mean from the results of 3 independent experiments with two technical replicates. Student's t test was performed to score significance; NS, not significant; *, P ≤ 0.05; ***, P ≤ 0.001. (D and E) Fragment ion (tandem mass spectrometry [MS-MS]) spectra isolated from excised G3BP1 bands from peptides containing phospho-S149 (D) and phospho-S232 (E). (F) To confirm efficient knockdown of CK2 subunits under the conditions of the experiments shown in panels A to C, mRNA from U2OS cells treated with siCon or siCK2 was isolated and mRNAs for CK2α, CK2α′, and CK2β were analyzed by quantitative reverse transcription (qRT)-PCR relative to 18S rRNA controls.
We next performed similar [32P]orthophosphate-labeling analysis of cells expressing G3BP1-S149A. In this case, we did not see significant changes in G3BP1 phosphorylation when CK2 was depleted (Fig. 7B, compare lane 1 to lane 2 and lane 3 to lane 4) or when cells entered the recovery phase (Fig. 7B, compare lane 1 to lane 2 and lane 3 to lane 4), as we observed with wild-type GFP-G3BP1 (Fig. 7A). S149A GFP-G3BP1 was still phosphorylated in both control and CK2 knockdown cells, confirming that there are other phosphorylation sites, as previously established (12, 33), that are not responsive to CK2 depletion. We were surprised to see that endogenous G3BP1 phosphorylation did not decrease significantly when the S149A GFP-G3BP1 was expressed.
Since at least one other phosphorylation site on G3BP1 (S232) is known, analysis of 32P labeling of G3BP1 is an indirect measure of S149 phosphorylation. To more directly assess the role of CK2 in phosphorylating G3BP1 in cells, we used liquid chromatography (LC)-mass spectrometry (MS) to quantify phosphopeptides under each condition. We examined untreated U2OS cells, arsenite-stressed cells, and cells allowed to recover from arsenite stress for 90 min. G3BP1 protein was immunoprecipitated, resulting in recovery of 93% of the pool of G3BP1 under each condition prior to mass spectrometry. Analysis of phosphopeptides containing S149 and S232 with LC-MS (Fig. 7D and E) showed ∼60% reduction in S149 phosphorylation during arsenite treatment, consistent with 32P-labeling experiments. Phospho-S149 peptides strongly rebounded after recovery from arsenite stress, similar to what was previously published (12) (Fig. 7C). Strikingly, depletion of CK2 reduced phospho-S149 peptides to ∼32% of the levels in the control, untreated cells, strongly supporting a role for CK2 in regulating S149 phosphorylation (Fig. 7C). In contrast, analysis of peptides containing phospho-S232 did not significantly change during arsenite stress and was only modestly reduced upon CK2 depletion. Unlike in control siRNA-treated cells, there is no rebound of S149 phosphopeptide during recovery under CK2 knockdown conditions (Fig. 7C). The reduction in S149 phosphopeptide during CK2 depletion was statistically significant and reproducible in three experiments. Ion chromatograms showed the S149 and S232 phosphopeptides produced from trypsin digestion and that these peptides were successfully identified (Fig. 7D and E).
We evaluated CK2 knockdown efficiency by Western blotting of the α′ subunit of CK2 and by quantitative PCR (qPCR) (Fig. 7A, B, and F). As expected, the α′ subunit was reduced in siCK2 samples. The α subunit of CK2 was also reduced by Western blotting under all of these conditions (data not shown). mRNA levels for α, α′, and β subunits were all reduced under these conditions when qPCR was used to assess knockdown efficiency (Fig. 7F). Together, these results indicate that casein kinase 2 is linked to G3BP1 phosphorylation at only the S149 site.
CK2 and G3BP1 move into close proximity during arsenite stress and recovery.
Our results indicate that CK2 interacts with G3BP1 and may be a coregulator of SGs. To examine whether CK2 and G3BP1 interact coincident with arsenite stress, we performed proximity ligation assays (PLA) with antibodies against G3BP1 and the α or β subunit of CK2 (Fig. 8A and B or C and D, respectively). This method relies on recognition of two epitopes within 40 nm of each other, followed by amplification and detection of a nucleic acid conjugated to the antibody-epitope pairs (49, 50). Instances of close proximity are highlighted by red dots in IF. PLA was performed in U2OS cells under the following conditions: untreated, arsenite treated, and 1 h of recovery and 2 h of recovery from arsenite. PLA foci marking adjacent CK2α and G3BP1 molecules increased over baseline untreated conditions during arsenite stress and further increased at 1 h of recovery (Fig. 8A and B). PLA foci returned to baseline at 2 h of recovery. These results are statistically significant and consistent with SG disassembly kinetics (Fig. 1A). PLA foci marking adjacent CK2β and G3BP1 decreased during arsenite stress and remained low through the recovery phase (Fig. 8C and D). Although analysis of CK2β was not statistically significant, these results may reflect lack of colocalization of CK2β in arsenite-induced SGs. Using nonspecific IgG controls instead of G3BP1 or CK2β antibodies in the CK2α and CK2β PLA experiments did not show PLA foci reporting close proximity of G3BP1 and CK2, suggesting our assay is specific to G3BP1 and CK2 epitopes (Fig. 8E).
FIG 8.

CK2α and G3BP1 move into close proximity during arsenite stress and recovery. (A) PLA for CK2α and G3BP1 under endogenous concentrations in U2OS cells were conducted during arsenite stress (Ars) with 500 μM arsenite, 1-h recovery (1hr rec), and 2-h recovery (2hr rec). PLA signal (red) and DAPI (blue) are shown. (B) PLA foci were quantified from several fields and over 50 cells per condition. The error bars represent standard errors, and Student's t test was performed to compare treatments; **, P ≤ 0.01; ***, P ≤ 0.001. The indicated treatments are compared against untreated cells (un). (C) PLA was performed for CK2β and G3BP1 as for panel A. (D) PLA foci were quantified as for panel B. (E) Nonspecific rabbit IgG or mouse IgG controls were used in place of G3BP1 or CK2β in the assays shown in panels A and C, respectively. The PLA foci shown here represent background for these conditions.
DISCUSSION
Recent progress in understanding the basis of RNA granule assembly has focused on liquid phase condensation based on short-term, low-affinity interactions between key RNA-binding proteins, often involving islands of low amino acid complexity (9, 24). Many components of SGs have very short residence times within stress granules (seconds), despite the long-term persistence of the SG itself (minutes to hours), creating challenges to explain these properties (25, 26). Posttranslational modifications are commonly found on key SG nucleating proteins; thus, attention is turning to how such modifications may influence SG dynamics. G3BP1 is among the strongest SG nucleating proteins, and previous work indicated that G3BP1 phosphorylation at S149 restricts stress granule assembly by partly inhibiting G3BP1 oligomerization, but a kinase was not identified (12).
Here, we report that casein kinase 2 recognizes S149 of G3BP1 both in vitro and in cells, and that CK2 affects SG assembly in multiple assays, including CK2 subunit overexpression, depletion of CK2 subunits with siRNAs, and chemical inhibition of CK2. The magnitude of these effects on SGs is consistent with the 50% reduction in S149 phosphorylation observed by Tourriere (12), yet the author conjectured that this decrease was sufficient to promote stress granule disassembly (12). Both radioimmunoprecipitation and LC-MS data confirmed that S149 phospho-G3BP1 is reduced only ∼50% upon arsenite treatment. While total G3BP1 phosphorylation continues to decrease during recovery from arsenite stress, as indicated by our radiolabeling experiments, S149 phosphorylation itself increases, as indicated by our LC-MS experiments and previous work by others (Fig. 7C) (12). Tourriere did not investigate phosphorylation of G3BP1 during the recovery phase of stress or identify a kinase responsible for modifying G3BP1. We did not observe a reduction in G3BP1 phosphorylation as a consequence of CK2 depletion when the S149A mutant was expressed. The reduction in phosphorylation expected from CK2 depletion was also not observed when endogenous G3BP1 was examined in cells expressing the S149A mutant, suggesting, but not proving, that CK2 could act on G3BP1 monomers (since S149A promotes G3BP1 oligomerization). However, there was still a strong phospho-G3BP1 signal, in line with the earlier results from Tourriere documenting multiple phosphorylation sites (12). Three phosphorylation sites were initially reported, but only two were assigned amino acid locations (i.e., S149 and S232).
CK2 may affect SG assembly at different levels. First, CK2 can directly phosphorylate a nucleating protein of SGs (G3BP1), thus promoting SG disassembly. Second, CK2 can phosphorylate and enhance the activity of translation initiation factors, thereby pushing the equilibrium toward translational activation and disassembly of SGs (51). Our results showing that CK2 recognizes G3BP1 are consistent with a phosphoproteome CK2 substrate screen in Jurkat cells (52). Phosphorylation of G3BP1, which desensitizes cells to SG formation, is expected to favor cell growth and proliferation by allowing ongoing protein synthesis. Consistent with this expectation, previous work showed that the catalytic α′ subunit of CK2 is induced upon serum stimulation, coincident with G3BP1 phosphorylation (18, 36). Third, it is possible that CK2 influences SG formation independently of kinase activity. Our unpublished data show that depletion of the regulatory β subunit by itself can alter SG dynamics, similar to what we see when the catalytic subunits are depleted. Therefore, CK2 likely regulates SG dynamics through G3BP1 phosphorylation and the sum of other factors.
CK2 is a heterotetramer composed of catalytic α and/or α′ dimers and regulatory β dimers. CK2 is part of a unique, constitutively active class of kinases that do not require autophosphorylation for activation. Instead, CK2 relies on association with the β regulatory subunits and cofactors to regulate activity. A recent report described a crystal structure of the CK2 holoenzyme in which tetramers form a ring structure and the rings can stack on top of each other along an axis (53). Stacking of the rings is proposed to act as an autoregulatory mechanism where half of the active sites are precluded by steric hindrance and the other half are inhibited by binding an acidic loop in the C terminus of the β subunit. This orientation is likely to be partially assembled under physiological conditions and therefore suggests that adjusting the stoichiometry of the subunits in cells could alter substrate recognition by influencing the proportion of holoenzyme in the autoinhibitory conformation. CK2 recognizes and phosphorylates serine/threonine residues flanked by acidic residues (22). The α and α′ subunits of CK2 have been shown to be active in the absence of the β subunit in vitro, and CK2 activity in 3T3 mouse fibroblasts is at least partially accounted for by expression of the catalytic α or α′ subunit (18). Consistent with activity of α and/or α′ subunits independently of the β subunit on some substrates, calmodulin phosphorylation is actually inhibited by addition of the regulatory β subunit (19). Although the results were not statistically significant, CK2β-G3BP1 PLA foci decreased upon arsenite stress and did not recover within the time frame of our experiments, suggesting that only the catalytic subunits are required for recognition of G3BP1. Indeed, we saw the strongest impact on stress granules when we manipulated the CK2α subunit, whether it was in siRNA depletion experiments, expression of wild-type or dominant-negative CK2α, or PLA experiments, suggesting it is a key regulator of SGs. The CK2α′ subunit only weakly influenced SGs, yet we observed changes in CK2α under some conditions, so we cannot rule out a role for CK2α′ in SG regulation.
Our colocalization experiments indicated that the catalytic α and α′ subunits concentrate in arsenite-induced SGs. However, we were unable to detect the regulatory β subunit in SGs. Although our results do not clarify whether CK2 activity is SG associated or remains strictly cytoplasmic, it is tempting to speculate that homo- or heterodimers of α and/or α′ subunits act on G3BP1 similarly to specific activity on calmodulin (19). Indeed, superresolution microscopy detected the α subunit of CK2 buried within arsenite-induced SGs. Previous work indicated that CK2 activity is increased under arsenite stress and would therefore be available to act on G3BP1 to disassemble stress granules once the stress subsided (17). Our PLA experiments support the hypothesis that CK2 is activated during arsenite stress and promotes SG disassembly, since CK2α PLA foci increased during arsenite stress and further increased early during recovery from arsenite stress. SGs are extremely dynamic, with G3BP1 rapidly cycling in and out. Thus, control of SG assembly and disassembly centering on G3BP1 is consistent with a key role for G3BP1 in SG dynamics.
While our results show that CK2 regulates G3BP1 activity in SGs by promoting disassembly, they also implicate CK2 in other areas of biology dependent on phosphorylation-dependent functions of G3BP1. For example, G3BP1 has been described as a phosphorylation-dependent regulator of Ras signaling and RNase (33, 36). Although regulation of Ras signaling by G3BP1 has been questioned (34), further investigation is warranted to determine whether CK2 acts as an upstream regulator of protein expression of targets on which G3BP1 has been shown to act. G3BP1 has also been described as a phosphorylation-dependent RNase, suggesting CK2 may be important in RNA turnover of specific targets (33, 36).
Our results suggest that S149 is a major phosphorylation site affecting stress granule dynamics, and the overall posttranslational code on G3BP1 is an important regulator of SGs. G3BP1 has been identified in global methylome and acetylome screens, suggesting it is methylated and acetylated (28, 29). Other work in our laboratory indicates that G3BP1 demethylation coregulates stress granule assembly (35). S149 phosphorylation may be an intermediate in a series of modifications, including methylation, that influences stress granule assembly. G3BP1 is also poly(ADP) ribosylated and ubiquitinated (31, 32). Identifying the posttranslational modification code that determines G3BP1 function and how CK2 regulates that code through S149 phosphorylation is important.
MATERIALS AND METHODS
Cell culture and plasmids.
U2OS cells stably transfected with either wild-type GFP-G3BP1, S149A GFP-G3BP1, or S149E GFP-G3BP1 were a kind gift from Nancy Kedersha (Brigham and Woman's Hospital, Boston, MA). U2OS cells were cultured under standard conditions in Dulbecco's modified Eagle's medium (DMEM) with 10% fetal bovine serum (FBS). Constructs used to express hemagglutinin (HA)-tagged casein kinase 2 α, α′, and myc-tagged β subunits (Addgene) were previously described (54). Constructs used to express wild-type and dominant-negative Flag-tagged catalytic CK2 α and α′ subunits were a kind gift from Mathias Montenarh (University of Saarlandes, Hamburg, Germany) (46).
Stress and recovery.
Cells were stressed for 45 min with 500 μM sodium arsenite in conditioned medium. For recovery experiments, the cell culture medium was removed, the cells were washed once with PBS, and the medium was replaced with fresh medium equilibrated to 37°C. The cells were then allowed to recover for the indicated times. For dsRNA stress using Mengo-Zn, cells were infected at an MOI of 10 in 2% serum for 2 h prior to washing off the inoculum with PBS and adding fresh DMEM with 10% FBS. Cells were harvested as previously described (42).
CK2 assays.
Purified His-tagged G3BP1, PTB1, and PABP1 were purified in accordance with standard procedures and quantified using bicinchoninic acid (BCA) analysis (Pierce). Fifteen picomoles of G3BP1, PTB1, or PABP1 was incubated with 5 units of purified CK2 (New England BioLabs) in CK2 reaction buffer: 50 mM Tris-HCl, pH 7.5, 10 mM MgCl2, 0.1 mM EDTA, 2 mM dithiothreitol (DTT), 0.01% Brij 35. One hundred microcuries [γ-32P]ATP was added to each reaction, which was conducted using a final volume of 10 μl. The reaction mixtures were incubated at 37°C for the indicated times and analyzed by SDS-PAGE and autoradiography.
Proximity ligation assays.
Proximity ligation assays were performed as previously described (55). Briefly, cells were stressed with arsenite, allowed to recover, and then fixed with 4% formaldehyde. The cells were then permeabilized and hybridized with both rabbit anti-G3BP1 (56) and goat anti-CK2α (Santa Cruz) or rabbit anti-CK2α′ (Bethyl). Secondary antibodies were then hybridized, nucleic acids were ligated, rolling-circle amplification was performed, and amplified DNA was detected in accordance with the manufacturer's instructions (Sigma).
siRNAs and chemical inhibition of CK2.
Inhibition of casein kinase 2 was achieved by transfecting a cocktail of siRNAs against all three subunits of CK2 (α, α′, and β). The siRNA sequences were as follows: CK2α no. 1, GCACAGAAAGCUACGACUA[dTdT]; CK2α no. 2, GUGGAUUUAUAGUAGUUCA[dTdT]; CK2α′ no. 1, UACACGAACAUUGUACUCC[dTdT]; CK2α′ no. 2, UAUCGUUGAAGUGUGGAU C[dTdT]; CK2β no. 1, CTCAGAGGAGGTGTCCTGG [dTdT]; CK2β no. 2, GGUCCCUCACUACCGACAA [dTdT]; G3BP2 no. 1, GGAACAAGAAGAAAGACAACC[dTdT]; G3BP2 no. 2, GAAAGAAAGUUUAUGCAAACC[dTdT] (all from Sigma-Aldrich). For some experiments, CK2α and G3BP1 depletion was accomplished with an siRNA smart pool (Dharmacon). siRNAs were transfected as previously published using a Neon electroporation device (Life Technologies) (42). CK2 activity was inhibited with the specific CK2 inhibitors IQA and TBCA (57). Cells were pretreated for 2 h with 60 μM TBCA or 25 μM IQA prior to arsenite stress experiments or Mengo virus infection to ensure efficient inhibition of CK2.
Immunoprecipitation and 32P labeling of G3BP1 in cells.
Immunoprecipitations were performed essentially as previously described (42). The following modifications were made. U2OS cells stably expressing either wild-type GFP-G3BP1 or the phospho-null S149A mutant (GFP-S149A) were depleted of all CK2 subunits (siCK2) for 48 h. The cells were then incubated in phosphate-free medium for 2 h prior to addition of 150 μCi of [32P]orthophosphoric acid for 1 h. The cells were then exposed to 500 μM arsenite for 45 min or exposed to arsenite and allowed to recover in phosphate-free medium with [32P]orthophosphoric acid for the indicated times, and cell lysates were prepared in radioimmunoprecipitation assay (RIPA) buffer with protease and phosphatase inhibitor cocktails (Thermo Fisher and GBiosciences, respectively). Immunoprecipitations were performed using GFP-nAb magnetic resin (Allele Biotechnology) in RIPA buffer with 1 mg total protein quantified using a BCA kit (Thermo Fisher). The immunoprecipitated material was washed 5 times and eluted using Laemmli sample buffer prior to SDS-PAGE and Western blotting.
Liquid chromatography-mass spectrometry.
U2OS cells were transfected with siRNAs and cultured for 72 h prior to stress induction and recovery. The cells were stressed for 45 min with 500 μM sodium arsenite in conditioned medium. The cells were then allowed to recover in conditioned medium prior to harvesting. The cells were washed in ice-cold PBS and lysed on the plate in RIPA buffer (50 mM Tris-HCl, pH 7.4, 150 mM KCl, 2 mM EDTA, 1% NP-40, 0.5% sodium deoxycholate) and 0.1% sodium dodecyl sulfate containing 1.5× phosphatase inhibitor and 1× protease inhibitor cocktail (GBiosciences and Thermo Fisher, respectively). Four milligrams of lysate was added to each pulldown reaction mixture, and endogenous G3BP1 was immunoprecipitated with approximately 500 ng antibody (Abcam) overnight at 4°C in the presence of protein A resin (Thermo Fisher). The supernatant was added to 2 μg G3BP1 antibody (Proteintech Group) in the presence of protein A resin for an additional night. The beads from each pulldown were washed 5 times and eluted with Laemmli sample buffer. The combined eluates were sent for mass spectrometry. This procedure resulted in recovery of 93% of the G3BP1 from the lysates. G3BP1 peptides were generated by in-gel trypsin digestion and analyzed with an LTQ ion-trap mass spectrometer equipped with a nano-LC electrospray ionization (ESI) source. Approximately 85% of total G3BP1 peptide coverage was achieved in each independent experiment. Normalization for quantification was achieved using nine other peptides from other regions of G3BP. These experiments were repeated at least three times, one of which had technical replicates.
Western blotting.
Cell lysates were prepared in RIPA buffer and resolved with SDS-PAGE. Protein was transferred to nitrocellulose membranes and blocked with Seablock (Pierce). Secondary antibodies were dye labeled (Cell Signaling) for infrared imaging. Secondary antibodies were used at 1:15,000, followed by detection on the Odyssey CLx imaging system (Li-Cor Biosciences). The primary antibodies used in Western blotting were as follows: rabbit anti-G3BP1 (56), goat anti-CK2α (Santa Cruz), rabbit anti-caprin1 (Bethyl), rabbit anti-G3BP2 (Assay Biotech), mouse anti-GAPDH (anti-glyceraldehyde-3-phosphate dehydrogenase) (Millipore), mouse anti-GFP (Santa Cruz), rabbit anti-CK2 α′ (Bethyl), and mouse anti-Flag (Sigma).
Microscopy.
Microscopy was performed at the Integrated Microscopy Core at Baylor College of Medicine, Houston, TX. For experiments studying the effects of G3BP1 S149 on SG dynamics and CK2 localization experiments, an Applied Precision DeltaVision image restoration microscope with conservative deconvolution algorithms was used. For experiments in which high resolution was not necessary, a standard epifluorescence Nikon TE2000 microscope was used. Previously published procedures were followed for sample processing (55, 58). The antibodies used for microscopy were as follows: goat anti-CK2α (Santa Cruz), rabbit anti-CK2α′ (Bethyl), mouse anti-CK2β (Santa Cruz), goat anti-TIA1 (Santa Cruz), rabbit anti-G3BP1 (56), rabbit anti-eIF4G (59), rabbit anti-PKR (ProSci), and mouse anti-Flag (Sigma). For superresolution microscopy, an SR GSD 3D microscope was used (Leica Microsystems). Standard Alexa Fluor 647-conjugated secondary antibodies were used. Imaging was performed at 20-nm resolution in the lateral direction and approximately 50 nm in the vertical.
Image quantification and statistics.
For PLA experiments, over 50 cells per condition were counted. ImageJ was used to detect local maxima in the PLA channel. The number of local maxima was then normalized to the number of cells, and Student's t tests were performed on the data to evaluate statistical significance.
For experiments examining cells treated with CK2 inhibitors, images were preprocessed with a bilateral filter in EMAN2 (60). Cytoplasmic stress granules and nuclei were identified and counted with CellProfiler (61). For all other experiments in which cells with SGs were quantified, between 50 and 150 cells per condition were counted from at least 3 fields of view. Cells were considered positive if they had at least 3 SGs. The percentages of cells with SGs were calculated, and a chi-square test was performed on the data.
ImageJ was used to quantify bands generated from Western blotting using standard procedures.
ACKNOWLEDGMENTS
This work was funded by NIH Public Health Service grant AI50237 and NCI Cancer Center Support grant P30CA125123. Additional support was provided by the Integrated Microscopy Core at Baylor College of Medicine with funding from the NIH (HD007495, DK56338, and CA125123), the Dan L. Duncan Cancer Center, and the John S. Dunn Gulf Coast Consortium for Chemical Genomics.
REFERENCES
- 1.Anderson P, Kedersha N. 2008. Stress granules: the tao of RNA triage. Trends Biochem Sci 33:141–150. doi: 10.1016/j.tibs.2007.12.003. [DOI] [PubMed] [Google Scholar]
- 2.McEwen E. 2005. Heme-regulated inhibitor kinase-mediated phosphorylation of eukaryotic translation initiation factor 2 inhibits translation, induces stress granule formation, and mediates survival upon arsenite exposure. J Biol Chem 280:16925–16933. doi: 10.1074/jbc.M412882200. [DOI] [PubMed] [Google Scholar]
- 3.Reineke LC, Lloyd RE. 2013. Diversion of stress granules and P-bodies during viral infection. Virology 436:255–267. doi: 10.1016/j.virol.2012.11.017. [DOI] [PMC free article] [PubMed] [Google Scholar]
- 4.Farny NG, Kedersha NL, Silver PA. 2009. Metazoan stress granule assembly is mediated by P-eIF2 -dependent and -independent mechanisms. RNA 15:1814–1821. doi: 10.1261/rna.1684009. [DOI] [PMC free article] [PubMed] [Google Scholar]
- 5.Dang Y, Kedersha N, Low W-K, Romo D, Gorospe M, Kaufman R, Anderson P, Liu JO. 2006. Eukaryotic initiation factor 2alpha-independent pathway of stress granule induction by the natural product pateamine A. J Biol Chem 281:32870–32878. doi: 10.1074/jbc.M606149200. [DOI] [PubMed] [Google Scholar]
- 6.Mazroui R, Sukarieh R, Bordeleau M-E, Kaufman RJ, Northcote P, Tanaka J, Gallouzi I, Pelletier J. 2006. Inhibition of ribosome recruitment induces stress granule formation independently of eukaryotic initiation factor 2alpha phosphorylation. Mol Biol Cell 17:4212–4219. doi: 10.1091/mbc.E06-04-0318. [DOI] [PMC free article] [PubMed] [Google Scholar]
- 7.Mokas S, Mills JR, Garreau C, Fournier M-J, Robert F, Arya P, Kaufman RJ, Pelletier J, Mazroui R. 2009. Uncoupling stress granule assembly and translation initiation inhibition. Mol Biol Cell 20:2673–2683. doi: 10.1091/mbc.E08-10-1061. [DOI] [PMC free article] [PubMed] [Google Scholar]
- 8.Emara MM, Fujimura K, Sciaranghella D, Ivanova V, Ivanov P, Anderson P. 2012. Hydrogen peroxide induces stress granule formation independent of eIF2α phosphorylation. Biochem Biophys Res Commun 423:763–769. doi: 10.1016/j.bbrc.2012.06.033. [DOI] [PMC free article] [PubMed] [Google Scholar]
- 9.Kedersha N, Ivanov P, Anderson P. 2013. Stress granules and cell signaling: more than just a passing phase? Trends Biochem Sci 38:494–506. doi: 10.1016/j.tibs.2013.07.004. [DOI] [PMC free article] [PubMed] [Google Scholar]
- 10.Kedersha N, Anderson P. 2007. Mammalian stress granules and processing bodies. Methods Enzymol 431:61–81. doi: 10.1016/S0076-6879(07)31005-7. [DOI] [PubMed] [Google Scholar]
- 11.Kato M, Han TW, Xie S, Shi K, Du X, Wu LC, Mirzaei H, Goldsmith EJ, Longgood J, Pei J, Grishin NV, Frantz DE, Schneider JW, Chen S, Li L, Sawaya MR, Eisenberg D, Tycko R, McKnight SL. 2012. Cell-free formation of RNA granules: low complexity sequence domains form dynamic fibers within hydrogels. Cell 149:753–767. doi: 10.1016/j.cell.2012.04.017. [DOI] [PMC free article] [PubMed] [Google Scholar]
- 12.Tourriere H. 2003. The RasGAP-associated endoribonuclease G3BP assembles stress granules. J Cell Biol 160:823–831. doi: 10.1083/jcb.200212128. [DOI] [PMC free article] [PubMed] [Google Scholar] [Retracted]
- 13.Gilks N, Kedersha N, Ayodele M, Shen L, Stoecklin G, Dember LM, Anderson P. 2004. Stress granule assembly is mediated by prion-like aggregation of TIA-1. Mol Biol Cell 15:5383–5398. doi: 10.1091/mbc.E04-08-0715. [DOI] [PMC free article] [PubMed] [Google Scholar]
- 14.Weber SC, Brangwynne CP. 2012. Getting RNA and protein in phase. Cell 149:1188–1191. doi: 10.1016/j.cell.2012.05.022. [DOI] [PubMed] [Google Scholar]
- 15.Li P, Banjade S, Cheng H-C, Kim S, Chen B, Guo L, Llaguno M, Hollingsworth JV, King DS, Banani SF, Russo PS, Jiang Q-X, Nixon BT, Rosen MK. 2012. Phase transitions in the assembly of multivalent signalling proteins. Nature 483:336–340. doi: 10.1038/nature10879. [DOI] [PMC free article] [PubMed] [Google Scholar]
- 16.Nott TJ, Petsalaki E, Farber P, Jervis D, Fussner E, Plochowietz A, Craggs TD, Bazett-Jones DP, Pawson T, Forman-Kay JD, Baldwin AJ. 2015. Phase transition of a disordered nuage protein generates environmentally responsive membraneless organelles. Mol Cell 57:936–947. doi: 10.1016/j.molcel.2015.01.013. [DOI] [PMC free article] [PubMed] [Google Scholar]
- 17.Sayed M. 2000. Stress-induced activation of protein kinase CK2 by direct interaction with p38 mitogen-activated protein kinase. J Biol Chem 275:16569–16573. doi: 10.1074/jbc.M000312200. [DOI] [PubMed] [Google Scholar]
- 18.Orlandini M, Semplici F, Ferruzzi R, Meggio F, Pinna LA, Oliviero S. 1998. Protein kinase CK2alpha′ is induced by serum as a delayed early gene and cooperates with Ha-ras in fibroblast transformation. J Biol Chem 273:21291–21297. doi: 10.1074/jbc.273.33.21291. [DOI] [PubMed] [Google Scholar]
- 19.Meggio F, Boldyreff B, Marin O, Marchiori F, Perich JW, Issinger OG, Pinna LA. 1992. The effect of polylysine on casein-kinase-2 activity is influenced by both the structure of the protein/peptide substrates and the subunit composition of the enzyme. Eur J Biochem 205:939–945. doi: 10.1111/j.1432-1033.1992.tb16860.x. [DOI] [PubMed] [Google Scholar]
- 20.Bibby AC, Litchfield DW. 2005. The multiple personalities of the regulatory subunit of protein kinase CK2: CK2 dependent and CK2 independent roles reveal a secret identity for CK2beta. Int J Biol Sci 1:67–79. [DOI] [PMC free article] [PubMed] [Google Scholar]
- 21.Arrigoni G, Pagano MA, Sarno S, Cesaro L, James P, Pinna LA. 2008. Mass spectrometry analysis of a protein kinase CK2beta subunit interactome isolated from mouse brain by affinity chromatography. J Proteome Res 7:990–1000. doi: 10.1021/pr070500s. [DOI] [PubMed] [Google Scholar]
- 22.Meggio F, Pinna LA. 2003. One-thousand-and-one substrates of protein kinase CK2? FASEB J 17:349–368. doi: 10.1096/fj.02-0473rev. [DOI] [PubMed] [Google Scholar]
- 23.Homma MK, Wada I, Suzuki T, Yamaki J, Krebs EG, Homma Y. 2005. CK2 phosphorylation of eukaryotic translation initiation factor 5 potentiates cell cycle progression. Proc Natl Acad Sci U S A 102:15688–15693. doi: 10.1073/pnas.0506791102. [DOI] [PMC free article] [PubMed] [Google Scholar]
- 24.Lin Y, Protter DSW, Rosen MK, Parker R. 2015. Formation and maturation of phase-separated liquid droplets by RNA-binding proteins. Mol Cell 60:208–219. doi: 10.1016/j.molcel.2015.08.018. [DOI] [PMC free article] [PubMed] [Google Scholar]
- 25.Bley N, Lederer M, Pfalz B, Reinke C, Fuchs T, Glaß M, Möller B, Hüttelmaier S. 2015. Stress granules are dispensable for mRNA stabilization during cellular stress. Nucleic Acids Res 43:e26–e26. doi: 10.1093/nar/gku1275. [DOI] [PMC free article] [PubMed] [Google Scholar]
- 26.Kedersha N, Stoecklin G, Ayodele M, Yacono P, Lykke-Andersen J, Fritzler MJ, Scheuner D, Kaufman RJ, Golan DE, Anderson P. 2005. Stress granules and processing bodies are dynamically linked sites of mRNP remodeling. J Cell Biol 169:871–884. doi: 10.1083/jcb.200502088. [DOI] [PMC free article] [PubMed] [Google Scholar]
- 27.Mollet S, Cougot N, Wilczynska A, Dautry F, Kress M, Bertrand E, Weil D. 2008. Translationally repressed mRNA transiently cycles through stress granules during stress. Mol Biol Cell 19:4469–4479. doi: 10.1091/mbc.E08-05-0499. [DOI] [PMC free article] [PubMed] [Google Scholar]
- 28.Ong S-E, Mittler G, Mann M. 2004. Identifying and quantifying in vivo methylation sites by heavy methyl SILAC. Nat Methods 1:119–126. doi: 10.1038/nmeth715. [DOI] [PubMed] [Google Scholar]
- 29.Choudhary C, Kumar C, Gnad F, Nielsen ML, Rehman M, Walther TC, Olsen JV, Mann M. 2009. Lysine acetylation targets protein complexes and co-regulates major cellular functions. Science 325:834–840. doi: 10.1126/science.1175371. [DOI] [PubMed] [Google Scholar]
- 30.Bikkavilli RK, Malbon CC. 2011. Arginine methylation of G3BP1 in response to Wnt3a regulates catenin mRNA. J Cell Sci 124:2310–2320. doi: 10.1242/jcs.084046. [DOI] [PMC free article] [PubMed] [Google Scholar]
- 31.Leung AKL, Vyas S, Rood JE, Bhutkar A, Sharp PA, Chang P. 2011. Poly(ADP-ribose) regulates stress responses and microRNA activity in the cytoplasm. Mol Cell 42:489–499. doi: 10.1016/j.molcel.2011.04.015. [DOI] [PMC free article] [PubMed] [Google Scholar]
- 32.Wagner SA, Beli P, Weinert BT, Nielsen ML, Cox J, Mann M, Choudhary C. 2011. A proteome-wide, quantitative survey of in vivo ubiquitylation sites reveals widespread regulatory roles. Mol Cell Proteomics 10:M111.013284. doi: 10.1074/mcp.M111.013284. [DOI] [PMC free article] [PubMed] [Google Scholar]
- 33.Gallouzi IE, Parker F, Chebli K, Maurier F, Labourier E, Barlat I, Capony JP, Tocque B, Tazi J. 1998. A novel phosphorylation-dependent RNase activity of GAP-SH3 binding protein: a potential link between signal transduction and RNA stability. Mol Cell Biol 18:3956–3965. doi: 10.1128/MCB.18.7.3956. [DOI] [PMC free article] [PubMed] [Google Scholar]
- 34.Annibaldi A, Dousse A, Martin S, Tazi J, Widmann C. 2011. Revisiting G3BP1 as a RasGAP binding protein: sensitization of tumor cells to chemotherapy by the RasGAP 317-326 sequence does not involve G3BP1. PLoS One 6:e29024. doi: 10.1371/journal.pone.0029024. [DOI] [PMC free article] [PubMed] [Google Scholar]
- 35.Tsai W-C, Gayatri S, Reineke LC, Sbardella G, Bedford MT, Lloyd RE. 2016. Arginine demethylation of G3BP1 promotes stress granule assembly. J Biol Chem 291:22671–22685. doi: 10.1074/jbc.M116.739573. [DOI] [PMC free article] [PubMed] [Google Scholar]
- 36.Tourriere H, Gallouzi IE, Chebli K, Capony JP, Mouaikel J, van der Geer P, Tazi J. 2001. RasGAP-associated endoribonuclease G3BP: selective RNA degradation and phosphorylation-dependent localization. Mol Cell Biol 21:7747–7760. doi: 10.1128/MCB.21.22.7747-7760.2001. [DOI] [PMC free article] [PubMed] [Google Scholar]
- 37.Ortega AD, Willers IM, Sala S, Cuezva JM. 2010. Human G3BP1 interacts with -F1-ATPase mRNA and inhibits its translation. J Cell Sci 123:2685–2696. doi: 10.1242/jcs.065920. [DOI] [PubMed] [Google Scholar]
- 38.Taniuchi K, Nishimori I, Hollingsworth MA. 2011. The N-terminal domain of G3BP enhances cell motility and invasion by posttranscriptional regulation of BART. Mol Cancer Res 9:856–866. doi: 10.1158/1541-7786.MCR-10-0574. [DOI] [PubMed] [Google Scholar]
- 39.Winslow S, Leandersson K, Larsson C. 2013. Regulation of PMP22 mRNA by G3BP1 affects cell proliferation in breast cancer cells. Mol Cancer 12:156. doi: 10.1186/1476-4598-12-156. [DOI] [PMC free article] [PubMed] [Google Scholar]
- 40.Zekri L, Chebli K, Tourriere H, Nielsen FC, Hansen TVO, Rami A, Tazi J. 2005. Control of fetal growth and neonatal survival by the RasGAP-associated endoribonuclease G3BP. Mol Cell Biol 25:8703–8716. doi: 10.1128/MCB.25.19.8703-8716.2005. [DOI] [PMC free article] [PubMed] [Google Scholar]
- 41.Sarno S, de Moliner E, Ruzzene M, Pagano MA, Battistutta R, Bain J, Fabbro D, Schoepfer J, Elliott M, Furet P, Meggio F, Zanotti G, Pinna LA. 2003. Biochemical and three-dimensional-structural study of the specific inhibition of protein kinase CK2 by [5-oxo-5,6-dihydroindolo-(1,2-a)quinazolin-7-yl]acetic acid (IQA). Biochem J 374:639–646. doi: 10.1042/bj20030674. [DOI] [PMC free article] [PubMed] [Google Scholar]
- 42.Reineke LC, Kedersha N, Langereis MA, van Kuppeveld FJM, Lloyd RE. 2015. Stress granules regulate double-stranded RNA-dependent protein kinase activation through a complex containing G3BP1 and Caprin1. mBio 6:e02486. doi: 10.1128/mBio.02486-14. [DOI] [PMC free article] [PubMed] [Google Scholar]
- 43.Langereis MA, Feng Q, van Kuppeveld FJ. 2013. MDA5 localizes to stress granules, but this localization is not required for the induction of type i interferon. J Virol 87:6314–6325. doi: 10.1128/JVI.03213-12. [DOI] [PMC free article] [PubMed] [Google Scholar]
- 44.Matsuki H, Takahashi M, Higuchi M, Makokha GN, Oie M, Fujii M. 2013. Both G3BP1 and G3BP2 contribute to stress granule formation. Genes Cells 18:135–146. doi: 10.1111/gtc.12023. [DOI] [PubMed] [Google Scholar]
- 45.Dougherty JD, Reineke LC, Lloyd RE. 2014. mRNA decapping enzyme 1a (Dcp1a)-induced translational arrest through protein kinase R (PKR) activation requires the N-terminal enabled vasodilator-stimulated protein homology 1 (EVH1) domain. J Biol Chem 289:3936–3949. doi: 10.1074/jbc.M113.518191. [DOI] [PMC free article] [PubMed] [Google Scholar]
- 46.Ampofo E, Sokolowsky T, Götz C, Montenarh M. 2013. Functional interaction of protein kinase CK2 and activating transcription factor 4 (ATF4), a key player in the cellular stress response. Biochim Biophys Acta 1833:439–451. doi: 10.1016/j.bbamcr.2012.10.025. [DOI] [PubMed] [Google Scholar]
- 47.Obenauer JC, Cantley LC, Yaffe MB. 2003. Scansite 2.0: proteome-wide prediction of cell signaling interactions using short sequence motifs. Nucleic Acids Res 31:3635–3641. doi: 10.1093/nar/gkg584. [DOI] [PMC free article] [PubMed] [Google Scholar]
- 48.Burnett G, Kennedy EP. 1954. The enzymatic phosphorylation of proteins. J Biol Chem 211:969–980. [PubMed] [Google Scholar]
- 49.Söderberg O, Leuchowius K-J, Gullberg M, Jarvius M, Weibrecht I, Larsson L-G, Landegren U. 2008. Characterizing proteins and their interactions in cells and tissues using the in situ proximity ligation assay. Methods 45:227–232. doi: 10.1016/j.ymeth.2008.06.014. [DOI] [PubMed] [Google Scholar]
- 50.Söderberg O, Gullberg M, Jarvius M, Ridderstråle K, Leuchowius K-J, Jarvius J, Wester K, Hydbring P, Bahram F, Larsson L-G, Landegren U. 2006. Direct observation of individual endogenous protein complexes in situ by proximity ligation. Nat Methods 3:995–1000. doi: 10.1038/nmeth947. [DOI] [PubMed] [Google Scholar]
- 51.Gandin V, Masvidal L, Cargnello M, Gyenis L, McLaughlan S, Cai Y, Tenkerian C, Morita M, Balanathan P, Jean-Jean O, Stambolic V, Trost M, Furic L, Larose L, Koromilas AE, Asano K, Litchfield D, Larsson O, Topisirovic I. 2016. mTORC1 and CK2 coordinate ternary and eIF4F complex assembly. Nat Commun 7:11127. doi: 10.1038/ncomms11127. [DOI] [PMC free article] [PubMed] [Google Scholar]
- 52.Wang C, Ye M, Bian Y, Liu F, Cheng K, Dong M, Dong J, Zou H. 2013. Determination of CK2 specificity and substrates by proteome-derived peptide libraries. J Proteome Res 12:3813–3821. doi: 10.1021/pr4002965. [DOI] [PubMed] [Google Scholar]
- 53.Lolli G, Pinna LA, Battistutta R. 2012. Structural determinants of protein kinase CK2 regulation by autoinhibitory polymerization. ACS Chem Biol 7:1158–1163. doi: 10.1021/cb300054n. [DOI] [PubMed] [Google Scholar]
- 54.Turowec JP, Duncan JS, French AC, Gyenis L, St Denis NA, Vilk G, Litchfield DW. 2010. Protein kinase CK2 is a constitutively active enzyme that promotes cell survival: strategies to identify CK2 substrates and manipulate its activity in mammalian cells. Methods Enzymol 484:471–493. doi: 10.1016/B978-0-12-381298-8.00023-X. [DOI] [PubMed] [Google Scholar]
- 55.Reineke LC, Lloyd RE. 2015. The stress granule protein G3BP1 recruits PKR to promote multiple innate immune antiviral responses. J Virol 89:2575–2589. doi: 10.1128/JVI.02791-14. [DOI] [PMC free article] [PubMed] [Google Scholar]
- 56.White JP, Cardenas AM, Marissen WE, Lloyd RE. 2007. Inhibition of cytoplasmic mRNA stress granule formation by a viral proteinase. Cell Host Microbe 2:295–305. doi: 10.1016/j.chom.2007.08.006. [DOI] [PubMed] [Google Scholar]
- 57.Pagano MA, Poletto G, Di Maira G, Cozza G, Ruzzene M, Sarno S, Bain J, Elliott M, Moro S, Zagotto G, Meggio F, Pinna LA. 2007. Tetrabromocinnamic acid (TBCA) and related compounds represent a new class of specific protein kinase CK2 inhibitors. Chembiochem 8:129–139. doi: 10.1002/cbic.200600293. [DOI] [PubMed] [Google Scholar]
- 58.Reineke LC, Dougherty JD, Pierre P, Lloyd RE. 2012. Large G3BP-induced granules trigger eIF2α phosphorylation. Mol Biol Cell 23:3499–3510. doi: 10.1091/mbc.E12-05-0385. [DOI] [PMC free article] [PubMed] [Google Scholar]
- 59.Byrd MP. 2005. Translation of eukaryotic translation initiation factor 4GI (eIF4GI) proceeds from multiple mRNAs containing a novel cap-dependent internal ribosome entry site (IRES) that is active during poliovirus infection. J Biol Chem 280:18610–18622. doi: 10.1074/jbc.M414014200. [DOI] [PubMed] [Google Scholar]
- 60.Tang G, Peng L, Baldwin PR, Mann DS, Jiang W, Rees I, Ludtke SJ. 2007. EMAN2: an extensible image processing suite for electron microscopy. J Struct Biol 157:38–46. doi: 10.1016/j.jsb.2006.05.009. [DOI] [PubMed] [Google Scholar]
- 61.Carpenter AE, Jones TR, Lamprecht MR, Clarke C, Kang IH, Friman O, Guertin DA, Chang JH, Lindquist RA, Moffat J, Golland P, Sabatini DM. 2006. CellProfiler: image analysis software for identifying and quantifying cell phenotypes. Genome Biol 7:R100. doi: 10.1186/gb-2006-7-10-r100. [DOI] [PMC free article] [PubMed] [Google Scholar]