Abstract
The goal of this paper was to evaluate the in vivo kinetics of the novel tau-specific PET radioligand 18F-AV-1451 in cognitively healthy control (HC) and Alzheimer disease (AD) subjects, using reference region analyses. Methods: 18F-AV-1451 PET imaging was performed on 43 subjects (5 young HCs, 23 older HCs, and 15 AD subjects). Data were collected from 0 to 150 min after injection, with a break from 100 to 120 min. T1-weighted MR images were segmented using FreeSurfer to create 14 bilateral regions of interest (ROIs). In all analyses, cerebellar gray matter was used as the reference region. Nondisplaceable binding potentials (BPNDs) were calculated using the simplified reference tissue model (SRTM) and SRTM2; the Logan graphical analysis distribution volume ratio (DVR) was calculated for 30–150 min (DVR30–150). These measurements were compared with each other and used as reference standards for defining an appropriate 20-min window for the SUV ratio (SUVR). Pearson correlations were used to compare the reference standards to 20-min SUVRs (start times varied from 30 to 130 min), for all values, for ROIs with low 18F-AV-1451 binding (lROIs, mean of BPND + 1 and DVR30–150 < 1.5), and for ROIs with high 18F-AV-1451 binding (hROIs, mean of BPND + 1 and DVR30–150 > 1.5). Results: SRTM2 BPND + 1 and DVR30–150 were in good agreement. Both were in agreement with SRTM BPND + 1 for lROIs but were greater than SRTM BPND + 1 for hROIs, resulting in a nonlinear relationship. hROI SUVRs increased from 80–100 to 120–140 min by 0.24 ± 0.15. The SUVR time interval resulting in the highest correlation and slope closest to 1 relative to the reference standards for all values was 120–140 min for hROIs, 60–80 min for lROIs, and 80–100 min for lROIs and hROIs. There was minimal difference between methods when statistical significance between ADs and HCs was calculated. Conclusion: Despite later time periods providing better agreement between reference standards and SUVRs for hROIs, a good compromise for studying lROIs and hROIs is SUVR80–100. The lack of SUVR plateau for hROIs highlights the importance of precise acquisition time for longitudinal assessment.
Keywords: 18F-AV-1451, tau, kinetics, Alzheimer’s
Pathologic accumulation of the tau protein in the form of neurofibrillary tangles and paired helical filaments is common in normal aging and Alzheimer disease (AD) (1,2). Validated and selective in vivo imaging of tau in the human brain would be valuable in the study of AD and tauopathies (progressive supranuclear palsy, corticobasal syndrome, and frontotemporal dementia). A successful tau tracer would act as a biomarker that could be measured against amyloid deposition and cognitive impairment, aid in early disease detection, track rate of decline, and serve as an outcome measure for interventions designed to slow, stop, or reverse tau accumulation in the brain.
There are many challenges in designing a tau tracer, which have been reviewed extensively elsewhere (3). Because tau pathology is intracellular, a tracer must cross the blood–brain barrier and the neuronal membrane. The tau protein has multiple conformations, 6 isoforms, and numerous posttranslational modifications, which also will affect tracer binding. Because tau and amyloid pathology frequently colocalize in AD brains, with tau at lower concentrations than amyloid, the selectivity of a tracer to tau is critical to its use as a biomarker. Given such challenges, a validated tau tracer for AD must have numerous distinctive properties related to specificity, pharmacokinetics, and metabolism (3) and have minimal off-target binding.
Currently there are multiple 18F-labeled tracers being developed for PET imaging of tau pathology. Tohoku University has developed several potential tau tracers, including 18F-THK523 (4–6), 18F-THK5117, 18F-THK5105 (7–9), and 18F-THK5351 (10). Another series of tracers includes 18F-T807, also known as 18F-AV-1451 (11), and 18F-T808 (12).
To fully understand the behavior of a tracer, pharmacokinetic studies using arterial sampling and metabolite correction is the standard. In the absence of such measurements, the simplified reference tissue model (SRTM) (13) and other reference tissue models can be used to explore pharmacokinetics. However, models such as SRTM and Logan graphical analysis (LGA) (14) rely on subjects undergoing scans of 60 min or longer, which can be uncomfortable or impractical for certain populations such as AD. Preferably, a tracer could be quantified using a SUV ratio (SUVR), a method that allows for shorter scan duration.
In this paper, we explored the in vivo kinetics of 18F-AV-1451 using reference tissue analysis approaches, in an effort to obtain robust measures of putative tau binding in healthy control (HC) and AD subjects. Based upon dynamic 18F-AV-1451 datasets collected over 150 min, the primary objectives were to examine radioligand delivery and clearance characteristics, to determine quantitative reference tissue based binding outcomes, and to identify an appropriate time window for SUVR quantification.
MATERIALS AND METHODS
Data Acquisition
This study was approved by Lawrence Berkeley National Laboratory’s Institutional Review Board, and subjects provided written informed consent. Forty-three subjects, including 5 young HCs (yHCs) (all men, mean age ± SD = 22 ± 2 y), 23 HCs (17 women/6 men, mean age ± SD = 78 ± 5 y), and 15 ADs (10 women/5 men, mean age ± SD = 64 ± 8 y) underwent 18F-AV-1451 PET imaging using a Biograph Truepoint 6 PET/CT tomograph (Siemens Medical Systems). PET imaging began on injection of approximately 370 MBq of 18F-AV-1451, and data were acquired for 100 min. After a 20-min break, a second scan was acquired from 120 to 150 min after injection. Nondiagnostic CT scans were acquired before each scan and used for attenuation correction. List-mode PET data were framed as 4 × 15, 8 × 30, 9 × 60, 2 × 180, and 22 × 300 s and reconstructed using ordered-subset expectation maximization (scatter correction, 4 mm gaussian kernel). The first 5 min of PET data were summed, and subsequent frames were realigned to the summed image using SPM8 (http://www.fil.ion.ucl.ac.uk/spm).
MRIs were acquired to define ROIs for each subject, using T1-weighted magnetization prepared rapid gradient echo sequences. Imaging was performed on 1.5-T Avanto (controls: repetition time = 2,110 ms, echo time = 3.58 ms, 1 × 1 × 1 mm voxel size) or 3-T Magnetom Trio (ADs: repetition time = 2,300 ms, echo time = 2.98 ms, 1 × 1 × 1 mm voxel size) systems (Siemens Medical Systems). Native-space MR images were segmented using FreeSurfer (version 5.1; http://surfer.nmr.mgh.harvard.edu/). Cerebellar gray matter was chosen as the reference region because of its lack of tau accumulation in HCs and ADs (1). Preliminary analyses were performed on 14 bilateral ROIs: caudate, putamen, thalamus, pallidum, brain stem, precuneus, hippocampus, and anterior cingulate (ACING), posterior cingulate (PCING), entorhinal, (ENTO), frontal (FRONT), occipital (OCC), parietal (PAR), and temporal (TEMP) cortices. However, most of the analyses were performed in 10 of these ROIs (excluding caudate, pallidum, putamen, and thalamus). A summed image of the realigned PET frames was coregistered to the MR image (SPM8), and these parameters were applied to individual PET frames. No partial volume correction was performed.
Reference Tissue Modeling
Three reference tissue approaches were examined: SRTM (13,15,16), LGA (14), and SUVR. The SRTM yields estimates of nondisplaceable binding potentials (BPNDs), relative radioligand delivery (R1 = K1/K1′ = delivery to ROI/reference), and regional tissue clearance rates (k2) by minimizing the time-weighted sum of squared errors (SSE). Reference tissue clearance (k2’) was calculated as k2/R1 (13). Uptake that occurred in ROIs in which tau accumulation was not expected was also explored.
Agglomerative hierarchical clustering (17) was performed on SRTM k2’ and k2 in AD subjects, because of greater levels of 18F-AV-1451 tau binding in AD subjects than HCs. The clustering procedure began with the SRTM k2’ values in 14 ROIs. ROIs with similar k2’ values were joined to create a cluster. At each step, clusters with similar k2’ values were joined to make larger clusters. When 2 clusters remained, 1 of the clusters was made up of subcortical ROIs in which tau accumulation was not expected (also seen in k2 analysis). This was considered off-target binding and therefore removed from the rest of the analyses. The second cluster of 10 ROIs was used to determine k2’ constraint for SRTM2 and was used in further analyses. We also performed cluster analysis on R1, but this parameter did not differentiate between target and off-target regions.
In the first step of the SRTM2 algorithm, within each subject we looped through all k2’ values (1,000 equally spaced values from minimum to maximum SRTM k2’) and calculated BPND, R1, and k2a (k2a = k2/[1 + BPND] (13)) by minimizing the time-weighted SSE. In the second step, for all k2’ and corresponding BPND, R1, and k2a values, a voxel-weighted SSE was calculated across the 10 ROIs. The k2’ resulting in the lowest voxel-weighted SSE (summed across ROIs) was chosen as the optimal k2’ for that subject. This ROI-based analysis enables computational searching through all possible reasonable values for k2’ rather than a more traditional method of using mean or median SRTM k2’ values for SRTM2.
Once SRTM2 was completed on all subjects, the resulting median k2’ value from SRTM2 (across subjects) was used as the k2ref constraint for LGA for which the slope (distribution volume ratio [DVR] = BPND + 1) was determined from data points between 30 and 150 min.
SRTM and SRTM2 were compared using Akaike information criteria (18) and the F test (18,19). We also compared SRTM BPND with SRTM2 BPND, SRTM2 BPND + 1 with DVR30–150, and SRTM BPND + 1 with DVR30–150 by applying linear regression analysis across the 10 ROIs in all subjects, as well as comparing within ROI and diagnosis using a Bonferroni-corrected t test.
We explored the temporal stability of DVR30–150, SRTM, and SRTM2 BPND by calculating DVR-1 or BPND for shorter intervals and comparing this with results obtained over the full 150 min. The ratio of DVR-1 or BPND from the shorter scan to the full scan was calculated in AD subjects in regions of expected tau accumulation (precuneus, PCING, TEMP, PAR, and OCC).
Exploring SUVR Time Window
Another objective of this paper was to evaluate SUVR time intervals for stable 18F-AV-1451 retention outcomes using SRTM (BPND + 1), SRTM2 (BPND +1), and DVR30–150 as reference standards, given the impracticality of 2.5-h scans. SUVR was calculated over 20-min time intervals, with start times ranging from 30 to 130 min. We performed linear regressions between each reference standard and SUVR measurements at various time intervals (43 subjects, 10 ROIs from SRTM k2’ clustering analysis). Regressions were performed for all values in the reference standard, ROIs with low 18F-AV-1451 binding (lROIs), and ROIs with high 18F-AV-1451 binding (hROIs). We compared resulting r2 and slopes.
Finally, we examined statistical significance (Welch’s t test for unequal variance with Bonferroni correction) in 18F-AV-1451 binding measures between HCs and ADs, and between HCs and yHCs, for all analysis outcomes.
RESULTS
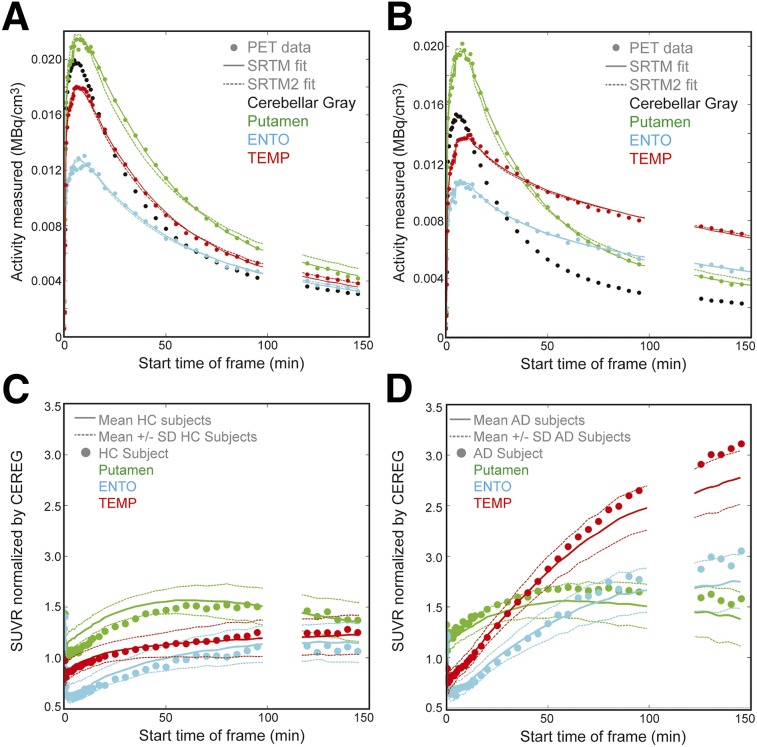
Figures 1A and 1B show typical HC and AD 18F-AV-1451 time–activity curves for cerebellar gray matter, putamen, ENTO, and TEMP. SRTM and SRTM2 curve fits to these ROIs are shown. Figures 1C and 1D show SUVRs for subjects in Figures 1A and 1B and mean (±SD) SUVR curves over all HCs and ADs. Subcortical ROIs (e.g., putamen) have faster clearance than ROIs in which tau accumulation is typical in ADs (e.g., TEMP), shown in Figure 1B.
FIGURE 1.
(A and B) Time–activity curves for HC and AD subjects, respectively. PET data are represented by ●, solid line is SRTM fit to the data, dashed line is SRTM2 fit. (C) SUVR for single HC subject shown in A, and mean ± SD of all HC subjects (solid/dotted lines). (D) SUVRs for AD subject shown in B and mean ± SD of all AD subjects in (solid/dotted lines). Circles represent single subject SUVR, solid line is mean across subject groups, and dashed line represents SD of subject group. Putamen represents off-target binding with quantification challenges.
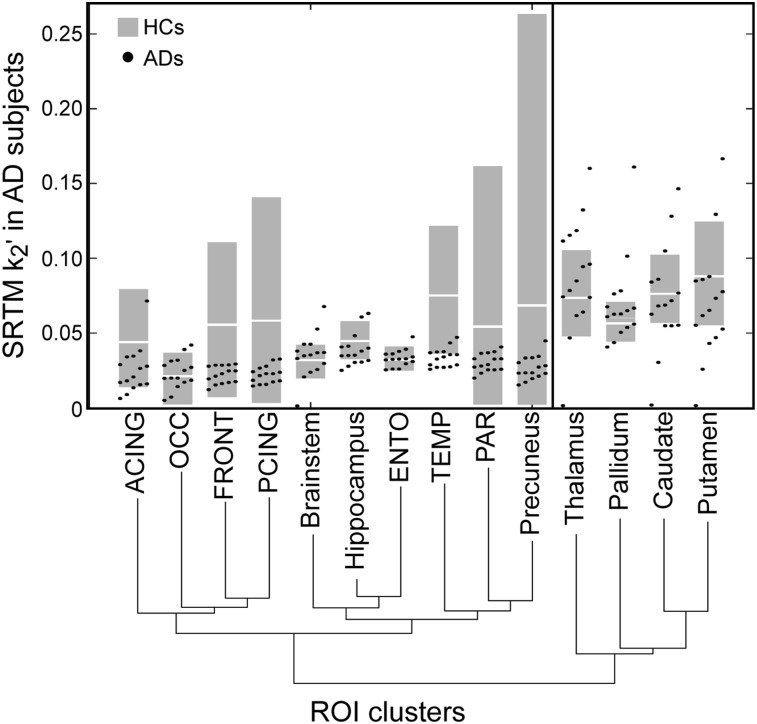
Figure 2 shows SRTM k2’ values in ROIs from individual AD subjects (dots) used in the agglomerative hierarchical clustering, which yielded 2 clusters of ROIs. Also shown is the 10th–90th percentile (gray square) and mean (white line) of HC subjects, not used in clustering. The branches joining the ROI labels represent the order of clustering. For instance, FRONT and PCING were first clustered together, then OCC was added to that cluster. The first group (caudate, pallidum, putamen, and thalamus) have higher k2’ and k2 values, reflecting the faster clearance rate of the putamen in Figure 1. Because tau accumulation is not seen in these regions in AD brain (1,20), the faster clearance is thought to be associated with off-target binding. The second group included brain stem, hippocampus, ACING, PCING, precuneus, ENTO, TEMP, FRONT, OCC, and PAR (10 ROIs). This group exhibited slower kinetics (e.g., Fig. 1, TEMP) and included ROIs known to accumulate tau deposits in AD.
FIGURE 2.
SRTM k2’ agglomerative hierarchical clustering for AD subjects. Plot shows SRTM k2’ values of ROIs in AD subjects used to perform the clustering. Branches show levels of clustering. Gray boxes show 10th–90th percentile of SRTM k2’ for HC, white line is mean of HC; HC subjects not used in clustering.
Clustering was also performed on SRTM k2 across all ROIs for AD subjects. We found the same results, except the brain stem was grouped with 4 subcortical regions. The 4 subcortical regions were excluded from the voxel-weighted SSE step in SRTM2.
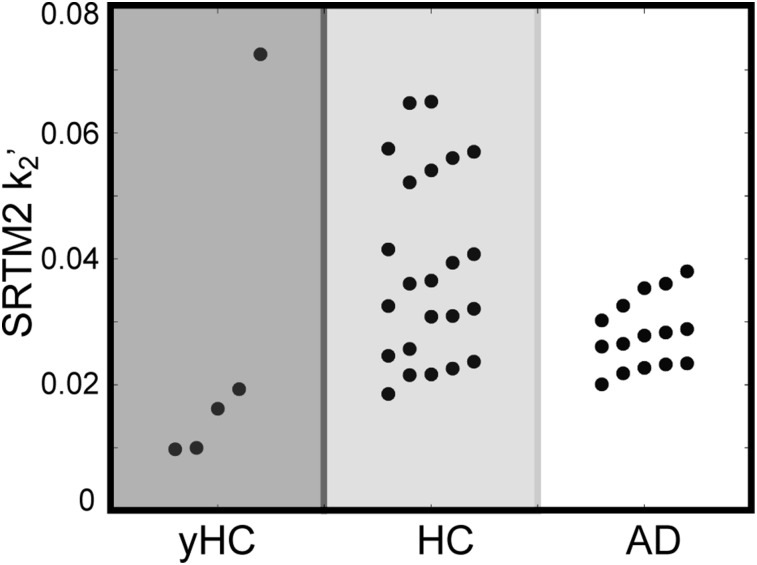
Figure 3 shows the resulting SRTM2 k2’ values across all subjects. Mean k2’ values were 0.03 ± 0.03 min−1 for yHCs, 0.04 ± 0.01 min−1 for HCs, and 0.03 ± 0.01 min−1 for ADs; k2’ values in the HC group were more heterogeneous because SRTM and SRTM2 require different kinetics between reference regions and ROIs to reliably estimate parameters.
FIGURE 3.
SRTM2 k2’ values for yHC, HC, and AD subjects.
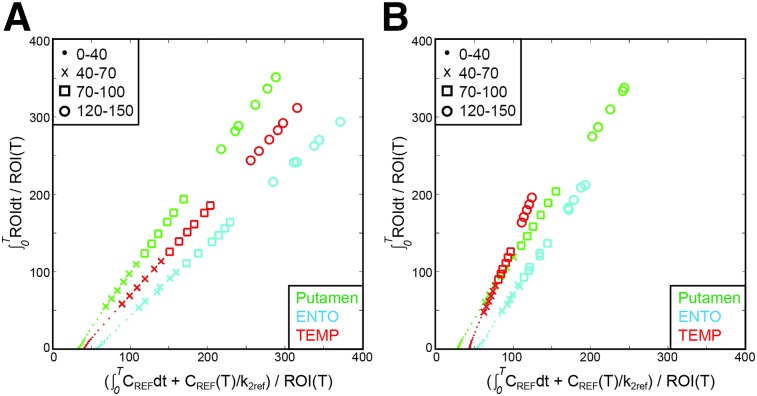
Figure 4 shows the corresponding LGA plots for the HC and AD subjects in Figure 1. The median SRTM2 k2’ value across all subjects (0.03 min−1) was used as k2ref when calculating LGA DVR values (14). Although DVR30–150 was used as a reference standard, the plots delineate several time intervals: 0–40, 40–70, 70–100, and 120–150 min. Slopes in decreasing order are putamen > TEMP > ENTO (HC), and TEMP > putamen > ENTO (AD). In these individual subjects, HC putamen DVR ranged from 1.41 (40–70) to 1.33 (120–150) and AD from 1.48 (40–70) to 1.33 (120–150). HC TEMP DVR values ranged from 1.09 (40–70) to 1.14 (120–150) and AD from 2.28 (40–70) to 2.45 (120–150). The kinetics of putamen in AD and HC do not conform to the kinetics seen in TEMP in which tau accumulation was expected in AD subjects.
FIGURE 4.
LGA DVR for HC (A) and AD (B) subjects from Figure 1. DVR values for 40–70 (x), 70–100 (□), and 120–150 (○) for HC putamen = 1.41, 1.40, 1.33; HC ENTO = 0.93, 0.93, 0.91; HC TEMP = 1.09, 1.14, 1.14; AD putamen = 1.48, 1.39, 1.33; AD ENTO = 1.51, 1.41, 1.47; and AD TEMP = 2.28, 2.29, 2.45.
Comparing SRTM, SRTM2, and DVR
The comparison focused on the 10 ROIs from SRTM k2’ hierarchical clustering, which included ROIs known to have tau accumulation in AD. The F test results with Bonferroni correction did not detect significant differences between SRTM and SRTM2 with the exception of ACING (P < 0.001, 10/15 subjects) and TEMP (P < 0.1, 7/15 subjects). Supplemental Figure 1 (supplemental materials are available at http://jnm.snmjournals.org) shows BPND values from SRTM plotted against SRTM2 (10 ROIs, 43 subjects).
A comparison across the reference standards (SRTM BPND + 1, SRTM2 BPND + 1, DVR30–150) was performed across ROIs of all values, lROIs, and hROIs. The threshold of 1.5 was chosen so there was sufficient dynamic range of values in lROI and hROI groups. Table 1 shows linear regression results between SRTM BPND versus SRTM2 BPND, SRTM BPND + 1 versus DVR30–150, and SRTM2 BPND + 1 versus DVR30–150.
TABLE 1.
Comparison Between Reference Standards
|
x = SRTM BPND, y = SRTM2 BPND |
x = SRTM BPND + 1, y = DVR30–150 |
x = SRTM2 BPND + 1, y = DVR30–150 |
|||||||
| ROIs | Slope | Intercept | r2 | Slope | Intercept | r2 | Slope | Intercept | r2 |
| All | 1.01 | −0.01 | 0.94 | 1.00 | −0.01 | 0.97 | 0.98 | 0.04 | 0.99 |
| lROIs | 0.74 | 0.01 | 0.75 | 0.80 | 0.01 | 0.82 | 1.01 | 0 | 0.95 |
| hROIs | 1.13 | −0.15 | 0.86 | 1.08 | −0.08 | 0.93 | 0.90 | 0.12 | 0.96 |
Supplemental Table 1 examines the temporal stability of SRTM, SRTM2, and DVR-1. SRTM and SRTM2 BPND values calculated from truncated scans were compared with BPND calculated from 0 to 150 min. The DVR-1 values calculated from truncated scans were compared with DVR-1 calculated from 30 to 150 min. The BPND and DVR values were still increasing at later time frames, reflected by the increase in the mean ratio.
Supplemental Table 2 shows mean and SD within yHCs, HCs, and ADs for DVR30–150, SRTM, and SRTM2 R1.
Exploring SUVR Time Window
A major criterion for the choice of an appropriate SUVR time window was high correlation (r2) between the SUVR and reference tissue outcomes. In the interest of minimizing bias effects, we additionally considered it beneficial if the slope was approximately 1.0, although we acknowledge that the underlying true relationship between SUVR and a given reference tissue method may yield a slope≠1.0. Last, if all else was equal, the earliest possible scan time was chosen to minimize patient burden.
The appropriate SUVR time window was explored across all subjects (43 subjects, 10 ROIs) for the full range of binding values, as well as lROIs and hROIs. Supplemental Figure 2 shows the relationships between the 3 reference standards (SRTM BPND + 1, SRTM2 BPND + 1, DVR30–150) and SUVR values calculated at various times (40–60, 80–100, 120–140 min).
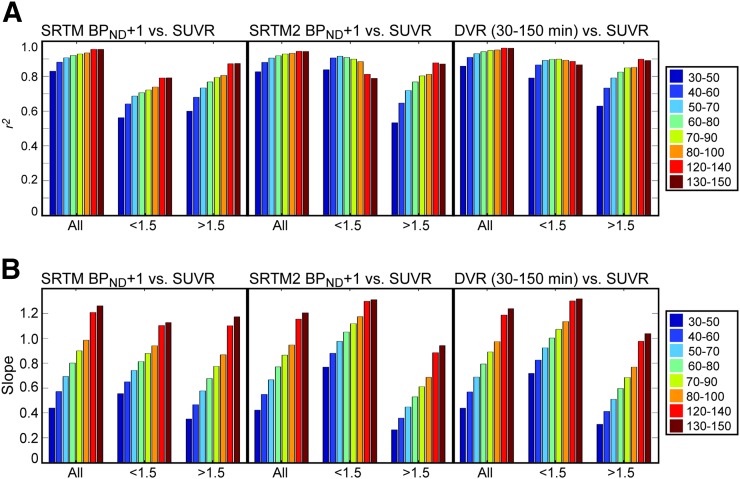
Figure 5 shows the results (A: r2, B: slopes) from the linear regressions between the reference standards and SUVRs at various time intervals for all ROI values, lROIs, and hROIs.
FIGURE 5.
Results of linear regression of SRTM BPND + 1, SRTM2 BPND + 1, and DVR130–150 with SUVR at various time windows. (A) r2. (B) Slope. Regression included 43 subjects and 10 ROIs (FRONT, PAR, OCC, TEMP, ENTO, brain stem, ACING, PCING, hippocampus, and precuneus).
Across all binding levels, the SUVR time interval with the highest correlation with SRTM BPND + 1 was 130–150 min, with SRTM2 BPND + 1 it was 120–140 min, and with DVR30–150 it was 120–140 min. All SUVRs determined with a start time of 50 min or later resulted in r2 greater than 0.9. In the interest of assessing bias in SUVR relative to the reference standard, we also examined slope values. The 80–100 min interval yielded a slope closest to 1 for all reference standards (slopes: SRTM = 0.99, SRTM2 = 0.95, DVR30–150 = 0.97).
In the case of lROIs, SUVR calculated at 130–150 min resulted in the highest correlation with SRTM BPND + 1 (r2 = 0.79), 50–70 min with SRTM2 BPND + 1 (r2 = 0.92), and 70–90 min with DVR30–150 (r2 = 0.90). The SUVR time windows with a slope closest to 1 in comparison to the reference standards were 80–100 min for SRTM BPND + 1 (slope = 0.94), 60–80 min for SRTM2 BPND + 1 (slope = 1.05), and 60–80 min for DVR30–150 (slope = 1.00). In lROIs, LGA and SRTM2 resulted in the highest r2 at earlier SUVR intervals and the correlation decreased at later time intervals, whereas the correlation with SRTM BPND + 1 increased at later time intervals but was overall lower. There is no clear consensus, however, 60–80 min is the best compromise between SRTM2 BPND + 1 and DVR30–150, and these reference standards result in the higher r2 with SUVR measurements.
Last, in the case of hROIs, SUVR130–150 resulted in the highest correlation with SRTM BPND + 1, whereas SUVR120–140 resulted in the highest correlation for both SRTM2 BPND + 1 and DVR30–150. SUVR time intervals yielding slopes closest to 1 were 120–140 min for SRTM BPND + 1 (slope = 1.10), 130–150 min for SRTM2 BPND + 1 (slope = 0.94), and 120–140 min for DVR30–150 (slope = 0.98). For hROIs, high correlation and slope close to 1 are achieved for SUVR measured between 120–140 min for all reference standards.
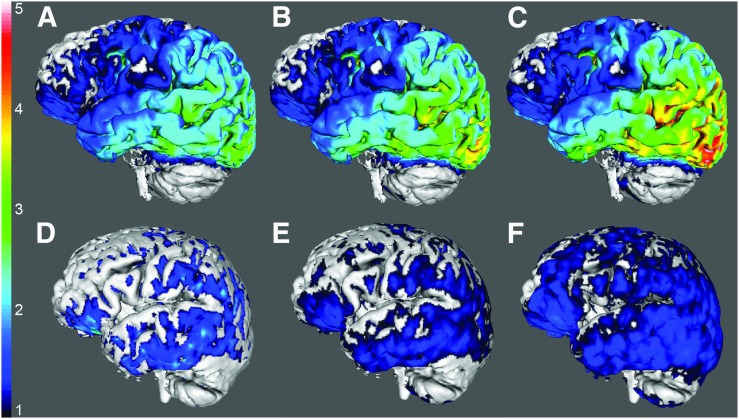
Figure 6 shows SUVR images for the AD (Figs. 6A–6C) and HC (Figs. 6D–6F) subjects from Figures 1 and 4. The SUVR images reflect the suggested time windows for lROIs (60–80 min, Figs. 6A and 6D), entire range of ROIs (80–100 min, Figs. 6B and 6E), and hROIs (120–140 min, Figs. 6C and 6F).
FIGURE 6.
SUVR images for AD (A–C) and HC subjects (D–F) from Figures 1 and 4. SUVRs were calculated from 60–80 (A and D), 80–100 (B and E), and 120–140 min (C and F). Color map ranges for SUVR normalized by cerebellar gray from 1 to 5 for all images.
Statistical Comparisons Between Subject Groups
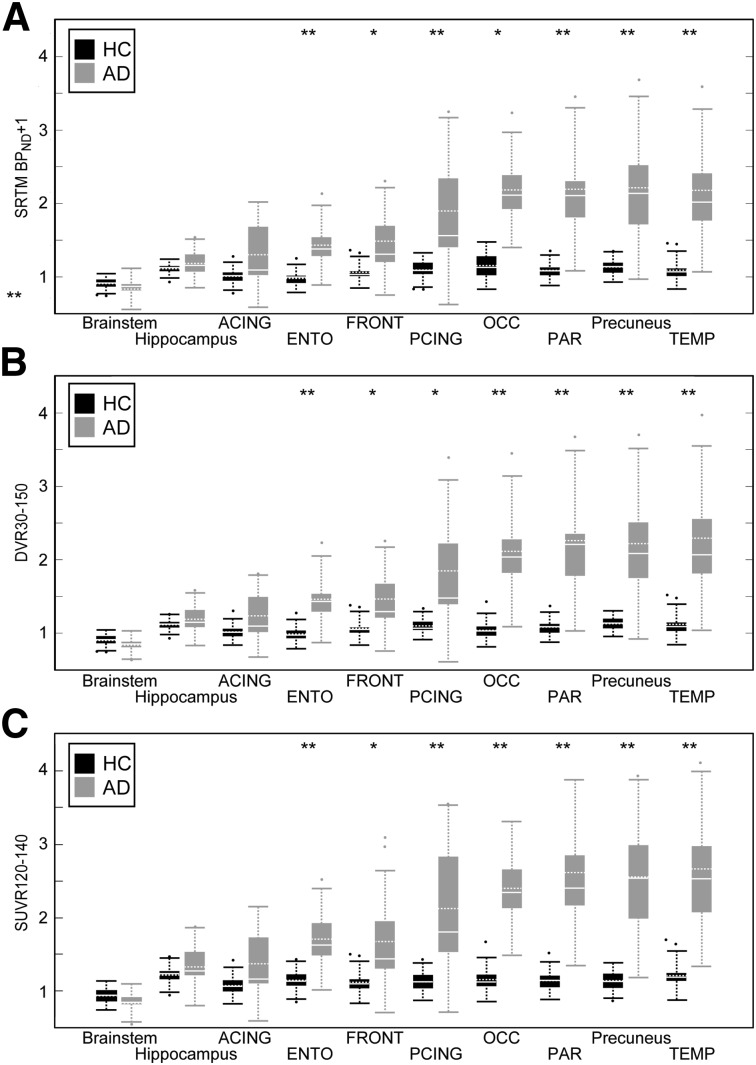
Figure 7 shows regional SRTM BPND + 1 (Fig. 7A), DVR30–150 (Fig. 7B), and SUVR120–140 (Fig. 7C) results; SUVR80–100 results are shown in Supplemental Figure 3. Good agreement was observed for these methods, in terms of statistically significant group differences in 18F-AV-1451 binding between HCs and ADs for the 10 ROIs. Precuneus, PCING, ENTO, TEMP, and PAR showed differences of P < 0.001 across all measurements (including all SUVR times). OCC showed differences of P < 0.001 except for SRTM BPND, where P < 0.01. DVR30–150 in FRONT showed differences of P < 0.001; significance was P < 0.01 for all other measurements. ACING, brain stem, and hippocampus were not significant in any measurement types.
FIGURE 7.
Welch’s t test between HCs and ADs in SRTM BPND + 1 (A), DVR30–150 (B), and SUVR130–150 (C). Boundaries of boxes represent 25th–75th percentiles, solid horizontal white line is median, dashed horizontal white line is mean, dashed vertical line is 5th–95th percentiles. **P < 0.001. *P < 0.01, Bonferroni-corrected.
Differences between yHC and HC off-target binding in subcortical regions were tested using the Bonferroni-corrected Welch’s t test. There was a significant difference in caudate (P < 0.1) using SRTM and SRTM2 BPND, DVR30–150, and SUVR130–150; P < 0.01 for all other SUVR time intervals. In the pallidum, SRTM BPND resulted in a significant difference, P < 0.05; SRTM2 BPND, DVR30–150, and all SUVR time intervals were P < 0.001. In the putamen, SRTM BPND resulted in a significant difference between yHC and HC of P < 0.1, SRTM2 BPND of P < 0.01, and DVR30–150 and all SUVR time intervals of P < 0.001. The thalamus showed no significant difference using SRTM BPND between yHC and HC; SRTM2 BPND, DVR130–150, and all SUVR time intervals resulted in P < 0.1, except for SUVR80–100, which resulted in P < 0.01.
DISCUSSION
This study examined the pharmacokinetics of 18F-AV-1451, a PET tracer for tau pathology, in ADs, HCs, and yHCs, using reference tissue analysis approaches. Our goal was to evaluate the relative performance of the reference tissue methods using dynamic 0–150 min 18F-AV-1451 PET datasets, with these results as reference standards for subsequent determination of an appropriate time interval for measurement of the clinically feasible SUVR tissue ratio. The discussion addresses challenges associated with 18F-AV-1451 off-target binding, the relative performance of the reference standards, and selection of an appropriate SUVR time interval relative to reference standards.
A previous study reporting the pharmacokinetics of 18F-AV-1451 (21) scanned only up to 100 min, did not explore SRTM or SRTM2, and did not derive the k2ref for LGA from the data.
Off-Target Binding
Off-target 18F-AV-1451 binding has been reported previously in humans in the putamen (21–23), pallidum (23), and near the substantia nigra (22,23). A recent postmortem study reported strong off-target 18F-AV-1451 signal in areas that included neuromelanin-containing cells of the substantia nigra (24). In the present work, off-target 18F-AV-1451 binding was apparent in the pallidum, putamen, caudate, and thalamus of HCs. In ADs, 18F-AV-1451 clearance was greater in these ROIs than in ROIs in which tau deposition is expected, whereas R1 was similar for target and off-target ROIs. The 18F-AV-1451 uptake in off-target ROIs across yHCs and HCs in SRTM, SRTM2, DVR, and SUVRs was consistent with off-target binding increases with age that might contribute to heterogeneity in SRTM2 k2’ values across HCs. Studies are ongoing, and future work is needed to better understand the source and impact of putative off-target binding (on regional and voxel-based measures).
Reference Standards
A limitation of this study is the absence of full compartment modeling performed using a metabolite-corrected arterial input function. Without such data, it is not possible to characterize the reference region kinetics, quantify the level of agreement in the nondisplaceable volume of distribution value across subject groups, or assess the relative bias that is expected in the reference tissue BPND and SUVR measures (13–15,24).
Bias in the SRTM method arises when a 1-tissue-compartment model does not adequately describe the kinetics of the reference and target regions. Limitations in SRTM are also realized when analyzing low-binding regions (i.e., HC data) with kinetics that are similar to that of the reference region, and this contributed to heterogeneity in the HC k2’ values. The SRTM analyses performed herein yield different k2’ values for target- and off-target binding regions that is inconsistent with the notion of a uniform nondisplaceable volume of distribution across all brain areas. In a similar manner, it is well known that the LGA outcomes are vulnerable to noise-induced bias (14) and the SUVR tissue ratios are expected to overestimate the true DVR when equilibrium conditions are not established. In the absence of an arterial-based reference standard analysis (that will also have its own sources of bias), we are unable to fully investigate the impact of methodologic bias on reference tissue outcome measures. We acknowledge that the in vivo kinetics of 18F-AV-1451 observed herein over 150 min do not appear to adhere to basic SRTM assumptions (25). Rather than assign a single reference tissue method as the standard, we compared the results of SRTM, SRTM2, and LGA each with the SUVR tissue ratio results; all outcomes varied across target regions from yHC to AD in a manner that is consistent with negligible-to-significant levels of tau deposition expected across the subject groups studied, and TEMP 18F-AV-1451 SUVRs were found to be associated with clinical impairment (22).
Exploring SUVR Time Window
Given the difficulty of tolerating a 2.5-h scan, it is necessary to define a window during which an SUVR can accurately quantify 18F-AV-1451 binding to tau.
Because of the lack of full compartmental modeling, we compared SUVR time intervals with 3 reference standards (SRTM, SRTM2, and LGA) using the criteria of linearity and slope close to 1. When analyzing the full range of ROI values, the later the SUVR was acquired, the higher the correlation with the reference standards, although SUVR80–100 min r2 was lower by only 0.02. The slope was closest to 1 for SUVR80–100 min, and later SUVR measurements overestimated the reference standards. When the high correlation, the slope closest to 1, and minimizing of subject burden with a shorter wait were combined, SUVR80–100 was the best selection for studying the full range of tau deposition. This is in agreement with the previous study (21), which concluded SUVR80–100 was a sufficient time to measure 18F-AV-1451 based on 100 min of data and DVR quantification with a faster k2ref (0.20 min−1).
In determining the appropriate time window for hROIs, SUVR between 120–140 min results in the most linear fit and slope closest to 1 for all reference standards. SUVR130–150 min yielded similar results, so we chose the earliest possible scan time of the 2 similar choices. SUVRs in ROIs in which there is considerable 18F-AV-1451 binding are continuing to increase through the 2.5-h scan. This increase over time mandates accurate scan start time to optimize comparisons in cross-sectional studies and to accurately quantify changes in longitudinal studies.
Last, for studies focusing on early quantification of tau deposition, there is no agreement in appropriate SUVR time interval and the reference standards. SRTM results in lower correlations to SUVR at any time interval in comparison to the other reference standards. SRTM2 is most correlated to SUVR from 50–70 min, with a slope closest to 1 from 60–80 min; DVR is more correlated to SUVR from 70–90 min, with slope closest to 1 from 60–80 min. SUVR60–80 min would optimize the overlap of the optimal time window of SUVRs with reference standards.
CONCLUSION
Despite the challenges posed by slow dynamics, 18F-AV-1451 is able to statistically distinguish between AD and HC subjects with good agreement of P values across various times and quantification methods, showing the strength of this tracer in cross-sectional studies, although longitudinal studies may prove challenging. Although beyond the scope of this paper, it is clear that longitudinal studies must take care to start the emission acquisition precisely at the same time after injection, because scanning later would produce higher values. Future examination of 18F-AV-1451 and related tracers will assist the identification and study of preclinical pathologic tau accumulation in the living human brain, a goal of researchers studying aging and disease.
DISCLOSURE
This work was supported by NIH grants AG034570 and AG045611. William J. Jagust has consulted for Novartis, Genentech, and Bioclinica. Gil Rabinovici receives research funding from Avid Radiopharmaceuticals, GE Healthcare, and Piramal Imaging. No other potential conflict of interest relevant to this article was reported.
Supplementary Material
Acknowledgments
We thank Roger Gunn for use of his SRTM code and Robert Koeppe for thoughtful feedback.
REFERENCES
- 1.Braak H, Braak E. Neuropathological stageing of Alzheimer-related changes. Acta Neuropathol (Berl). 1991;82:239–259. [DOI] [PubMed] [Google Scholar]
- 2.Crary JF, Trojanowski JQ, Schneider JA, et al. Primary age-related tauopathy (PART): a common pathology associated with human aging. Acta Neuropathol (Berl). 2014;128:755–766. [DOI] [PMC free article] [PubMed] [Google Scholar]
- 3.Villemagne VL, Fodero-Tavoletti MT, Masters CL, Rowe CC. Tau imaging: early progress and future directions. Lancet Neurol. 2015;14:114–124. [DOI] [PubMed] [Google Scholar]
- 4.Harada R, Okamura N, Furumoto S, et al. Comparison of the binding characteristics of [18F]THK-523 and other amyloid imaging tracers to Alzheimer’s disease pathology. Eur J Nucl Med Mol Imaging. 2013;40:125–132. [DOI] [PubMed] [Google Scholar]
- 5.Fodero-Tavoletti MT, Furumoto S, Taylor L, et al. Assessing THK523 selectivity for tau deposits in Alzheimer’s disease and non-Alzheimer’s disease tauopathies. Alzheimers Res Ther. 2014;6:11. [DOI] [PMC free article] [PubMed] [Google Scholar]
- 6.Villemagne VL, Furumoto S, Fodero-Tavoletti MT, et al. In vivo evaluation of a novel tau imaging tracer for Alzheimer’s disease. Eur J Nucl Med Mol Imaging. 2014;41:816–826. [DOI] [PubMed] [Google Scholar]
- 7.Okamura N, Furumoto S, Harada R, et al. Novel 18F-labeled arylquinoline derivatives for noninvasive imaging of tau pathology in Alzheimer disease. J Nucl Med. 2013;54:1420–1427. [DOI] [PubMed] [Google Scholar]
- 8.Okamura N, Furumoto S, Fodero-Tavoletti MT, et al. Non-invasive assessment of Alzheimer’s disease neurofibrillary pathology using 18F-THK5105 PET. Brain. 2014;137:1762–1771. [DOI] [PubMed] [Google Scholar]
- 9.Okamura N, Harada R, Furumoto S, et al. Tau PET imaging in Alzheimer’s disease. Curr Neurol Neurosci Rep. 2014;14:500. [DOI] [PubMed] [Google Scholar]
- 10.Harada R, Okamura N, Furumoto S, et al. 18F-THK5351: a novel PET radiotracer for imaging neurofibrillary pathology in Alzheimer disease. J Nucl Med. 2016;57:208–214. [DOI] [PubMed] [Google Scholar]
- 11.Xia CF, Arteaga J, Chen G, et al. [18F]T807, a novel tau positron emission tomography imaging agent for Alzheimer’s disease. Alzheimers Dement. 2013;9:666–676. [DOI] [PubMed] [Google Scholar]
- 12.Chien DT, Szardenings AK, Bahri S, et al. Early clinical PET imaging results with the novel PHF-tau radioligand [F18]-T808. J Alzheimers Dis. 2014;38:171–184. [DOI] [PubMed] [Google Scholar]
- 13.Lammertsma AA, Hume SP. Simplified reference tissue model for PET receptor studies. Neuroimage. 1996;4:153–158. [DOI] [PubMed] [Google Scholar]
- 14.Logan J, Fowler JS, Volkow ND, et al. Distribution volume ratios without blood sampling from graphical analysis of PET data. J Cereb Blood Flow Metab. 1996;16:834–840. [DOI] [PubMed] [Google Scholar]
- 15.Gunn RN, Lammertsma AA, Hume SP, Cunningham VJ. Parametric imaging of ligand-receptor binding in PET using a simplified reference region model. Neuroimage. 1997;6:279–287. [DOI] [PubMed] [Google Scholar]
- 16.Wu Y, Carson RE. Noise reduction in the simplified reference tissue model for neuroreceptor functional imaging. J Cereb Blood Flow Metab. 2002;22:1440–1452. [DOI] [PubMed] [Google Scholar]
- 17.Murtagh F. A survey of recent advances in hierarchicial clustering algorithms. Comput J. 1984;26:354–359. [Google Scholar]
- 18.Akaike H. A new look at the statistical model identification. IEEE Trans Automat Contr. 1974;19:716–723. [Google Scholar]
- 19.Landaw EM, DiStefano JJ., III Multiexponential, multicompartmental, and noncompartmental modeling. II. Data analysis and statistical considerations. Am J Physiol. 1984;246:R665–R677. [DOI] [PubMed] [Google Scholar]
- 20.Bennett DA, Schneider JA, Arvanitakis Z, et al. Neuropathology of older persons without cognitive impairment from two community-based studies. Neurology. 2006;66:1837–1844. [DOI] [PubMed] [Google Scholar]
- 21.Shcherbinin S, Schwarz AJ, Joshi A, et al. Kinetics of the tau PET tracer 18F-AV-1451 (T807) in subjects with normal cognitive function, mild cognitive impairment, and Alzheimer’s disease. J Nucl Med. May 5, 2016 [Epub ahead of print]. [DOI] [PubMed] [Google Scholar]
- 22.Johnson KA, Schultz A, Betensky RA. Tau PET imaging in aging and early Alzheimer’s disease. Ann Neurol. 2016;79:110–119. [DOI] [PMC free article] [PubMed] [Google Scholar]
- 23. Pascual B, Rockers E, Bajaj S, et al. Regional kinetics of [18F]AV-1451 uptake and gadolinium concentration in young and older subjects. Poster presented at: the Human Amyloid Imaging Meeting; Miami, FL; January 14, 2016.
- 24.Marquié M, Normandin MD, Venderburg CR, et al. Validating novel tau positron emission tomography tracer [F-18]-AV-1451 (T807) on postmortem brain tissue. Ann Neurol. 2015;78:787–800. [DOI] [PMC free article] [PubMed] [Google Scholar]
- 25.Salinas CA, Searle GE, Gunn RN. The simplified reference tissue model: model assumption violations and their impact on binding potential. J Cereb Blood Flow Metab. 2015;35:304–311. [DOI] [PMC free article] [PubMed] [Google Scholar]
Associated Data
This section collects any data citations, data availability statements, or supplementary materials included in this article.


