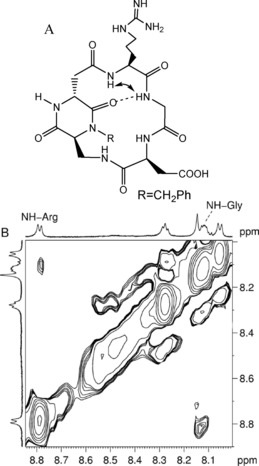
Figure 2.

A) Type III H‐bonding pattern (pseudo‐β‐turn at DKP–Arg) proposed for compound 3 on the basis of spectroscopic data. The arrow indicates the NHArg−NHGly NOE contact and the dotted line represents the intramolecular hydrogen bond. B) tr‐NOESY spectrum (NH region) of compound 3 in MDA‐MB‐231 cancer cell suspension. The cross peaks are relative to the NHArg−NHGly interaction.
