

Abstract
Background
Improved understanding of long-term mortality attributable to injury is needed to accurately inform injury burden studies. This study aims to quantify and describe mortality attributable to injury 12 months after an injury-related hospitalisation in Australia.
Method
A population-based matched cohort study using linked hospital and mortality data from three Australian states during 2008–2010 was conducted. The injured cohort included individuals ≥18 years who had an injury-related hospital admission in 2009. A comparison cohort of non-injured people was obtain by randomly selecting from the electoral roll. This comparison group was matched 1:1 on age, gender and postcode of residence. Pre-index injury health service use and 12-month mortality were examined. Adjusted mortality rate ratios (MRR) and attributable risk were calculated. Cox proportional hazard regression was used to examine the effect of risk factors on survival.
Results
Injured individuals were almost 3 times more likely to die within 12 months following an injury (MRR 2.90; 95% CI: 2.76–3.04). Individuals with a traumatic brain injury (MRR 7.58; 95% CI: 5.92–9.70) or injury to internal organs (MRR 7.38; 95% CI: 5.90–9.22) were 7 times more likely to die than the non-injured group. Injury was likely to be a contributory factor in 92% of mortality within 30 days and 66% of mortality at 12 months following the index injury hospital admission. Adjusted mortality rate ratios varied by type of cause-specific death, with MRR highest for injury-related deaths.
Conclusions
There are likely chronic consequences of sustaining a traumatic injury. Longer follow-up post-discharge is needed to consider deaths likely to be attributable to the injury. Better enumeration of long-term injury-related mortality will have the potential to improve estimates of injury burden.
Keywords: Injury, Mortality, Comorbidity, Hospitalisation, Survival
Background
Measuring the burden of injury accurately is reliant upon good quality information on injury mortality and morbidity at a population level [1]. Global burden of disease (GBD) studies commonly use Disability Adjusted Life Years (DALYs) as a summary measure of population health as it provides information on mortality, morbidity and related disability [2] and can be used to estimate and compare population health burden relative to different health conditions.
DALYs are made up of Years of Life Lost (YLL) to premature mortality and Years of Life Lost to Disability (YLD). Counts of injury-related mortality are used to estimate YLL, which would appear to be a straightforward measure – either through identifying in-hospital mortality in hospital separation data or identifying injury-related deaths using underlying and/or antecedent causes of death in death registration data. However, if the injury occurs months preceding mortality, injury is not always recognised as a contributory cause of death, for example an older person is injured and hospitalised following a fall, and then later dies from a complication, such as pneumonia. As there can be a time delay for deaths following injury, these deaths are often attributed to other underlying conditions [1, 2], particularly for older individuals and individuals who experience comorbid conditions [3], thus under-enumerating injury-related mortality. By linking mortality and hospital separation data collections a longer follow-up period of mortality post-discharge can be examined to try and account for all mortality attributable to injury. This also has implications for trauma support service delivery and service planning, including injury compensation.
Many factors have been associated with higher injury mortality rates, including injury type [4, 5], increasing injury severity [5], older age [5, 6], comorbid conditions [4, 7] and treatment at hospitals without Level 1 trauma centre facilities [8, 9]. Prior injury and matched non-injured cohort comparison studies have identified that survival is worse and mortality rate ratios are higher for injured compared to non-injured cohorts many months post-injury (i.e. ranging from 1 to 33 years) [10–12], but have not examined cause of death for all types of injuries. This study aims to quantify and describe mortality attributable to injury 12 months after an injury-related hospitalisation using a population-based matched cohort study in Australia.
Method
This is a population-based matched cohort study of individuals aged ≥18 years using linked emergency department (ED) presentation, hospital admission and mortality records from three Australian states during 1 January 2008 to 31 December 2010. Ethical approval was obtained from each Human Research Ethics Committee associated with each State Health Department. The method for this study has been described elsewhere [13] and an overview is provided here.
Data sources
The hospitalisation records include information on inpatient admissions from all public and private hospitals in New South Wales (NSW) and Queensland (QLD) and for public hospitals only in South Australia (SA). The hospital admission records contain information on patient demographics, source of referral, diagnoses, external cause(s), hospital separation type, and clinical procedures. Diagnoses and external cause codes were classified using the International Classification of Diseases, 10th Revision, Australian Modification (ICD-10-AM) [14].
The ED presentation records contain information collected from public hospital EDs in NSW, QLD, and SA. Data collected included patient demographics, arrival and departure dates, triage category, type of visit and clinical procedures. Mortality data were obtained from the Registry of Births, Deaths and Marriages in the three Australian states and was used to identify date and cause of death. Cause of death information was not available for n = 40 (0.3%) individuals (n = 33 injured and n = 7 non-injured) in NSW.
Injured population
The injured population included all people in the hospital admission records in 2009 with a principal diagnosis of injury (ICD-10-AM: S00-T75 or T79). If these people had more than oneinjury-related hospital admission in that year, the first injury was identified as the index admission.
Non-injured comparison population
A comparison cohort of people aged ≥18 years who were not hospitalised for an injury during 2009 was randomly selected from electoral rolls covering the study region. Because it is compulsory to vote in Australia, most individuals aged ≥18 years are registered on the electoral roll and thus the comparison group was population based. Individuals in the non-injured cohort were selected by each state data linkage centre, with 1:1 matching performed for the date of the index injury admission of their injured counterpart on age, gender, and postcode of residence. All ED, hospital admission and mortality records for the non-injured cohort were identified.
Data linkage
Data custodians in each state identified the index injury-related hospitalisations in 2009. State-based data linkage centres probabilistically linked all ED, hospitalisation and mortality records of the injured cohort residing in their respective states. Each state data linkage centre was provided an extract of the electoral roll to randomly select the matched, non-injured comparison group. All records from NSW and SA were provided to the Centre for Data Linkage (CDL) and records for these two states were probabilistically linked to identify any cross-border health care use by either injury cases or their matched counterparts. The data linkage centres used identifying information (e.g. name, address, date of birth, gender) to create a unique identifier for each person identified in the linkage process.
Identification of comorbidities
A 12-month look back period from the admission date of the index injury admission was used for the identification of comorbidities for both the injury cases and their matched counterparts. Relevant comorbidities for all study participants were identified using diagnosis classifications from the hospitalisation records [15] and coded according to the The Charlson Comorbidity Index (CCI). The CCI was treated as a categorical variable and categorised as severe comorbidity (CCI ≥ 3), mild comorbidity (CCI = 1 or 2) and no reported comorbidity (CCI = 0). Specific health conditions associated with injury risk and poor recovery [16, 17], including mental health conditions (ICD-10-AM: F20-F50), alcohol misuse and dependence (ICD-10-AM: F10, Y90, Y91, Z50.2, Z71.4, Z72.1) and drug-related dependence (ICD-10-AM: F11-F16, F19, Z50.3, Z71.5, Z72.2) were also identified using hospitalisation records.
Identification of urban and rural location of residence
The Australian Statistical Geographical Standard Remoteness Area was used to identify rural and urban residents. It assigns residents to one of five categories (i.e. major cities, inner regional, outer regional, remote and very remote) using defined index scores of distance to service centres of various sizes [18]. The score is initially calculated on a 1 kilometre grid, and then the mean value for each Census Collection District is aggregated to form the remoteness areas. The five categories were collapsed into two categories: urban (i.e. major cities) and rural (i.e. inner regional, outer regional, remote, and very remote).
Pre-existing health service use and injury type identification
The number of ED presentations, the number of hospital admissions and total length of stay (LOS) in hospital 1 year preceding the index injury-related admission were identified for both the injured cohort and their non-injured counterparts. Specific types of injury were identified using the principal injury diagnosis, including traumatic brain injury (TBI) (ICD-10-AM: S06); hip fractures (ICD-10-AM: S72.0-S72.2); and the relevant ICD-10-AM classifications for nature of injury including all fractures, open wounds, injury to internal organs, superficial injuries, poisoning by drugs, medicaments and biological substances, burns, injury to nerves and spinal cord, and all other injury types.
Injury severity and mortality
Injury severity was estimated using the International Classification of Disease Injury Severity Score (ICISS) by applying previously developed survival risk ratios (SRR) to each individual’s injury diagnosis classifications [19]. The ICISS is derived for each person by multiplying the probability of survival for each injury diagnosis using SRRs calculated for each injury diagnosis. [19] Three severity levels were used to define minor (≥0.99), moderate (0.941–0.99) and serious (≤0.941) injury [20].
Twelve-month mortality was calculated from the admission date of the index injury admission for both the injury cohort and their matched non-injured counterparts. All individuals were followed either to their death or to the end date of the study timeframe (up to 365 days following the index injury admission). Cause of mortality was identified using the underlying cause and up to 20 antecedent cause of death fields and categorised into eight sub-groups of cardiovascular disease (ICD-10: I00-I52, I70-I99), cerebrovascular disease (ICD-10: I60-I69), respiratory infections (ICD-10: J00-J22), non-respiratory infections (ICD-10: A00-B99, N39.0), malignant neoplasms (ICD-10: C00-C96), non-infectious respiratory diseases (ICD-10: J30-J99), injuries (ICD-10: S00-T75, T79 and/or V01-Y98), and all other causes of death.
Data management and analysis
All analyses were performed using SAS version 9.4 [21]. All hospital episodes of care related to the one injury hospitalisation (or other hospitalisation for non-injured cohort) were linked to form a period of care (i.e. all episodes of care related to the original (or index) injury until discharge from the health system). The study cohort contained 167,600 injured individuals with matched non-injured individuals. For 1011 deaths the date of death was logically implausible, and both these individuals and their matched pair were excluded from this analysis.
A Kaplan-Meier plot of survival estimates and a log rank test was used to compare survival distributions of the injured individuals and their matched non-injured counterpart. Cox proportional hazard regression was used to examine the effect of risk factors on survival. The estimated hazard ratios from the Cox proportional hazard model were used as estimates of mortality rate ratios. Non-proportionality was examined using plots of the negative log of the estimated survivor function against time and the log of the negative log of the estimated survivor function against log time [22].
The number of ED attendances, the number of hospital admissions and the pre-injury cumulative hospital LOS in the 12 months preceding the index injury were correlated and thus only the log of pre-injury cumulative hospital LOS was used. Variables included in the final model were age group, sex, urban status, number of Charlson comorbidities (i.e. 0, 1–2 or ≥3), alcohol use and dependence, mental health conditions, drug-related dependence and the log of pre-injury cumulative hospital LOS. These were examined by injury type and injury severity. Matching variables were included in the model to control for any possible confounding by the matching variables [23]. Hazard ratios (HR) and 95% confidence intervals (95%CI) were calculated. The attributable risk percent (AR%) was calculated by subtracting 1 from the adjusted rate ratio, divided by the adjusted rate ratio, multiplied by 100 [24].
Results
There were 166,589 individuals who were injured in 2009 and admitted to hospital in NSW, SA or QLD with a matched non-injured comparison. Males represented 57.0% of those injured, 29.8% were aged 18–34 years, 38.0% were aged 35–64 years, 32.1% were aged ≥65 years, and 65.0% resided in an urban location. The mean age for the injured and non-injured comparison cohorts was 51.8 years (SD = 23.2). The injured individuals had poorer pre-injury health in the year preceding the index injury than the non-injured group. The injured individuals had a higher number of ED attendances, hospital admissions and pre-injury cumulative hospital LOS in the 12 months preceding the index injury than their non-injured counterparts. The injured individuals also had significantly higher proportions of Charlson comorbid conditions, mental health diagnoses, and alcohol and drug-related dependence than the non-injured group (Table 1).
Table 1.
Demographic and health service use characteristics of injury-related hospitalisations of individuals aged 18+ years and matched non-injured comparison cohort in 2009, co-morbidity and mortality data in Australia
| Characteristic | Injury cohort (n = 166,589) |
Non-injured comparison cohort (n = 166,589) |
|||
|---|---|---|---|---|---|
| n | % | n | % | ||
| Australian state | |||||
| New South Wales | 90,833 | 54.5 | 90,833 | 54.5 | |
| Queensland | 58,833 | 35.3 | 58,833 | 35.3 | |
| South Australiaa | 16,923 | 10.2 | 16,923 | 10.2 | |
| Gender | |||||
| Male | 94,939 | 57.0 | 94,939 | 57.0 | |
| Female | 71,650 | 43.0 | 71,650 | 43.0 | |
| Age group | |||||
| 18–24 | 23,350 | 14.0 | 23,350 | 14.0 | |
| 25–34 | 26,395 | 15.8 | 26,395 | 15.8 | |
| 35–44 | 24,168 | 14.5 | 24,168 | 14.5 | |
| 45–54 | 21,452 | 12.9 | 21,452 | 12.9 | |
| 55–64 | 17,642 | 10.6 | 17,642 | 10.6 | |
| 65–74 | 14,322 | 8.6 | 14,322 | 8.6 | |
| 75–84 | 19,862 | 11.9 | 19,862 | 11.9 | |
| 85+ | 19,398 | 11.6 | 19,398 | 11.6 | |
| Location of residence | |||||
| Urban | 108,309 | 65.0 | 108,309 | 65.0 | |
| Rural | 58,280 | 35.0 | 58,280 | 35.0 | |
| Pre-existing health service use | |||||
| Number of emergency department presentations in the 12 months prior to the index injury date | 152,183 | - | 40,469 | - | - |
| Number of hospital admissions in 12 months prior to the index injury date | 153,200 | - | 66,766 | - | - |
| Total hospital length of stay prior to the index injury date (days) | 759,287 | - | 277,099 | - | - |
| Charlson comorbidity conditions | χ 2 (df) | ||||
| 0 | 140,748 | 84.5 | 157,930 | 94.8 | 10004.4 (2)* |
| 1–2 | 21,567 | 13.0 | 8145 | 4.9 | |
| ≥3 | 4274 | 2.6 | 514 | 0.3 | |
| Other health conditions | |||||
| Mental health diagnosesb | 10,390 | 6.2 | 1498 | 0.9 | 6897.1 (1)* |
| Alcohol misuse and dependence | 12,560 | 7.5 | 727 | 0.4 | 10975.8 (1)* |
| Drug-related dependence | 3165 | 1.9 | 369 | 0.2 | 2235.8 (1)* |
*p < 0.0001
a Includes people hospitalised in public hospitals in South Australia only. b Includes depression, schizophrenia, bipolar and anxiety disorders
The injured individuals experienced higher crude and adjusted mortality rate ratios than the non-injured comparison population at the end of the 12 months following the index injury. Adjusting for pre-injury health status and pre-injury cumulative hospital LOS reduced the mortality risk. Ninety-two percent of mortality within 30-days of hospital admission and 66% of mortality at 12 months was likely to be attributable to injury. Individuals with a traumatic brain injury (MRR 7.58; 95% CI: 5.92–9.70) or injury to internal organs (MRR 7.38; 95% CI: 5.90–9.22) were 7 times more likely to die than the non-injured group, with 87% and 86% of mortality at 12 months likely to be attributable to these injuries, respectively. Poisoning (83%) and burns (75%) also had a high proportion of deaths at 12 months likely to be attributable to the original injury. Individuals with a hip fracture had 3.7 times the adjusted mortality rate ratio than the non-injured group and 73% of mortality at 12 months was likely to be attributable to the hip fracture. The attributable risk of mortality increased with increasing injury severity and decreased with increasing age (Table 2). The log rank test showed a significant difference in survival between injured and non-injured individuals (χ 2 = 4545.5, df = 1; p < 0.0001), with injured individuals experiencing worse survival at 12 months post the index injury admission date (Fig. 1).
Table 2.
Mortality rate ratios by injury type and severity for injury-related hospitalisations of individuals aged 18+ years and matched non-injured comparison cohort within the 12 months post the index injury date, linked hospitalisation and mortality data in Australia
| Injured No. deaths |
Non-injured No. deaths |
Unadjusted mortality rate ratio | 95%CI | Adjusted mortality rate ratioa,b | 95%CI | Adjusted attributable risk%a,b | |
|---|---|---|---|---|---|---|---|
| Mortality | |||||||
| Within 30 days | 3015 | 205 | 15.07* | 13.06–17.39 | 12.13* | 10.29–14.29 | 92 |
| Within 3 months | 5327 | 659 | 8.69* | 7.99–9.45 | 6.31* | 5.75–6.93 | 84 |
| Within 6 months | 7471 | 1368 | 6.00* | 5.65–6.37 | 4.27* | 4.00–4.57 | 77 |
| Within 12 months | 10,638 | 2970 | 4.07* | 3.89–4.24 | 2.90* | 2.76–3.04 | 66 |
| Injury type | |||||||
| Fracture | 5005 | 1504 | 3.90* | 3.67–4.15 | 2.80* | 2.61–3.01 | 64 |
| Hip fracture | 2390 | 581 | 5.34* | 4.82–5.91 | 3.67* | 3.27–4.12 | 73 |
| Open wound | 1312 | 417 | 3.53* | 3.14–3.97 | 2.57* | 2.25–2.93 | 61 |
| Injury to internal organs | 991 | 141 | 9.48* | 7.74–11.60 | 7.38* | 5.90–9.22 | 86 |
| Traumatic brain injury | 870 | 119 | 10.22* | 8.18–12.77 | 7.58* | 5.92–9.70 | 87 |
| Superficial injuries | 797 | 267 | 3.27* | 2.83–3.78 | 2.21* | 1.87–2.60 | 55 |
| Poisoning by drugs, medicaments and biological substances | 479 | 50 | 10.56* | 7.78–14.34 | 6.06* | 3.93–9.33 | 83 |
| Burns | 69 | 12 | 5.75* | 3.12–10.61 | 4.06* | 1.71–9.63 | 75 |
| Injury to nerves and spinal cord | 32 | 15 | 2.07** | 1.12–3.83 | 1.93 | 0.88–4.24 | 48 |
| All other and unspecified injuries | 1953 | 564 | 3.99* | 3.61–4.41 | 2.76* | 2.47–3.08 | 64 |
| Injury severity score (ICISS range) | |||||||
| Minor (≥0.99) | 1427 | 597 | 2.57* | 2.33–2.84 | 1.82* | 1.62–2.05 | 45 |
| Moderate (0.942- < 0.99) | 4179 | 1277 | 3.68* | 3.44–3.93 | 2.54* | 2.35–2.73 | 61 |
| Serious (<0.942) | 5032 | 1096 | 5.85* | 5.43–6.29 | 4.17* | 3.85–4.52 | 76 |
| Age group | |||||||
| 18–24 | 94 | 7 | 13.43* | 6.23–28.93 | 28.08* | 7.66–103.00 | 96 |
| 25–34 | 168 | 8 | 21.00* | 10.33–46.68 | 25.59* | 8.33–78.63 | 96 |
| 35–44 | 245 | 23 | 10.65* | 6.95–16.33 | 7.18* | 4.06–12.71 | 86 |
| 45–54 | 333 | 56 | 6.07* | 4.56–8.07 | 4.63* | 3.11–6.88 | 78 |
| 55–64 | 473 | 69 | 6.87* | 5.33–8.84 | 5.00* | 3.45–7.25 | 80 |
| 65–74 | 989 | 186 | 5.56* | 4.74–6.53 | 2.89* | 2.36–3.53 | 65 |
| 75–84 | 3056 | 727 | 4.84* | 4.44–5.28 | 3.16* | 2.87–3.49 | 68 |
| 85+ | 5280 | 1894 | 3.35* | 3.16–3.54 | 2.58* | 2.42–2.75 | 61 |
*p < 0.0001; **p < 0.02
aAdjusted for age group, sex, urban status, number of Charlson comorbidities (i.e. 0, 1–2 or ≥3), alcohol use and dependence, mental health conditions, drug-related dependence and the log of pre-injury cumulative hospital LOS. bAge group analyses adjusted for sex, urban status, number of Charlson comorbidities (i.e. 0, 1–2 or ≥3), alcohol use and dependence, mental health conditions, drug-related dependence and the log of pre-injury cumulative hospital LOS
Fig. 1.
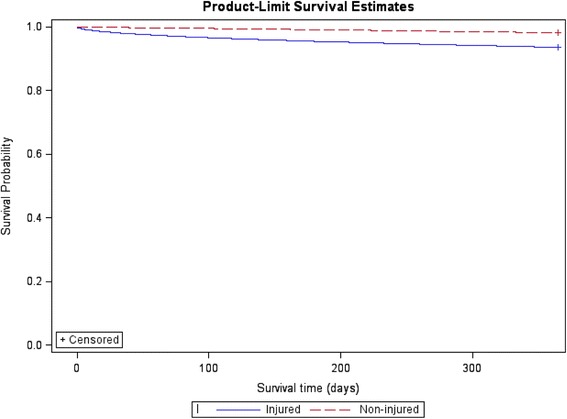
Survival of hospitalised injured individuals aged 18+ years and matched non-injured comparison cohort within the 12 months post the index injury date, linked hospitalisation and mortality data in Australia
The attributable risk percentages ranged from 94% for malignant neoplasms to 99% for injuries where the cause of death was likely to be attributable back to the original injury (Table 3). Of the injured individuals aged ≥ 75 years with a cause of death of respiratory infection (n = 1309), their most common principal injury diagnoses were hip fracture (n = 388; 29.6%), open wounds (n = 168; 12.8%), superficial injury (n = 108; 8.3%), injury to internal organs (n = 75; 5.7%), and TBI (n = 67; 5.1%). Hip fractures were also a common principal diagnosis of injury for injured individuals ≥ 75 years with a cause of death of non-respiratory infections, such as sepsis (n = 237; 26.9% with 882 total deaths) and non-respiratory diseases, such as pneumothorax (n = 563; 26.9%, with 2096 total deaths).
Table 3.
Mortality rate ratios by cause of death for injury-related hospitalisations of individuals aged 18+ years and matched non-injured comparison cohort within the 12 months post the index injury date, linked hospitalisation and mortality data in Australia
| Cause of deatha | Injured No. deaths |
Non-injured No. deaths |
Unadjusted mortality rate ratio | 95%CI | Adjusted mortality rate ratiob | 95%CI | Adjusted attributable risk%b |
|---|---|---|---|---|---|---|---|
| Underlying and/or antecedent cause of deathc | |||||||
| Injuries | 2548 | 166 | 93.69* | 64.12–136.89 | 81.06* | 51.87–126.67 | 99 |
| Cardiovascular disease | 5926 | 537 | 25.62* | 22.43–29.26 | 18.35* | 15.88–21.22 | 95 |
| Cerebrovascular disease | 1887 | 159 | 26.70* | 21.00–33.95 | 22.51* | 16.87–30.05 | 96 |
| Respiratory infections | 1487 | 133 | 27.98* | 21.22–36.89 | 21.04* | 15.48–28.60 | 95 |
| Non-respiratory infections | 1079 | 87 | 30.20* | 21.57–42.29 | 20.43* | 14.22–29.38 | 95 |
| Malignant neoplasms | 2082 | 161 | 26.91* | 21.41–33.84 | 16.16* | 12.63–20.68 | 94 |
| Non-infectious respiratory diseases | 2535 | 204 | 30.25* | 24.28–37.69 | 19.49* | 15.42–24.65 | 95 |
| All other deaths | 735 | 43 | 40.16* | 25.16–64.11 | 50.68* | 24.77–103.72 | 98 |
*p < 0.0001
aCause of death was not able to be provided for n = 40 individuals in NSW. bAdjusted for age group, sex, urban status, number of Charlson comorbidities (i.e. 0, 1–2 or ≥3), alcohol use and dependence, mental health conditions, drug-related dependence and the log of pre-injury cumulative hospital LOS. cCause of death was not mutually exclusive
Discussion
Injury mortality remains a substantial burden, with GBD estimates indicating that injury was accountable for approximately 4.8 million deaths worldwide in 2013 [25]. This study identified that injured individuals had worse survival at 12 months after their injury admission compared to a matched non-injured group and that higher mortality rates largely remained for injured individuals after adjusting for pre-injury health conditions. Reasons why the risk of mortality remains elevated for the injury cohort is unclear, but suggests that there are likely to be long-term chronic consequences of sustaining a traumatic injury [26].
Injured individuals had the highest elevated mortality risk within 30 days of their index injury admission (MRR 12.13; 95% CI: 10.29–14.29), but at 12 months following their injury admission they still had twice the risk of mortality compared to the non-injured group. Attributing a death to injury-related causes soon after the injury event occurred is likely to be relatively straightforward. However, for some individuals, such as those who also have chronic health conditions or older people who might be less likely to recover quickly from injury compared to younger individuals [27, 28], they can have an elevated risk of mortality following their injury for a considerable period of time [3, 11, 28]. In the current study, nearly all mortality within 30 days of the index injury admission was likely to be attributed to the initial injury, with 66% of mortality at 12 months still likely to be attributable to the original injury. This suggests that at up to 1 year following a hospitalised injury, individuals can still have an elevated mortality risk.
Those individuals who sustained minor, moderate and severe injuries had an elevated risk of mortality at 12 months after the index injury admission compared to the non-injured group. Previous studies of mortality at 10 years following an injury have also shown that severe injuries have a higher attributable mortality risk [10], while a study of 10 year mortality following a burn injury did not identify a positive relationship between burn severity and mortality [12]. Duke and colleagues [12] proposed that this might be due to individuals with the most severe burns dying during their initial hospitalisation and/or that the severely injured group of individuals could be a more robust population.
Individuals who sustained a TBI had a 7 times elevated risk of mortality compared to the non-injured group at 12 months after the injury. Cameron et al [10] found, in a study of all-cause mortality after hospitalised injury with a matched non-injured comparison group, that individuals who sustained a brain injury had 3 times elevated risk of mortality compared to the non-injured group even up to 10 years post the initial injury. Likewise, Baguley et al [29], in a comparison of survival of TBI patients with the general population, identified that TBI patients had a 5-fold increased risk of death and McMillian et al [30], in a matched case-control study of injured patients with and without head injury, found an elevated risk of mortality for patients with head injury up to 13 years post-injury.
The original injury event was identified as likely to be a contributory cause for up to 99% of mortality within 12 months of the index injury hospitalisation. There was an elevated risk for all specific causes of death following an injury. That 95% of deaths due to respiratory infections were likely to be attributable back to the injury event is not surprising. Older individuals, in particular, who died sometime after their injury, often have their deaths attributed to other underlying conditions sustained during their recovery period, such as pneumonia [1, 2], which ultimately under-enumerates mortality related to injury.
The current study used underlying and antecedent causes of death to identify cause of death. While this resulted in cause of death that was not mutually exclusive, only using the underlying cause would have underestimated injury as a potential contributory cause of death. Previous research has identified that only using an underlying cause of death under-enumerates injury-related deaths [31], with one study finding that, of injured individuals who died in hospital, only 48% of deaths had an underlying injury-related cause of death classification in their death certificate [32]. There is a need to take into account delayed mortality likely to be related to the initial injury when estimating the extent of injury-related mortality post-hospitalisation [10]. This has implications for the length of trauma patient follow-up studies, for information provided to individuals and their families following trauma treatment [28], for the support services provided to trauma patients post-discharge [12], for injury compensation, and for estimating the DALY in terms of calculating the YLL. Sensitivity estimates of the effect on the DALY of varying YLL could be examined using the injury burden calculator [33].
There were several limitations associated with the current study. It was possible to undertake cross-border record linkage in only two states, which may have resulted in some individuals residing near state borders using health services that may have changed the case-comparison group status of an individual or resulted in additional health service use being recorded for an individual. No private hospital injury hospitalisation data was obtained from SA which will under-enumerate the number of injury hospitalisations, neither was private hospital ED presentation data able to be obtained. However, 81% of hospital separations for injury occur at public hospitals in Australia [34]. It is possible that equity of access to health services and hospital admission policies played a role in whether an individual presented and/or was admitted to hospital [35] and this would have had an impact on injury and comparison cohort selection. There were wide confidence intervals for the adjusted mortality rate ratios for individuals aged less than 34 years and these results should be interpreted with caution.
It is compulsory to vote in Australia, so electoral rolls serve as good population lists for population based sampling for people 18 years or older. However, there are some individuals who do not enrol to vote (e.ge. young people who have not yet enrolled and older people who may be incapacitated [36]) and this may have restricted the selection of the comparison cohort. The number of comorbidities was likely to be under-enumerated from the hospitalisation data as only comorbidities that were relevant to the present hospital episode of care are usually reported. However, in using a 1 year look-back period to identify comorbid conditions, it is likely that better prevalence estimates of comorbid conditions were able to be generated [37]. Inconsistency and/or misclassification in hospitalisation records is likely to exist, but data validity was not able to be assessed. There is also likely to be some degree of error in the record linkage process.
Conclusion
Individuals who are hospitalised after sustaining an injury can have up to twice the mortality risk 12 months following their injury, suggesting that there are chronic consequences of traumatic injury. Longer follow-up after injury hospitalisation is needed to consider deaths likely to be attributable to the injury that occur post-discharge. Better enumeration of long-term injury-related mortality will improve YLL estimates that then have the potential to improve estimates of the injury burden.
Acknowledgements
The authors wish to thank the New South Wales (NSW) Ministry of Health, the Queensland Department of Health, and the South Australian Department of Health and Ageing for providing access to their emergency department presentation and admitted patient data collections, the NSW, Queensland and South Australian Registries of Births Deaths and Marriages for providing access to mortality data, and the NSW, Queensland and South Australian electoral commissions for providing access to their electoral rolls. The authors would also like to thank the Centre for Health Record Linkage (CHeReL), the Statistical Services Branch of the Queensland Department of Health, SA-NT DataLink, and the Centre for Data Linkage for conducting the record linkage.
Funding
The research was supported by the Population Health Research Network with funding from the Australian Government National Collaborative Research Infrastructure Strategy and the Western Australian Minister for Science and Innovation. CC was supported by a Public Health Fellowship (ID 428254) from the National Health and Medical Research Council (NHMRC) Australia.
Availability of data
The data that support the findings of this study are available from the State Health Departments, the Registries of Births, Deaths and Marriages and the Electoral Commission in each state in Australia, but restrictions apply to the availability of these data, which were used under license for the current study, and so are not publicly available.. Data are however available from the authors upon reasonable request and with permission of all data custodians supplying the original data and with approval from each ethics committee.
Authors’ contributions
RM, CC and RMc were all involved in study concept and design. RM acquired the data, conducted the analysis and wrote the first draft of the manuscript. RM, CC and RMc were all involved in interpretation of data and critical revision of the manuscript. All authors read and approved the final manuscript.
Competing interests
The authors declare that they have no competing interests.
Consent for publication
Not applicable.
Ethics approval and consent to participate
Ethical approval was obtained from the New South Wales Population and Health Services Research Ethics Committee (Approval number: 2012/12/438), the South Australian Department of Health and Ageing Human Research Ethics Committee (Approval number: 13/SAH/11), and the Queensland Health Department Human Research Ethics Committee ratified the existing ethics approvals (HREC/13/QHC/24). A waiver of consent was granted by the ethics committees.
Abbreviations
- CCI
Charlson Comorbidity Index
- DALY
Disability Adjusted Life Year
- ED
Emergency Department
- GBD
Global Burden of Disease
- ICD-10-AM
International Classification of Diseases, 10th Revision, Australian Modification
- ICISS
International Classification of Disease Injury Severity Score
- LOS
Length of stay
- MRR
Adjusted mortality rate ratios
- NSW
New South Wales
- QLD
Queensland
- SA
South Australia
- TBI
Traumatic Brain Injury
- YLD
Years of Life Lost to Disability
- YLL
Years of Life Lost
Contributor Information
Rebecca J. Mitchell, Phone: +61 2 9850 2321, Email: r.mitchell@mq.edu.au
Cate M. Cameron, Email: cate.cameron@griffith.edu.au
Rod McClure, Email: rmcclure@cdc.gov.
References
- 1.Lyons R, Kendrick D, Towner E, Christie N, Macey S, Coupland C, Gabbe B. Measuring the population burden of injuries - Implications for global and national estimates: A multi-centre prospective UK longitudional study. PLoS Med. 2011;8(12):e1001140. doi: 10.1371/journal.pmed.1001140. [DOI] [PMC free article] [PubMed] [Google Scholar]
- 2.Polinder S, Haagsma J, Toet H, Van Beeck E. Epidemiological burden of minor, major and fatal trauma in a national injury pyramid. Br J Surg. 2011;99(Suppl 1):114–121. doi: 10.1002/bjs.7708. [DOI] [PubMed] [Google Scholar]
- 3.Polinder S, Haagsma J, Lyons R, Gabbe B, Ameratunga S, Cryer C, Derrett S, Harrison J, Segui-Gomez M, Van Beeck E. Measuring the population burden of fatal and non-fatal injury. Epidemiol Rev. 2012;34(1):17–31. doi: 10.1093/epirev/mxr022. [DOI] [PubMed] [Google Scholar]
- 4.Hong J, Lee W, Kim M, Lee B, Shin S, Park H. Effect of comorbidity on length of stay and in-hospital mortality among unintentionally injured patients. Accid Anal Prev. 2013;52:44–50. doi: 10.1016/j.aap.2012.12.007. [DOI] [PubMed] [Google Scholar]
- 5.Giannoudis P, Harwood P, Court-Brown C, Pape H. Severe and multiple traum in older patients: incidence and mortality. Injury. 2009;40:362–367. doi: 10.1016/j.injury.2008.10.016. [DOI] [PubMed] [Google Scholar]
- 6.Nott M, Gates T, Baguley I. Age-related trends in late mortality following traumatic brain injury: A multicentre inception cohort study. Australas J Ageing. 2015;34(2):E1–E6. doi: 10.1111/ajag.12151. [DOI] [PubMed] [Google Scholar]
- 7.Niven D, Kirkpatrick A, Ball C, Laupland K. Effect of comorbid illness on long-term outcome of adults suffering major traumatic injury: a population-based cohort study. Am J Surg. 2012;204:151–156. doi: 10.1016/j.amjsurg.2012.02.014. [DOI] [PubMed] [Google Scholar]
- 8.MacKenzie EJ, Rivara FP, Jurkovich GJ, Nathens AB, Frey KP, Egleston BL, Salkever DS, Scharfstein DO. A National Evaluation of the Effect of Trauma-Center Care on Mortality. N Engl J Med. 2006;354(4):366–378. doi: 10.1056/NEJMsa052049. [DOI] [PubMed] [Google Scholar]
- 9.Curtis K, Chong S, Mitchell R, Newcombe M, Black D, Langcake M. Outcomes of severely injured adult trauma patients in an Australian health service. Does trauma centre level make a difference? World J Surg. 2011;35(10):2332–2340. doi: 10.1007/s00268-011-1217-1. [DOI] [PubMed] [Google Scholar]
- 10.Cameron C, Purdie D, Kliewer E, McClure R. Long-term mortality following trauma: 10 year follow-up in a population-based sample of injured adults. J Trauma. 2005;59(3):639–646. [PubMed] [Google Scholar]
- 11.Klop C, Welsing P, Cooper C, Harvey N, Elders P, Bijlsma J, Leufkens H, de Vries F. Mortality in British hip fracture patients, 2000–2010: A population-based retrospective cohort study. Bone. 2014;66:171–177. doi: 10.1016/j.bone.2014.06.011. [DOI] [PubMed] [Google Scholar]
- 12.Duke J, Boyd J, Rea S, Randall S, Wood F. Long-term mortality among older adults with burn injury: a population-based study in Australia. Bull World Health Organ. 2015;93:400–406. doi: 10.2471/BLT.14.149146. [DOI] [PMC free article] [PubMed] [Google Scholar]
- 13.Mitchell R, Cameron C, McClure R. Quantifying the morbidity and mortality attributable to traumatic injury using a population-based matched cohort in Australia. BMJ Open. 2016;6:e013266. doi: 10.1136/bmjopen-2016-013266. [DOI] [PMC free article] [PubMed] [Google Scholar]
- 14.National Centre for Classification in Health . ICD-10-AM. 5. Sydney: National Centre for Classification in Health; 2006. [Google Scholar]
- 15.Quan H, Li B, Couris C, Fushimi K, Graham P, Hider P, Januel J, Sundararajan V. Updating and validating the Charlson Comorbidity Index and score for risk adjustment in hospital discharge abstracts using data from 6 countries. Am J Epidemiol. 2011;173(6):676–682. doi: 10.1093/aje/kwq433. [DOI] [PubMed] [Google Scholar]
- 16.Miller T, Lestina D, Smith GS. Injury risk among medically identified alcohol and drug abusers. Alcohol Clin Exp Res. 2001;25(1):54–59. doi: 10.1111/j.1530-0277.2001.tb02127.x. [DOI] [PubMed] [Google Scholar]
- 17.Wan J, Morabito D, Khaw L, Knudson M, Dicker R. Mental illness as an independent risk factor for unintentional injury and injury recidivism. J Trauma Acute Care Surg. 2006;61(6):1299–1304. doi: 10.1097/01.ta.0000240460.35245.1a. [DOI] [PubMed] [Google Scholar]
- 18.Australian Bureau of Statistics. 1270.0.55.005 - Australian Statistical Geography Standard (ASGS): Volume 5 - Remoteness Structure, July 2011. 2013 23/07/2014 [cited 2014 03/09/2014]; Available from: http://www.abs.gov.au/AUSSTATS/abs@.nsf/DetailsPage/1270.0.55.005July%202011?OpenDocument. Accessed 31 Jan 2017.
- 19.Stephenson S, Henley G, Harrison J, Langley J. Diagnosis-based Injury Severity Scaling. Adelaide: AIHW; 2003. [DOI] [PMC free article] [PubMed] [Google Scholar]
- 20.Dayal S, Wren J, Wright C. Mapping injury severity scores against hospitalisation day stays for injury priority areas (excluding workplace injury) Wellington: Public Health Intelligence, Health and Disability Systems Strategy Directorate, Ministry of Health; 2008. [Google Scholar]
- 21.SAS Institute . SAS: statistical software, version 9.4. Cary: SAS Institute; 2014. [Google Scholar]
- 22.Allison P. Survival analysis using SAS. A practical guide. 2. Cary: SAS Institute Inc; 2010. [Google Scholar]
- 23.Pearce N. Analysis of matched case-control studies. BMJ. 2016;352:i969. doi: 10.1136/bmj.i969. [DOI] [PMC free article] [PubMed] [Google Scholar]
- 24.Woodward M. Epidemiology: Study Design and Analysis. 2. Boca Raton: Chapman & Hall CRC; 2005. [Google Scholar]
- 25.Haagsma J, Global Burden of Disease study collaborators The global burden of injury: incidence, mortality, disability-adjusted life years and time trends from the Global Burden of Disease study 2013. Injury Prevention. 2016;22:3–18. doi: 10.1136/injuryprev-2015-041616. [DOI] [PMC free article] [PubMed] [Google Scholar]
- 26.Shafi S, Renfro L, Barnes S, Rayan N, Gentilello L, Fleming N, Ballard D. Chronic consequences of acute injuries: Worse survival after discharge. J Trauma Acute Care Surg. 2012;73(3):699–703. doi: 10.1097/TA.0b013e318253b5db. [DOI] [PubMed] [Google Scholar]
- 27.Perdue P, Watts D, Kaufmann C, Trask A. Differences in Mortality between Elderly and Younger Adult Trauma Patients: Geriatric Status Increases Risk of Delayed Death. J Trauma Acute Care. 1998;45(4):805–810. doi: 10.1097/00005373-199810000-00034. [DOI] [PubMed] [Google Scholar]
- 28.Davidson G, Hamlat C, Rivara F, Koepsell T, Jurkovich G, Arbabi S. Long-term survival of adult trauma patients. JAMA. 2011;305(10):1001–1007. doi: 10.1001/jama.2011.259. [DOI] [PubMed] [Google Scholar]
- 29.Baguley I, Slewa-Younan S, Lazarus R, Green A. Long-term mortality trends in patients with traumatic brain injury. Brain Inj. 2000;14(6):505–512. doi: 10.1080/026990500120420. [DOI] [PubMed] [Google Scholar]
- 30.McMillan T, Teasdate G, Weir C, Stewart E. Death after head injury: the 13 year outcome of a case control study. J Neurol Neurosurg Psychiatry. 2011;82:931–935. doi: 10.1136/jnnp.2010.222232. [DOI] [PubMed] [Google Scholar]
- 31.Kreisfeld R, Harrison J. Injury technical paper series no 9. Canberra: AIHW; 2007. Use of multiple causes of death data for identifying and reporting injury mortality. [Google Scholar]
- 32.Cryer C, Gulliver P, Langley J, Davie G, Samaranayaka A, Fowler C. A proporsed theoretical definition to address the undercounting of injury deaths. Inj Prev. 2011;17(4):219–221. doi: 10.1136/injuryprev-2011-040039. [DOI] [PubMed] [Google Scholar]
- 33.Bhalla K, Harrison J. Burden calculator: a simple and open analytical tool for estimating the population burden of injuries. Inj Prev. 2016;22:i23–i26. doi: 10.1136/injuryprev-2015-041816. [DOI] [PubMed] [Google Scholar]
- 34.Australian Institute of Health and Welfare . Admitted patient care 2013-14. Canberra: Australian Institute of Health and Welfare; 2015. [Google Scholar]
- 35.Cryer C, Langley J. Developing valid indicators of injury incidence for “all injury”. Inj Prev. 2006;12:202–207. doi: 10.1136/ip.2006.011635. [DOI] [PMC free article] [PubMed] [Google Scholar]
- 36.Mitchell R, Cameron C, Bambach M. Data linkage for injury surveillance and research in Australia: perils, pitfalls and potential. Aust N Z J Public Health. 2014;38(3):276–281. doi: 10.1111/1753-6405.12234. [DOI] [PubMed] [Google Scholar]
- 37.Preen D, Holman CD, Spilsbury K, Semmens J, Brameld K. Length of comorbidity lookback period affected regression model performance of administrative health data. J Clin Epidemiol. 2006;59(9):940–946. doi: 10.1016/j.jclinepi.2005.12.013. [DOI] [PubMed] [Google Scholar]