Abstract
In the mouse fibroblast cell line C3H 10T1/2 and the chicken fibroblast cell line DF1, the ganglioside GM3 is the major glycosphingolipid component of the plasma membrane. Expression of the viral oncoprotein Jun (v-Jun) induces transformed cell clones with greatly reduced levels of GM3 and GM3 synthase (lactosylceramide α2,3-sialyltransferase) mRNA in both 10T1/2 and DF1 cell cultures. Compared with nontransformed controls, v-Jun transfectants show enhanced ability of anchorage-independent growth, and their growth rates as adherent cells are increased. When the mouse GM3 synthase gene is transfected with the pcDNA vector into v-Jun-transformed 10T1/2 cells, the levels of GM3 synthase and corresponding mRNA are restored to those of control cells. Reexpression of GM3 correlates with a reduced ability of the cells to form colonies in nutrient agar. Similarly, when the newly cloned chicken GM3 synthase gene is transfected into v-Jun-transformed DF1 with the pcDNA vector, the GM3 synthase level is restored to that of control cells, and the ability of the cells to form agar colonies is reduced. The levels of GM3 in the cell also affect membrane microdomains. The complex of GM3 with tetraspanin CD9 and integrin α5β1 inhibits motility and invasiveness. The amounts of this complex are greatly reduced in transformed cells. Expression of GM3 and consequent reversion of the transformed phenotype results in increased levels of that microdomain complex.
Keywords: ganglioside-enriched microdomain, tetraspanin, integrin, anchorage-independent
The viral oncoprotein Jun (v-Jun) induces transformation in cultures of avian and mammalian cells (1). v-Jun was originally discovered as the oncogenic effector protein encoded by the avian retrovirus ASV17 (2, 3). Its cellular counterpart, c-Jun, is a component of the activating protein 1 (AP-1) transcription factor complex (4, 5). v-Jun is a constitutively active mutant of c-Jun and demonstrates the oncogenic potential inherent in transcriptional dysregulation (1, 2, 6-8). Expression of v-Jun by ASV17, by the avian retroviral vector RCAS, or by the mammalian retroviral vector pBabe induces oncogenic transformation in the continuous chicken cell line DF1 and in the murine fibroblast line 10T1/2 (9, 10). Recent studies have identified differentially expressed genes and their functions in these Jun-transformed cells (reviewed in ref. 1).
Glycosphingolipids, particularly gangliosides, undergo characteristic changes during oncogenic transformation (for review see ref. 11). Studies on chicken embryo fibroblasts transformed by Rous sarcoma virus (12), or by a temperature-sensitive mutant of this virus (13), showed that the reduction of the ganglioside GM3 is closely associated with the transformed phenotype. The functional significance of GM3 in this process, however, is unknown. Glycosphingolipids, particularly GM3, modulate receptors of growth factors (14, 15), insulin (16-18), and integrins, with or without tetraspanin complex (19-21). When complexed with integrin and tetraspanin (20, 22), or with signal transducers (e.g., RhoA and Src family kinases), GM3 forms a microdomain that controls cell adhesion coupled with signal transduction (22-26). The GM3-enriched microdomain (GEM) is not disrupted by cholesterol-binding reagents, is involved in GM3-dependent cell adhesion (23, 26), and can be separated from other microdomains by application of anti-GM3 Ab (25).
We have studied changes of GM3 synthesis in v-Jun-transformed 10T1/2 and DF1 cells, and determined the effect of GM3 expression on the transformed cellular phenotype, finding that enhanced GM3 synthesis attenuates the oncogenic properties of the cell. This reversion to nearly normal phenotype is correlated with changes in the GM3/CD9/integrin complex.
Materials and Methods
Cells and Cell Culture. Mouse C3H fibroblast 10T1/2 cells were transformed with v-Jun by using two different methods. The first method consisted of high-multiplicity transfection with the v-Jun-expressing pBabe vector. This process resulted in the isolation of transformed cell clones referred to as 10T1/2 pBabe v-Jun (10). The second method involved the use of a subline of 10T1/2 that expressed the cell-surface receptor TVA, which is specific for subgroup A avian retroviruses. These cells were transformed by infection with the Jun-expressing avian retrovirus ASV17 and are referred to as 10T1/2 ASV17. Both of these methods yielded several clones of Jun-transformed cells. For Jun-induced transformation of avian cells, we used the continuous chicken embryo fibroblast cell line DF1 (9, 27), which was infected with ASV17. These clones were termed DF1 v-Jun. The cell line 10T1/2 and its transformants were grown in DMEM/high-glucose medium supplemented with 10% FCS/1 mM sodium pyruvate/penicillin/streptomycin. Mouse GM3 synthase (lactosylceramide α2,3-sialyltransferase) transfectant clones of 10T1/2 cells were maintained in the same medium containing 1.0 mg/ml geneticin (Invitrogen/GIBCO, Grand Island, NY).
DF1 and DF1 v-Jun cells were grown in Ham's F-10 medium supplemented with 10% FCS/L-glutamine/penicillin/streptomycin. Chicken GM3 synthase gene transfectant clones of DF1 and DF1 v-Jun were maintained in cloning medium [Ham's F-10 medium supplemented with 13% FCS/5% chicken serum/vitamin solution (1×, Sigma)/0.08% wt/vol folic acid solution/1% L-glutamine/penicillin/streptomycin solution/0.5% DMSO], containing 0.8 mg/ml geneticin.
GM3 Synthase Gene. The mouse GM3 synthase gene (28) was donated by S. Tsuji (Institute of Physical and Chemical Research, Wako, Japan). The chicken GM3 synthase gene was cloned in our laboratory (M.K., Y.M., K. Handa, D. A. Withers, C. A. Carney, and S.H.; GenBank accession no. AY515255).
Growth Assay (Toluidine Blue Uptake Assay). 10T1/2 cells. Cells were inoculated in 12-well plates (Nunc; well diameter, 22 mm) at a density of 0.5 × 10⁴ cells per well and cultured for 2, 24, 48, or 96 h. Cells were then washed with PBS, fixed with 3.7% paraformaldehyde in PBS for 2 h, stained with 0.1% Toluidine blue O solution for 30 min, washed four times with PBS, and lysed with 10% acetic acid, and incorporated dyes were solubilized. Absorbance was measured at 630 nm, and relative cell growth rates were calculated as percentage of corresponding control value (values at 2 h).
DF1 cells. Cells were inoculated in 12-well plates as above at a density of 2 × 10⁴ cells per well, cultured for 2, 24, 48, or 120 h, and processed as described above, and growth rates were calculated.
Extraction, Separation, and TLC Determination of Ganglioside from Cells.Gangliosides were extracted by standard isopropyl alcohol/hexane/water procedure (29). The extracts were combined and evaporated to dryness. The dried material was resuspended in water, added with six volumes of chloroform/methanol (2:1 by volume), and partitioned according to the Folch procedure. The upper phases, containing gangliosides, were combined and evaporated. This fraction was dissolved in water/methanol/chloroform (10:5:0.2 by volume) and loaded onto a C18 column preequilibrated with this solvent. The columns were washed three times with the same solvent to elute nonganglioside components. Each ganglioside fraction was eluted with chloroform/methanol (2:1 by volume) and evaporated. These ganglioside fractions were isolated from equal numbers (e.g., 5 × 10⁶) of cells as above. Fractions were dissolved in equal volumes of chloroform/methanol (2:1; e.g., 100 μl). From this solution, equal aliquots (10 μl) were placed for each lane of high-performance TLC plates (Merck) and developed with chloroform/methanol/0.2% CaCl2 aqueous solution (50:40:10 by volume). One plate was developed by orcinol/sulfuric acid staining. A duplicate plate was developed by immunostaining with anti-GM3 IgG3 mAb DH2 (30) followed by horseradish peroxidaseconjugated secondary Ab using a SuperSignal chemiluminescence kit (Pierce).
RT-PCR for GM3 Synthase Gene. Total RNAs were prepared from confluent cultures of 10T1/2 and DF1 cells, by using an Ultraspec RNA isolation kit (Biotecx Laboratories, Houston). Total RNAs were prepared and used as templates for RT-PCR with oligo(dT)10 primer. The use of total RNA for RT-PCR is thought to give better quantitative results than use of mRNA because the extraction efficiency of mRNA from total RNA varies between samples, causing inaccuracy of the assay. PCR was performed by standard procedure, using mouse (m) (for 10T1/2 cells) (mGM3 synthase 275F, 5′-GCACGTTGGTTGCATTTGGAG-3′, and mGM3 synthase 1048R, 5′-GAGGCTCTGAGTACTGAAGGA-3′) and chicken (c) (for DF1 cells) (cGM3 synthase 15F, 5′-TTTTTAAAAGGTACTCGCAA-3′, and cGM3 synthase 11R, 5′-CGCGATCAAAGTCCACATACG-3′) GM3 synthase primers; and β-actin mouse (m) (mβ-actin F, 5′-GTGGGCCGCCCTAGGCACCA-3′, and mβ-actin R, 5′-CTCTTTGATGTCACGCACGATTTC-3′) and chicken (c) (cβ-actin F, 5′-GTGGGTCGCCCCAGACATCA-3′, and cβ-actin R, 5′-CTCCTTGATGTCACGCACAATTTC-3′) primers.
Stable GM3 Synthase Transfectants. Cells were placed on 12-well plates at a density of 0.5 × 10⁵ cells per well and cultured for 24 h. Vector control (pcDNA, 3 μg) and mouse or chicken GM3 synthase (pcDNA/GM3 synthase, 3 μg) were transfected into cells by using FuGENE6 (Roche Diagnostics, Indianapolis). Cells were cultured for 48 h, trypsinized, and placed in medium containing 1.0 mg/ml (for 10T1/2) or 0.8 mg/ml geneticin (for DF1). Transfectants were selected by the limiting dilution method and several clones were isolated. These clones were measured for GM3 synthase mRNA and GM3 content and each was used for growth assay and soft agar colony forming assay.
Assays for Agar Colony Formation. The ability of cells to grow in soft nutrient agar suspension was tested according to published techniques (9, 10, 31). Colonies were counted after 4 weeks of incubation, and values are represented as mean ± SEM for three wells.
Postnuclear Fraction and Coimmunoprecipitation (Co-IP). Postnuclear fractions were prepared as described previously, by using Brij98 (21) rather than Triton X-100 (26, 32). Briefly, ≈107 cells were suspended in 1 ml of lysis buffer (1% Brij98/25 mM Hepes buffer, pH 7.5/150 mM NaCl/5 mM EDTA) containing 75 units of aprotinin and 2 mM PMSF, homogenized with a Dounce homogenizer, and centrifuged to eliminate nuclear and cytoskeletal components. The resulting fraction contained various microdomains from the plasma membrane. Interactions among CD9, α5-, and β1-integrin were analyzed as described (21) by using anti-mouse CD9 rat mAb (Santa Cruz Biotechnology, catalog no. sc-18869), anti-human integrin α5 rabbit polyclonal Ab (Chemicon, catalog no. AB1949), and anti-mouse β1-subunit of very-late activation antigen (VLA) (β1)-integrin rat mAb (Chemicon, catalog no. MAB1997).
Interaction of Membrane Components Studied by Laser-Scanning Confocal Microscopy. The effect of GM3 levels on the interaction of β1-integrin with CD9 was studied as described (21). Briefly, cells grown on coverslips were incubated with combinations of Abs as follows. For α5/CD9 combination staining, primary antibodies were rabbit anti-α5 polyclonal Ab (Chemicon) and rat anti-mouse CD9 mAb (Santa Cruz Biotechnology); and secondary Abs were Cy2-conjugated donkey anti-rabbit IgG (Jackson ImmunoResearch) and Texas red-conjugated goat anti-rat IgG (Molecular Probes). For β1/CD9 combination staining, primary Abs were rat anti-mouse β1, mAb (Chemicon) and rat anti-mouse CD9 mAb (Santa Cruz Biotechnology); and secondary Abs were Alexa Fluor 488-conjugated goat anti-rabbit IgG and Texas red-conjugated goat anti-rat IgG. For each staining, cells were incubated with primary Ab at room temperature for 1 h, washed three times with PBS, incubated with secondary Ab in the dark for 1 h, and washed three times with PBS. Patterns of fluorescence were observed by laser-scanning confocal microscopy (Zeiss LSM 510).
Results
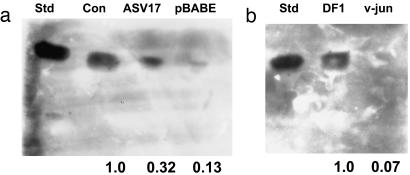
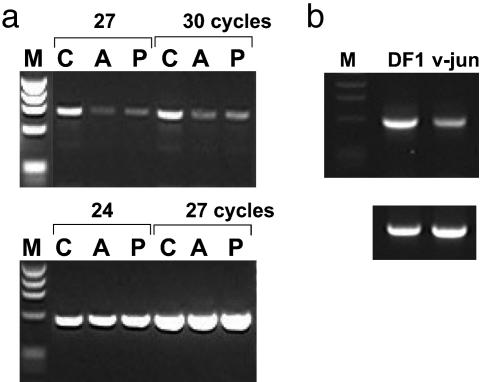
GM3 Is Down-Regulated in v-Jun-Transformed Murine and Avian Cells. Two different methods were used for transformation of mouse 10T1/2 cells with v-Jun, as described in Materials and Methods. We also transformed avian cells with v-Jun by using continuous chicken embryo fibroblast cell line DF1 (9) infected with ASV17. v-Jun-transformed 10T1/2 and DF1 cells showed increased growth rates relative to the nontransformed parental cells (data not shown). Levels of GM3 were determined by TLC immunostaining (Fig. 1). mRNA expression of the mouse GM3 synthase gene (GenBank accession no.Y15003) and of the chicken GM3 synthase gene (GenBank accession no. AY515255) was measured by semiquantitative RT-PCR using the β-actin gene expression as a standard (Figs. 2 and 3). GM3 levels were significantly reduced in all Jun-transformed murine and avian cell clones. The levels of GM3 synthase mRNA were also down-regulated in Jun-transformed cells. These results suggest that transformation by Jun, similar to transformation by Src, interferes with the synthesis of important cellular glycolipids.
Fig. 1.
Transformation by v-Jun decreases GM3 content in mouse and chicken embryonic fibroblasts. Immunostaining of TLC-separated gangliosides extracted from control and v-Jun-transformed fibroblasts with anti-GM3 mAb DH2. Equal numbers of cells were extracted, and aliquots of equal amounts of extract were used for analysis (see Materials and Methods). (a) Std, purified GM3 as standard; Con, 10T1/2 control; ASV17, 10T1/2 ASV17 v-Jun; pBabe, 10T1/2 pBabe v-Jun. (b) v-jun, DF1 v-Jun. Numbers under lanes refer to densitometric measurement, i.e., amount of ganglioside in extracts, relative to Con (defined as 1.0 in a) or DF1 (defined as 1.0 in b).
Fig. 2.
Transformation by v-Jun decreases GM3 synthase level in mouse and chicken fibroblasts. (a) RT-PCR of murine (Mu) GM3 synthase (Upper) and β-actin (Lower) mRNA in control and v-Jun-transformed 10T1/2 cells. M, DNA marker; C, 10T1/2 control; A, 10T1/2 ASV17 v-Jun; P, 10T1/2 pBabe v-Jun. (b) RT-PCR of chicken (Ch) GM3 synthase (Upper) and β-actin (Lower) mRNA in control and v-Jun-transformed DF1 cells.
Fig. 3.
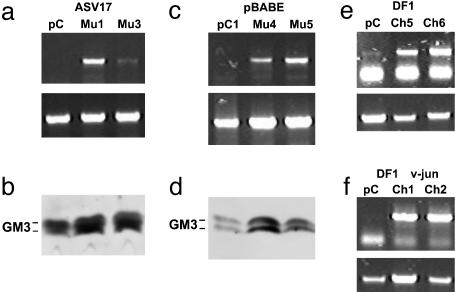
Transfection of GM3 synthase gene into mouse and chicken fibroblasts restores GM3 mRNA and GM3 content. (a and b) 10T1/2 ASV17 v-Jun cells. (a) RT-PCR of murine (Mu) GM3 synthase (Upper) and β-actin (Lower) mRNAs in 10T1/2 ASV17 v-Jun clones transfected with GM3 synthase. (b) Immunostaining of TLC-separated gangliosides extracted from 10T1/2 ASV17 v-Jun clones with mAb DH2. pC, 10T1/2 ASV17 v-Jun/pcDNA; Mu1, 10T1/2 ASV17 v-Jun/GM3 synthase clone 1; Mu3, 10T1/2 ASV17 v-Jun/GM3 synthase clone 3. (c and d) 10T1/2 pBabe v-Jun cells. (c) RT-PCR of Mu GM3 synthase (Upper) and β-actin (Lower) mRNAs in 10T1/2 pBabe v-Jun clones transfected with GM3 synthase clones 4 and 5. (d) Immunostaining of TLC-separated gangliosides extracted from 10T1/2 pBabe v-Jun clones with DH2. pC1, 10T1/2 pBabe v-Jun/pcDNA; Mu4, 10T1/2 pBabe v-Jun/Mu GM3 synthase clone 4; Mu5, 10T1/2 pBabe v-Jun/Mu GM3 synthase clone 5. (e and f) Chicken GM3 synthase (Upper) and β-actin (Lower). (e) DF1 cells. pC, DF1/pcDNA; Ch5, DF1/chicken (Ch) GM3 synthase clone 5; Ch6, DF1/GM3 synthase clone 6. (f) DF1 v-Jun cells. Ch1, DF1 v-Jun/Ch GM3 synthase clone 1; Ch2, DF1 v-Jun/Ch GM3 synthase clone 2. Lanes showing DNA markers are omitted.
Restoration of GM3 and of GM3 Synthase in Jun-Transformed Cells. Jun-transformed 10T1/2 cell clones (10T1/2 pBabe v-Jun and 10T1/2 ASV17) and nontransformed 10T1/2 cells were transfected with mouse GM3 synthase gene expression plasmid. Stable transfectants were selected with geneticin (1.0 mg/ml). Similarly, chicken DF1 ASV17 cells and nontransformed controls were transfected with expression plasmid encoding the chicken GM3 synthase gene. Stable transfectants were obtained by geneticin selection. All murine and avian cell clones transfected with the GM3 synthase gene showed significantly elevated levels of GM3 synthase mRNA as compared with nontransfected controls (Fig. 3 a, c, e, and f). GM3 concentrations in these cells as determined by TLC immunostaining were also increased (Fig. 3 b and d). Jun-transformed clones transfected with GM3 showed different levels of GM3 synthase mRNA. However, in all these clones, GM3 synthase levels were significantly higher than those detected in nontransfected v-Jun transformants, and reached or exceeded GM3 synthase mRNA levels seen in untransformed 10T1/2 or DF1 cells.
The levels of v-Jun expressed in v-Jun transformants (10T1/2 pBabe v-Jun), and that in their GM3 transfectant clones 4 and 5, were essentially the same in two independent determinations (data not shown). This result indicates that a change of GM3 level produces phenotypic reversion independent of v-Jun expression.
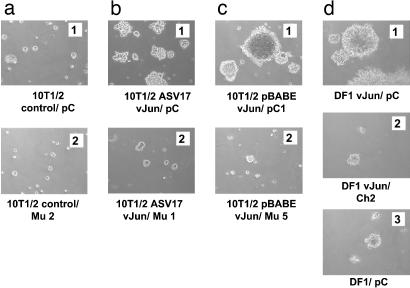
Restored Levels of GM3 Synthase Reduce Anchorage-Independent Growth of v-Jun-Transformed Mammalian and Avian Cells. v-Jun-transformed 10T1/2 cells, their GM3-transfected derivative clones, and appropriate controls were tested for the ability to grow in nutrient agar (Table 1). Nontransformed 10T1/2 cells formed colonies in agar with an efficiency of ≈1%. Transformation by v-Jun increased agar colony formation to an efficiency of >20%. Transfection of the GM3 synthase gene into v-Jun-transformed 10T1/2 cells reduced their ability to grow in agar. This reduction was more pronounced for 10T1/2 ASV17 v-Jun than for 101/2 pBabe v-Jun cells, but it was highly significant for both cell types. Colony size in the GM3 synthase transformants was also greatly reduced (Fig. 4 a-c).
Table 1. Effect of murine GM3 synthase (Mu GM3 Syn) transfection on anchorage-independent growth of v-Jun-transformed 10T1/2 cells.
| Cells | No. of colonies | Cloning efficiency* |
|---|---|---|
| 10T1/2 control/pcDNA | 220 ± 26 | 1.1 ± 0.1 |
| 10T1/2 control/Mu GM3 Syn | ||
| Clone 2 | 178 ± 38 | 0.9 ± 0.2 |
| Clone 10 | 64 ± 12† | 0.3 ± 0.1† |
| 10T1/2 ASV17 v-Jun/pcDNA | 4,764 ± 456‡ | 23.8 ± 2.3‡ |
| 10T1/2 ASV17 v-Jun/Mu GM3 Syn | ||
| Clone 1 | 1,429 ± 236† | 7.1 ± 1.2† |
| Clone 3 | 1,700 ± 364† | 8.5 ± 1.8† |
| Clone 8 | 1,131 ± 209† | 5.7 ± 1.0† |
| Clone 9 | 1,735 ± 212† | 8.7 ± 1.1† |
| 10T1/2 pBabe v-Jun/pcDNA | 3,179 ± 428‡ | 21.2 ± 2.9‡ |
| 10T1/2 pBabe v-Jun/Mu GM3 Syn | ||
| Clone 4 | 164 ± 56† | 1.1 ± 0.4† |
| Clone 5 | 100 ± 26† | 0.7 ± 0.2† |
| Clone 6 | 498 ± 51† | 3.3 ± 0.3† |
| Clone 8 | 242 ± 84† | 1.6 ± 0.6† |
Percentage of cells forming colonies after 4 weeks.
Significantly different from each corresponding pcDNA control at P<0.01 by Dunnet multiple comparison test.
Significantly different from 10T1/2 control/pcDNA at P<0.01 by Dunnett's multiple comparison test.
Fig. 4.
Agar colony formation of v-Jun-transformed mouse and chicken fibroblasts, and effect of GM3 synthase transfection. (a1 and a2) 10T1/2 control without (pC) and with (Mu2) mouse GM3 synthase. (b1 and b2) 10T1/2 ASV17 v-Jun without (pC) and with (Mu1) mouse GM3 synthase. (c1 and c2) 10T1/2 pBabe v-Jun without (pC1) and with (Mu5) mouse GM3 synthase. (d1 and d2) DF1 v-Jun without (pC) and with (Ch2) chicken GM3 synthase. (d3) DF1 without chicken GM3 synthase (pC).
The v-Jun-transformed DF1 cells and their derivative clones transfected with the chicken GM3 synthase gene were similarly tested for their ability to grow in nutrient agar (Table 2). Transformation by v-Jun increased the colony-forming efficiency of DF1 in agar ≈5-fold. Transfection of the chicken GM3 synthase gene reduced this cloning efficiency to nearly control levels. GM3 synthase transfection also decreased the colony size to that of uninfected DF1 (Fig. 4d). Untransformed DF1 cells produced small agar colonies (Fig. 4d), and their colony-forming efficiency in agar was not significantly affected by GM3 transfection (data not shown).
Table 2. Effect of chicken GM3 synthase (Ch GM3 Syn) transfection on anchorage-independent growth of v-Jun-transformed DF1 cells.
| Cells | No. of colonies | Cloning efficiency* |
|---|---|---|
| DF1 | 363 ± 33 | 2.4 ± 0.2 |
| DF1/v-Jun | 1,984 ± 246† | 13.2 ± 1.6† |
| DF1 clones | ||
| DF1/pcDNA | 434 ± 28 | 2.9 ± 0.2 |
| DF1/Ch GM3 Syn | ||
| Clone 5 | 391 ± 26 | 2.6 ± 0.2 |
| Clone 6 | 228 ± 26 | 1.5 ± 0.2 |
| DF1/v-Jun clones | ||
| DF1/v-Jun/pcDNA | 2,517 ± 149† | 16.8 ± 1.0† |
| DF1/v-Jun/Ch GM3 Syn | ||
| Clone 1 | 334 ± 75 | 2.2 ± 0.5 |
| Clone 2 | 242 ± 28 | 1.6 ± 0.2 |
| Clone 3 | 548 ± 62 | 3.7 ± 0.4 |
| Clone 4 | 882 ± 105† | 5.9 ± 0.7† |
Percentage of cells forming colonies after 3 weeks.
Significantly different from DF1 at P<0.01 by Dunnett's multiple comparison test.
Presence of CD9 and α5β1-Integrin and Enhanced Level of GM3/CD9/α5 Complex in 10T1/2 Cells. In various colorectal cancer cell lines, GM3 was found to interact with CD9 (20) and to mediate the formation of a complex between CD9 and integrin receptors. This complex inhibits integrin-dependent cell motility in cancer cell lines and in hamster ldlD cells expressing CD9 (20, 21). We detected the formation of this complex by co-IP and confocal microscopy in the 10T1/2 clones described above.
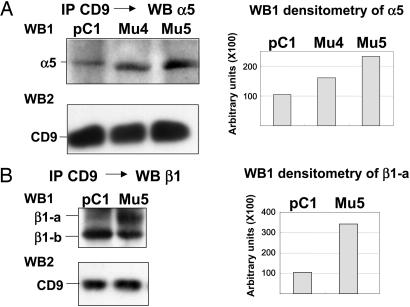
Transformation by Jun did not significantly change the level of CD9 (data not shown). The levels of α5 coimmunoprecipitated with anti-CD9 increased significantly in the GM3 synthase transfectants of 10T1/2 pBabe v-Jun as compared with control nontransfected cells treated with vector alone. IP of CD9 followed by Western blotting of CD9 did not show a significant difference in band intensity in the transfectant compared with control cells (Fig. 5A). β1-integrin showed two bands: β1-a, corresponding to N-glycosylated β1; and β1-b, corresponding to non- or less-glycosylated β1. The level of β1-a increased significantly upon GM3 synthase transfection, whereas β1-b was essentially unchanged. The CD9 band was the same in control cells and GM3 synthase gene transfectants (Fig. 5B).
Fig. 5.
Co-IP of CD9 and α5β1-integrin in 10T1/2 control and pBabe v-Jun clones. (A) Co-IP of α5 with CD9, performed on postnuclear fraction with anti-CD9, followed by Western blot with anti-α5 (WB1), or with anti-CD9 (WB2). pC1, 10T1/2 pBabe v-Jun/pcDNA; Mu4, 10T1/2 pBabe v-Jun/GM3 synthase clone 4; Mu5, 10T1/2 pBabe v-Jun/GM3 synthase clone 5. (Right) Scion (Frederick, MD) image densitometric analysis of lanes 1, 2, and 3 of WB1. (B) Co-IP of β1 with CD9, performed on postnuclear fraction with anti-CD9, followed by Western blot with anti-β1 (WB1), or with anti-CD9 (WB2). Note that the co-IP pattern of β1 (WB1) shows two bands: β1-a (highly N-glycosylated band) and β1-b (less N-glycosylated band), confirmed by N-glycanase treatment. (Right) Level of β1-a by co-IP is higher in pBabe Mu5 cells than in control, as shown by Scion densitometric analysis.
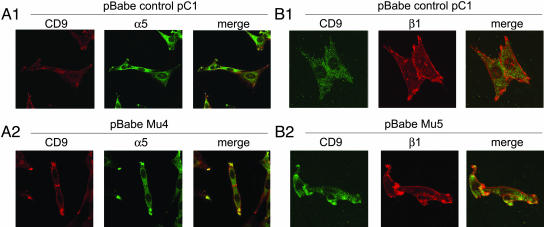
The association of CD9 with α5-integrin (Fig. 6A), or with β1-integrin (Fig. 6B), in 10T1/2 pBabe v-Jun GM3 transfectant clone 4 or clone 5 (Mu4 or Mu5), was confirmed by merge images in confocal microscopy, particularly at cell-adhesion sites. Similar merged images were not clearly observed in 10T1/2 pBabe v-Jun without GM3 transfection (control pC1).
Fig. 6.
Association of CD9 with α5- and β1-integrin, shown by laser-scanning confocal microscopy. (A1) 10T1/2 pBabe v-Jun with pcDNA vector (control pC1) without GM3. (A2) 10T1/2 pBabe v-Jun GM3 synthase transfectant clone 4 (Mu4). (B1) 10T1/2 pBabe v-Jun with pcDNA vector (control pC1) without GM3. (B2) 10T1/2 pBabe v-Jun GM3 synthase transfectant clone 5 (Mu5). CD9, α5, and β1 at the top of each image indicate staining for CD9, α5, or β1, respectively. Merge indicates merge image with combination of CD9 with α5, or CD9 with β1. Antibodies used are described in Materials and Methods.
Discussion
Jun is a bZip protein and functions as a component of the activating protein 1 (AP-1) transcription factor complex (1, 4-6). v-Jun, the oncoprotein of the avian retrovirus ASV17, is constitutively active and induces oncogenic transformation in cell culture and tumor growth in vivo (2, 7, 8). Jun-dependent oncogenicity is mediated through aberrant transcriptional controls (1). Numerous genes have been identified that are differentially expressed in Jun-transformed avian and mammalian cells (1, 33). However, the functions of these over- or underexpressed genes in the transformation process have not been precisely determined. Several genes that are down-regulated in Jun-transformed cells induce the reversion of the transformed phenotype to a nearly normal state when they are reexpressed (10, 34). The down-regulation of these targets is therefore a necessary component of the transformation process but it is probably not sufficient to induce transformation.
Our previous studies suggest a correlation between oncogenic transformation and lowered cellular levels of the GM3 ganglioside. Chicken embryo fibroblasts transformed by Rous sarcoma virus, and baby hamster kidney cells transformed by polyoma virus, show suppression of GM3 (12, 13, 35). It is surprising that down-regulation of GM3 synthesis is associated with transformation controlled by different types of oncogenes.
The present study shows that the quantity of GM3 determined by TLC immunostaining and the level of GM3 synthase mRNA determined by RT-PCR are greatly reduced in v-Jun-transformed avian and mammalian cells. Restored expression of GM3 synthase in these Jun-transformed cells caused reversion of oncogenic to normal cellular phenotype as determined by anchorage-independent growth. However, such phenotypic reversion was not associated with change of v-Jun expression.
Reversion of the oncogenic phenotype can be induced by a change in the expression or function of a single or a few critical genes or factors. A few examples are as follows: (i) wild-type p53 can suppress the growth of human colorectal cancer cells that carry multiple mutations (36); (ii) expression of Akap12 or Marcks reverts v-Jun-transformed mammalian cells to nearly normal phenotype, but it does not affect the high levels of v-Jun in these cells (34); (iii) Ab against the β1-integrin receptor can induce mammary cancer cells in three-dimensional culture to form organized gland-like structures, and suppresses tumor growth in vivo (37, 38); (iv) the high motility of colorectal cancer cell lines is inhibited by exogenous addition of GM3 only when CD9 is highly expressed and complexed with α3β1 (20); and (v) highly invasive bladder cancer cell lines with high CD9 expression are converted to low-invasive phenotype by brefeldin-induced enhancement of endogenous GM3 synthesis (39). Examples iv and v suggest that a change in the organizational status of integrin, CD9, and GM3 in the GEM may affect the malignant phenotype. Example iii may also be related to integrin organization in the GEM.
Elevated levels of GM3, either endogenously synthesized or exogenously added, cause increased formation of complexes with integrin α3 and CD9 or integrin α5 and CD82 (20, 40). Such GM3 complexes inhibit tumor cell motility and invasiveness (20, 39-41). Our data show that integrin α5, GM3, and CD9 are present in the GEM fraction of 10T1/2 cells. The level of this complex in the postnuclear fraction decreased in v-Jun-transformed 10T1/2 cells and increased significantly during phenotypic reversion induced by transfected GM3 synthase.
The present findings of low levels of GM3 and GM3 synthase in Jun-transformed avian and mammalian cells, and reversion of these transformed cells by transfected GM3 synthase, suggest that down-regulation of GM3 is an essential feature of Jun-dependent oncogenesis. Cellular signals that are stimulated by elevated GM3 in the GEM require further study.
Acknowledgments
We thank Dr. Stephen Anderson (Pacific Northwest Research Institute) for preparation of figures and assisting with preparation of the text. Preliminary studies on v-Jun-induced ganglioside changes of chicken fibroblast DF1 were performed by Dr. Masaya Ono (National Cancer Center Research Institute, Tokyo) when he was in the laboratory of S.H. This is Scripps Research Institute manuscript no. 16831-MEM. This work was supported by National Cancer Institute, National Institutes of Health Grants R01 CA80054 (to S.H.) and R01 CA78230 and R01 CA79616 (to P.K.V.).
Author contributions: P.K.V. and S.H. designed research; Y.M., M.K., H.J., and H.V. performed research; Y.M., M.K., and H.V. contributed new reagents/analytic tools; Y.M., M.K., H.J., H.V., P.K.V., and S.H. analyzed data; Y.M., P.K.V., and S.H. wrote the paper; and M.K. cloned the chicken GM3 synthase gene.
Abbreviations: co-IP, coimmunoprecipitation; GM3, sialosyllactosylceramide; GEM, ganglioside (or GM3)-enriched microdomain; v-Jun, viral oncoprotein Jun.
Data deposition: The sequence reported in this paper has been deposited in the GenBank database (accession no. AY515255).
References
- 1.Vogt, P. K. (2001) Oncogene 20, 2365-2377. [DOI] [PubMed] [Google Scholar]
- 2.Maki, Y., Bos, T. J., Davis, C., Starbuck, M. & Vogt, P. K. (1987) Proc. Natl. Acad. Sci. USA 84, 2848-2852. [DOI] [PMC free article] [PubMed] [Google Scholar]
- 3.Vogt, P. K., Bos, T. J. & Doolittle, R. F. (1987) Proc. Natl. Acad. Sci. USA 84, 3316-3319. [DOI] [PMC free article] [PubMed] [Google Scholar]
- 4.Bohmann, D., Bos, T. J., Admon, A., Nishimura, T., Vogt, P. K. & Tjian, R. (1987) Science 238, 1386-1392. [DOI] [PubMed] [Google Scholar]
- 5.Angel, P., Allegretto, E. A., Okino, S. T., Hattori, K., Boyle, W. J., Hunter, T. & Karin, M. (1988) Nature 332, 166-171. [DOI] [PubMed] [Google Scholar]
- 6.Vogt, P. K. (2002) Nat. Rev. Cancer 2, 465-469. [DOI] [PubMed] [Google Scholar]
- 7.Black, E. J., Catling, A. D., Woodgett, J. R., Kilbey, A. & Gillespie, D. A. (1994) Oncogene 9, 2363-2368. [PubMed] [Google Scholar]
- 8.May, G. H., Funk, M., Black, E. J., Clark, W., Hussain, S., Woodgett, J. R. & Gillespie, D. A. (1998) Curr. Biol. 8, 117-120. [DOI] [PubMed] [Google Scholar]
- 9.Himly, M., Foster, D. N., Bottoli, I., Iacovoni, J. S. & Vogt, P. K. (1998) Virology 248, 295-304. [DOI] [PubMed] [Google Scholar]
- 10.Cohen, S. B., Waha, A., Gelman, I. H. & Vogt, P. K. (2001) Oncogene 20, 141-146. [DOI] [PubMed] [Google Scholar]
- 11.Hakomori, S. (1996) Cancer Res. 56, 5309-5318. [PubMed] [Google Scholar]
- 12.Hakomori, S., Saito, T. & Vogt, P. K. (1971) Virology 44, 609-621. [DOI] [PubMed] [Google Scholar]
- 13.Hakomori, S., Wyke, J. A. & Vogt, P. K. (1977) Virology 76, 485-493. [DOI] [PubMed] [Google Scholar]
- 14.Bremer, E. G., Hakomori, S., Bowen-Pope, D. F., Raines, E. W. & Ross, R. (1984) J. Biol. Chem. 259, 6818-6825. [PubMed] [Google Scholar]
- 15.Bremer, E. G., Schlessinger, J. & Hakomori, S. (1986) J. Biol. Chem. 261, 2434-2440. [PubMed] [Google Scholar]
- 16.Nojiri, H., Stroud, M. R. & Hakomori, S. (1991) J. Biol. Chem. 266, 4531-4537. [PubMed] [Google Scholar]
- 17.Tsuruoka, T., Tsuji, T., Nojiri, H., Holmes, E. H. & Hakomori, S. (1993) J. Biol. Chem. 268, 2211-2216. [PubMed] [Google Scholar]
- 18.Yamashita, T., Hashiramoto, A., Haluzik, M., Mizukami, H., Beck, S., Norton, A., Kono, M., Tsuji, S., Daniotti, J. L., Werth, N., et al. (2003) Proc. Natl. Acad. Sci. USA 100, 3445-3449. [DOI] [PMC free article] [PubMed] [Google Scholar]
- 19.Zheng, M., Fang, H., Tsuruoka, T., Tsuji, T., Sasaki, T. & Hakomori, S. (1993) J. Biol. Chem. 268, 2217-2222. [PubMed] [Google Scholar]
- 20.Ono, M., Handa, K., Sonnino, S., Withers, D. A., Nagai, H. & Hakomori, S. (2001) Biochemistry 40, 6414-6421. [DOI] [PubMed] [Google Scholar]
- 21.Kawakami, Y., Kawakami, K., Steelant, W. F. A., Ono, M., Baek, R. C., Handa, K., Withers, D. A. & Hakomori, S. (2002) J. Biol. Chem. 277, 34349-34358. [DOI] [PubMed] [Google Scholar]
- 22.Ono, M. & Hakomori, S. (2004) Glycoconj. J. 20, 71-78. [DOI] [PubMed] [Google Scholar]
- 23.Kojima, N. & Hakomori, S. (1991) J. Biol. Chem. 266, 17552-17558. [PubMed] [Google Scholar]
- 24.Kojima, N., Shiota, M., Sadahira, Y., Handa, K. & Hakomori, S. (1992) J. Biol. Chem. 267, 17264-17270. [PubMed] [Google Scholar]
- 25.Iwabuchi, K., Handa, K. & Hakomori, S. (1998) J. Biol. Chem. 273, 33766-33773. [DOI] [PubMed] [Google Scholar]
- 26.Iwabuchi, K., Yamamura, S., Prinetti, A., Handa, K. & Hakomori, S. (1998) J. Biol. Chem. 273, 9130-9138. [DOI] [PubMed] [Google Scholar]
- 27.Schaefer-Klein, J., Givol, I., Barsov, E. V., Whitcomb, J. M., VanBrocklin, M., Foster, D. N., Federspiel, M. J. & Hughes, S. H. (1998) Virology 248, 305-311. [DOI] [PubMed] [Google Scholar]
- 28.Kono, M., Takashima, S., Liu, H., Inoue, M., Kojima, N., Lee, Y. C., Hamamoto, T. & Tsuji, S. (1998) Biochem. Biophys. Res. Commun. 253, 170-175. [DOI] [PubMed] [Google Scholar]
- 29.Kannagi, R., Nudelman, E. D., Levery, S. B. & Hakomori, S. (1982) J. Biol. Chem. 257, 14865-14874. [PubMed] [Google Scholar]
- 30.Dohi, T., Nores, G. & Hakomori, S. (1988) Cancer Res. 48, 5680-5685. [PubMed] [Google Scholar]
- 31.Sonderegger, C. K. & Vogt, P. K. (2003) Oncogene 22, 1749-1757. [DOI] [PubMed] [Google Scholar]
- 32.Yamamura, S., Handa, K. & Hakomori, S. (1997) Biochem. Biophys. Res. Commun. 236, 218-222. [DOI] [PubMed] [Google Scholar]
- 33.Black, E. J., Clair, T., Delrow, J., Neiman, P. & Gillespie, D. A. (2004) Oncogene 23, 2357-2366. [DOI] [PubMed] [Google Scholar]
- 34.Iacovoni, J. S., Cohen, S. B., Berg, T. & Vogt, P. K. (2004) Oncogene 23, 5703-5706. [DOI] [PubMed] [Google Scholar]
- 35.Hakomori, S. & Murakami, W. T. (1968) Proc. Natl. Acad. Sci. USA 59, 254-261. [DOI] [PMC free article] [PubMed] [Google Scholar]
- 36.Baker, S. J., Markowitz, S., Fearon, E. R., Willson, J. K. & Vogelstein, B. (1990) Science 249, 912-915. [DOI] [PubMed] [Google Scholar]
- 37.Weaver, V. M., Petersen, O. W., Wang, F., Larabell, C. A., Briand, P., Damsky, C. & Bissell, M. J. (1997) J. Cell Biol. 137, 231-245. [DOI] [PMC free article] [PubMed] [Google Scholar]
- 38.Kenny, P. A. & Bissell, M. J. (2003) Int. J. Cancer 107, 688-695. [DOI] [PMC free article] [PubMed] [Google Scholar]
- 39.Satoh, M., Ito, A., Nojiri, H., Handa, K., Numahata, K., Ohyama, C., Saito, S., Hoshi, S. & Hakomori, S. (2001) Int. J. Oncol. 19, 723-731. [PubMed] [Google Scholar]
- 40.Ono, M., Handa, K., Withers, D. A. & Hakomori, S. (2000) Biochem. Biophys. Res. Commun. 279, 744-750. [DOI] [PubMed] [Google Scholar]
- 41.Ono, M., Handa, K., Withers, D. A. & Hakomori, S. (1999) Cancer Res. 59, 2335-2339. [PubMed] [Google Scholar]


