Abstract
Intrinsic optical signal (IOS) imaging is a promising noninvasive method for advanced study and diagnosis of eye diseases. Before pursuing clinical applications, more IOS studies employing animal models are necessary to establish the relationship between IOS distortions and eye diseases. Ample mouse models are available for investigating the relationship between IOS distortions and eye diseases. However, in vivo IOS imaging of mouse retinas is challenging due to the small ocular lens (compared to frog eyes) and inevitable eye movements. We report here in vivo IOS imaging of mouse retinas using a custom-designed functional OCT. The OCT system provided high resolution (3 μm) and high speed (up to 500 frames/s) imaging of mouse retinas. An animal holder equipped with a custom designed ear bar and bite bar was used to minimize eye movement due to breathing and heartbeats. Residual eye movement in OCT images was further compensated by accurate image registration. Dynamic OCT imaging revealed rapid IOSs from photoreceptor outer segments immediately (<10 ms) after the stimulation delivery, and unambiguous IOS changes were also observed from inner retinal layers with delayed time courses compared to that of photoreceptor IOSs.
Keywords: Intrinsic optical signal, functional imaging, optical coherence tomography, physiology, retina, eye
1. INTRODUCTION
Eye diseases, such as age related macular degeneration (AMD) 1 and retinitis pigmentosa (RP) 2 can produce retinal neural dysfunctions that can lead to total blindness if appropriate interventions are not employed in a timely manner. Different eye diseases damage different retinal cells, which are located in different functional layers. For example, it is known that rods are more vulnerable than cones in early stages of AMD 1. Electroretinography (ERG) 3 and multifocal ERG 4, 5 can provide objective evaluation of retinal function, but the spatial resolution is limited due to the integral measurement of bioelectric signals from multiple retinal layers. Furthermore, low signal selectivity due to the integral effects makes the ERG interpretation complicated for accurate diagnosis. Optical imaging methods, such as fundus photography and optical coherence tomography (OCT) 6, can provide high resolution examinations. However, morphological images do not directly provide functional information on retinal physiology. A high resolution method for objective evaluation of retinal physiological function is desirable for better disease detection and treatment evaluation.
Intrinsic optical signal (IOS) imaging promises a high resolution method for advanced study and diagnosis of eye diseases that can produce retinal neural dysfunctions 7. Stimulus-evoked IOSs have been observed in frog 8–18, chicken 19, 20, rat 21, rabbit 22, cat 23, monkey 24 and human 25 retinas. Recent OCT studies revealed rapid IOS changes at photoreceptor outer segments 17, 18. In vitro IOS imaging of normal and mutant mouse retinas has been conducted to demonstrate disease produced IOS distortions 26. Laser-injured frog eyes have been used to demonstrate in vivo IOS mapping of localized retinal dysfunction 16. Both in vitro and in vivo studies showed that fast IOSs had different polarities and were mainly originating from photoreceptor outer segments in frog retinas. These studies also revealed that fast IOSs had a rapid time course (less than 4 ms after onset of the light stimulus). We speculated that photoreceptor IOSs were tightly correlated to the visual phototransduction process, and positive and negative signals might reflect local changes of refractive indexes due to photoproducts of rhodopsin bleaching. Before pursuing clinical applications, better IOS studies using animal models is necessary to establish the relationship between IOS distortions and eye diseases. Ample mouse models are readily available for such studies, but in vivo mouse IOS imaging is difficult. The small mouse ocular lens (compared to frog eyes) and inevitable breath and heartbeat induced eye movements make in vivo IOS imaging challenging. The purpose of this study was to verify the feasibility of in vivo IOS imaging in mouse retinas using spectral domain OCT (SDOCT) and to develop tools for studying the relationship between IOS distortions and different eye diseases.
2. METHODS
2.1 Animal preparation
Adult wild type mice (strain C57BL/6J, The Jackson Laboratory) were used for this study. Before the experiment, each mouse was first dark adapted for 2 hours, and then was anesthetized with 60 mg/kg ketamine and 3 mg/kg xylazine given by intraperitoneal injection. After the mouse was fully anesthetized, it was transferred to the custom designed animal holder with the head fixed by an ear bar and bite bar. One drop of ophthalmic gel was applied to each eye to keep them from clouding. A cover glass was placed on the imaged eye ball. The cover glass along with the gel worked as a contact lens to improve image resolution by reducing optical aberrations of the mouse eye. During the recording, a heating pad was wrapped around the animal holder to keep the mouse warm.
2.2 Animal holder
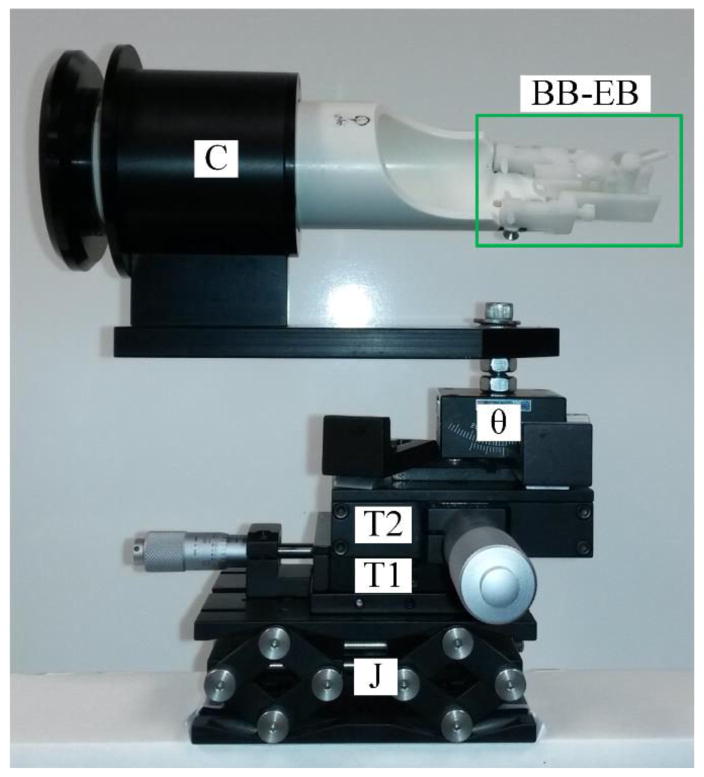
Figure 1 shows a photograph of our custom-designed animal holder. Since IOS measures pixel intensity changes in captured images, any movement of the retina resulted in noise that reduced the IOS sensitivity and amplitude. Eye movements caused by the breath and heartbeats were inevitable unless the mouse head was totally fixed. Some animal holders designed for retinal imaging are equipped with a fixation mechanism; e.g., a bite bar, which could provide some fixation but this is far from enough for IOS imaging. To fixate the mouse’s head, a bite bar and ear bar are usually used in stereotaxic surgeries. However, commercial stereotaxic frames cannot be directly used for mouse imaging because they do not provide enough degrees of freedom to align the mouse eye with the imaging system. We adapted the bite bar and ear bar idea and designed a new animal holder with 5 degrees of freedom (i.e., x, y, z, pitch and roll) and integrated the bite bar and ear bar to it. Two linear translation stages and one mini lab jack were used to provide x, y and z alignments, a θ translation stage was used for pitch alignment and a cassette (from Bioptigen, custom modified) was used to hold the animal and provide roll adjustment. The bite bar and ear bar units (model SGP-4 from NARISHIGE Group, modified) were fixed at the end of the cassette.
Figure 1.
Custom designed animal holder. J is a mini lab jack for z adjustment, T1 and T2 are translational stages for x and y adjustment, θ is θ the translation stage for pitch adjustment, C is the mouse cassette (from Bioptigen, custom modified) where the mouse will be placed. BB-EB is the bite bar and ear bar unit (green rectangle, model SGP-4 from NARISHIGE Group, modified).
2.3 Imaging setup
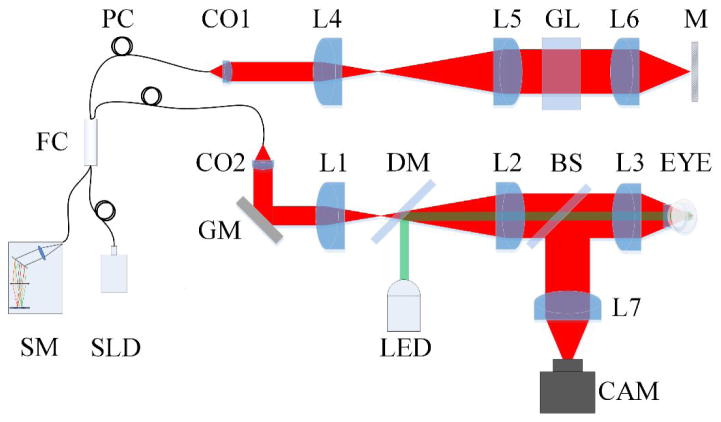
Figure 2 shows a schematic diagram of our custom-designed OCT. For high resolution retinal imaging, a specialized SDOCT was designed and constructed. A wide band near infrared (Δλ =100 nm, λ =850 nm) superluminescent diode (SLD, D840, Superlum) was used as an OCT light source to provide high axial resolution (3 μm). Light from the light source was focused by lenses and the mouse eye to the retina and scanned on the retina with a galvo mirror (GVS001, Thorlabs). The galvo mirror was placed conjugate to the pupil so that light entering the pupil did not wander. A green (λ =505nm) light emitting diode (LED, M505L3, Thorlabs) was coupled into the system with a dichroic mirror (DMLP650R, Thorlabs) to stimulate the retina. For easy alignment of the mouse eye, a pupil camera was integrated into the system. A custom designed spectrometer was constructed for OCT recording. The linear camera (AViiVA EM4, e2v) that was used in the OCT could provide a recording speed up to 70,000 lines per second, providing a B-scan frame speed up to 500 frames per second. The high imaging speed minimized in-frame image blur and between-frame image movement induced by eye movement and enabled the observation of transient IOS responses.
Figure 2.
Schematic diagram of the custom-designed OCT used for in vivo IOS imaging of mouse retinas. SLD: superluminescent diode; SM: spectrometer; PC: polarization controller; FC: fiber coupler; CAM: camera; LED: light emitting diode; CO1-CO2: collimators; L1–L5: lenses; GL: glass block; M: Mirror; GM: galvo mirror; DM: dichroic mirror; BS: beam splitter.
2.4 Data acquisition
OCT images were typically recorded at 200 frames per second. At 0.5 seconds after image acquisition started, a 10 ms light stimulus with intensity 4×10⁵ photons/μm2/ms was introduced for retinal stimulation. After the onset of the stimulus, images were recorded for 1.5 seconds further. All data were saved to a computer hard drive for post processing. Although a delicate head fixation method was used, there was still observable bulk motion in OCT images. Residual bulk motion was further reduced by accurate image registration. Images with minimized bulk motion were then used for calculating IOSs using a custom developed Matlab program.
3. RESULTS
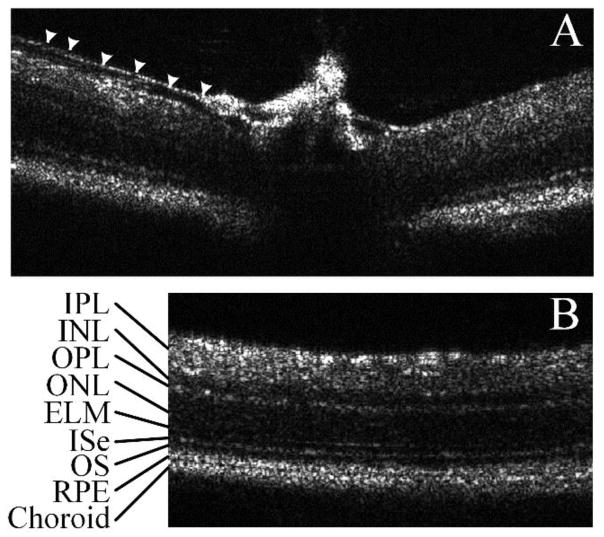
Figure 3 shows two representative OCT B-scan images with a large field of view. Figure 3A shows the optic nerve head and arrow heads mark a small blood vessel wall, which is different from the nerve fiber layer. Figure 3B shows a B-scan slightly away from the optic nerve head, where different retinal layers including the inner plexiform layer (IPL), inner nuclear layer (INL), outer plexiform layer (OPL), outer nuclear layer (ONL), external limiting membrane (ELM), inner segment ellipsoid (ISe), retinal pigment epithelium (RPE) and choroid were clearly observed. Image results confirmed the high resolution that is necessary for IOS imaging 17.
Figure 3.
Large field mouse retina B-scans acquired with a custom built SDOCT. All pictures are single frame pictures without any averaging or smoothing. A) Optic nerve head. Arrow shows a small blood vessel wall, which is different from nerve fiber layer; B) Area near the optic nerve head, showing clear retinal layers including, IPL: inner plexiform layer, INL: inner nuclear layer, OPL: outer plexiform layer, ONL: outer nuclear layer, ELM: external limiting membrane, ISe: external limiting membrane, OS: outer segment, RPE: retinal pigment epithelium.
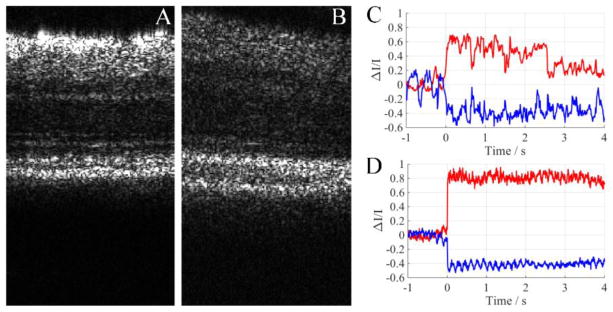
To test the effectiveness of the fixation mechanism of the animal holder, we compared the experimental results without (Fig. 4A) and with (Fig. 4B) the bite bar and ear bar. Figure 4A shows representative imaging results without the bite bar and ear bar, and the retina was clearly observed moving around with an amplitude larger than for a single photoreceptor cell (movie 1). The large amplitude movement introduced large pixel intensity changes in acquired images and introduced a great amount of noise. Since this movement was in three dimensions, the captured OCT B-scans not only shifted within the image plane but also changed speckle patterns due to the z axis translation. Speckle pattern changes could not be registered by post image processing, thus the head fixation method is essential for IOS imaging. Movie 2 in Figure 4B shows that after the bite bar and ear bar were used to fixate the mouse head, the retina movement was largely reduced and became hardly observable. Figures 4 C and 4 D showed corresponding IOSs calculated from the two experiment trials. IOSs were severely polluted by eye movements and became hardly observable in the trial without the bite bar and ear bar (Fig. 4C). The signal to noise ratio (SNR) was 4.7 dB. In the trial with the bite bar and ear bar, IOSs were clearly observed and the SNR was increased to 11.2 dB (Fig. 4D).
Figure 4.
Comparison of imaging results between experimental trials with and without the bite bar and ear bar. A) Movie 1. Movie of the mouse retina OCT B-scans. The mouse was placed freely on the animal holder. http://dx.doi.org/10.1117/12.2212810.1; B) Movie 2. Movie of mouse retina OCT B-scans. The head of the mouse was fixated with our custom designed bite bar and ear bar. http://dx.doi.org/10.1117/12.2212810.2; C) Calculated IOS corresponding to A; D) Calculated IOS corresponding to B.
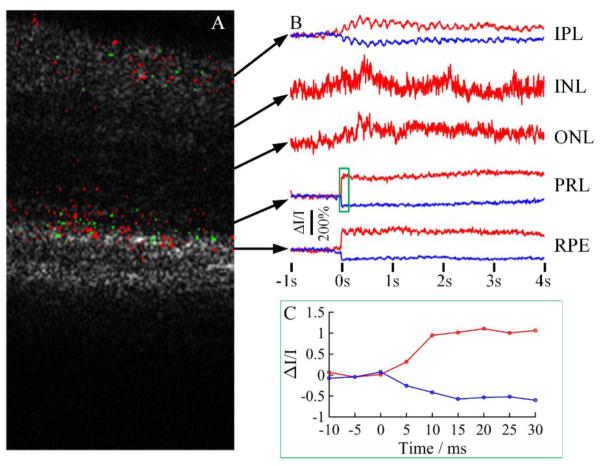
High resolution OCT images with minimal retinal movement enabled robust IOS imaging. IOSs were consistently observed from photoreceptor OSs (Fig. 5A) and inner retinal layers. Both positive and negative signals were observed. Rapid IOSs occurred at the OS almost immediately after the stimulus delivery, which agreed with our previous observation from frog retinas 18, 27. From Figure 5C, it was observed that the IOS onset time was within 10 ms and the peak time was within 20 ms. Similar signals were also observed from the RPE layer (Figure 5B), but we speculated that those signals were contributed, at least partially, by OSs since the tip of the OS can penetrate into the RPE layer. Some slow responses were observed from the inner retinal layers. It was observed that those slow signals reached the magnitude peak around 0.5 s 10.
Figure 5.
Representative IOS measurement. A) IOS map showing positive and negative signal pixels. Red pixels: positive, green pixels: negative. B) IOS curves from different retinal layers. C) Zoom-in of the green rectangle area in B.
4. CONCLUSIONS
In summary, a custom-designed OCT was developed for in vivo IOS imaging of mouse retinas. The custom-built animal holder effectively reduced eye movements and significantly improved IOS SNRs. High resolution OCT revealed cross-sectional images of the retina with multiple functional layers. The animal holder effectively kept the animal still during the imaging process. Robust fast IOSs were observed from photoreceptor OSs. Both positive and negative IOSs were observed from the OS in the stimulated retina. Fast IOSs appeared almost immediately (< 5 ms) after the onset of the stimulus light and reached a peak within 20 ms. Further study with transgenic mouse models will pave the way toward using functional IOS imaging as a new method for eye disease detection and treatment evaluation.
Acknowledgments
This research was supported in part by NIH R01 EY023522, NIH R01 EY024628, NSF CBET-1055889, and NIH P30 EY001792.
References
- 1.Curcio CA, Medeiros NE, Millican CL. Photoreceptor loss in age-related macular degeneration. Invest Ophthalmol Vis Sci. 1996;37(7):1236–49. [PubMed] [Google Scholar]
- 2.Nagy D, Schonfisch B, Zrenner E, et al. Long-term follow-up of retinitis pigmentosa patients with multifocal electroretinography. Invest Ophthalmol Vis Sci. 2008;49(10):4664–71. doi: 10.1167/iovs.07-1360. [DOI] [PubMed] [Google Scholar]
- 3.Scholl HP, Zrenner E. Electrophysiology in the investigation of acquired retinal disorders. Surv Ophthalmol. 2000;45(1):29–47. doi: 10.1016/s0039-6257(00)00125-9. [DOI] [PubMed] [Google Scholar]
- 4.Ball SL, Petry HM. Noninvasive assessment of retinal function in rats using multifocal electroretinography. Invest Ophthalmol Vis Sci. 2000;41(2):610–7. [PubMed] [Google Scholar]
- 5.Hood DC. Assessing retinal function with the multifocal technique. Prog Retin Eye Res. 2000;19(5):607–46. doi: 10.1016/s1350-9462(00)00013-6. [DOI] [PubMed] [Google Scholar]
- 6.Puliafito CA, Hee MR, Lin CP, et al. Imaging of macular diseases with optical coherence tomography. Ophthalmology. 1995;102(2):217–29. doi: 10.1016/s0161-6420(95)31032-9. [DOI] [PubMed] [Google Scholar]
- 7.Yao X, Wang B. Intrinsic optical signal imaging of retinal physiology: a review. J Biomed Opt. 2015;20(9):90901. doi: 10.1117/1.JBO.20.9.090901. [DOI] [PMC free article] [PubMed] [Google Scholar]
- 8.Yao XC, George JS. Near-infrared imaging of fast intrinsic optical responses in visible light-activated amphibian retina. J Biomed Opt. 2006;11(6):064030. doi: 10.1117/1.2393155. [DOI] [PubMed] [Google Scholar]
- 9.Yao XC. Intrinsic optical signal imaging of retinal activation. Jpn J Ophthalmol. 2009;53(4):327–33. doi: 10.1007/s10384-009-0685-4. [DOI] [PubMed] [Google Scholar]
- 10.Li YC, Strang C, Amthor FR, et al. Parallel optical monitoring of visual signal propagation from the photoreceptors to the inner retina layers. Opt Lett. 2010;35(11):1810–2. doi: 10.1364/OL.35.001810. [DOI] [PMC free article] [PubMed] [Google Scholar]
- 11.Li YG, Liu L, Amthor F, et al. High-speed line-scan confocal imaging of stimulus-evoked intrinsic optical signals in the retina. Opt Lett. 2010;35(3):426–8. doi: 10.1364/OL.35.000426. [DOI] [PMC free article] [PubMed] [Google Scholar]
- 12.Li YG, Zhang QX, Liu L, et al. High spatiotemporal resolution imaging of fast intrinsic optical signals activated by retinal flicker stimulation. Opt Express. 2010;18(7):7210–8. doi: 10.1364/OE.18.007210. [DOI] [PMC free article] [PubMed] [Google Scholar]
- 13.Zhang QX, Wang JY, Liu L, et al. Microlens array recording of localized retinal responses. Opt Lett. 2010;35(22):3838–40. doi: 10.1364/OL.35.003838. [DOI] [PMC free article] [PubMed] [Google Scholar]
- 14.Zhang QX, Lu RW, Li YG, et al. In vivo confocal imaging of fast intrinsic optical signals correlated with frog retinal activation. Opt Lett. 2011;36(23):4692–4. doi: 10.1364/OL.36.004692. [DOI] [PMC free article] [PubMed] [Google Scholar]
- 15.Yao XC, Li YC. Functional imaging of retinal photoreceptors and inner neurons using stimulus-evoked intrinsic optical signals. Methods Mol Biol. 2012;884:277–85. doi: 10.1007/978-1-61779-848-1_20. [DOI] [PMC free article] [PubMed] [Google Scholar]
- 16.Zhang QX, Lu RW, Curcio CA, et al. In vivo confocal intrinsic optical signal identification of localized retinal dysfunction. Invest Ophthalmol Vis Sci. 2012;53(13):8139–45. doi: 10.1167/iovs.12-10732. [DOI] [PMC free article] [PubMed] [Google Scholar]
- 17.Wang B, Lu R, Zhang Q, et al. En face optical coherence tomography of transient light response at photoreceptor outer segments in living frog eyecup. Opt Lett. 2013;38(22):4526–9. doi: 10.1364/OL.38.004526. [DOI] [PMC free article] [PubMed] [Google Scholar]
- 18.Zhang Q, Lu R, Wang B, et al. Functional optical coherence tomography enables in vivo physiological assessment of retinal rod and cone photoreceptors. Sci Rep. 2015;5:9595. doi: 10.1038/srep09595. [DOI] [PMC free article] [PubMed] [Google Scholar]
- 19.Moayed AA, Hariri S, Choh V, et al. In vivo imaging of intrinsic optical signals in chicken retina with functional optical coherence tomography. Opt Lett. 2011;36(23):4575–7. doi: 10.1364/OL.36.004575. [DOI] [PubMed] [Google Scholar]
- 20.Akhlagh Moayed A, Hariri S, Choh V, et al. Correlation of visually evoked intrinsic optical signals and electroretinograms recorded from chicken retina with a combined functional optical coherence tomography and electroretinography system. J Biomed Opt. 2012;17(1):016011. doi: 10.1117/1.JBO.17.1.016011. [DOI] [PubMed] [Google Scholar]
- 21.Srinivasan VJ, Wojtkowski M, Fujimoto JG, et al. In vivo measurement of retinal physiology with high-speed ultrahigh-resolution optical coherence tomography. Opt Lett. 2006;31(15):2308–10. doi: 10.1364/ol.31.002308. [DOI] [PubMed] [Google Scholar]
- 22.Bizheva K, Pflug R, Hermann B, et al. Optophysiology: depth-resolved probing of retinal physiology with functional ultrahigh-resolution optical coherence tomography. Proc Natl Acad Sci U S A. 2006;103(13):5066–71. doi: 10.1073/pnas.0506997103. [DOI] [PMC free article] [PubMed] [Google Scholar]
- 23.Ts'o D, Schallek J, Kwon Y, et al. Noninvasive functional imaging of the retina reveals outer retinal and hemodynamic intrinsic optical signal origins. Jpn J Ophthalmol. 2009;53(4):334–44. doi: 10.1007/s10384-009-0687-2. [DOI] [PMC free article] [PubMed] [Google Scholar]
- 24.Hanazono G, Tsunoda K, Shinoda K, et al. Intrinsic signal imaging in macaque retina reveals different types of flash-induced light reflectance changes of different origins. Invest Ophthalmol Vis Sci. 2007;48(6):2903–12. doi: 10.1167/iovs.06-1294. [DOI] [PubMed] [Google Scholar]
- 25.Srinivasan VJ, Chen Y, Duker JS, et al. In vivo functional imaging of intrinsic scattering changes in the human retina with high-speed ultrahigh resolution OCT. Opt Express. 2009;17(5):3861–77. doi: 10.1364/oe.17.003861. [DOI] [PMC free article] [PubMed] [Google Scholar]
- 26.Zhang QX, Zhang Y, Lu RW, et al. Comparative intrinsic optical signal imaging of wild-type and mutant mouse retinas. Opt Express. 2012;20(7):7646–54. doi: 10.1364/OE.20.007646. [DOI] [PMC free article] [PubMed] [Google Scholar]
- 27.Wang BQ, Zhang QX, Lu RW, et al. Functional optical coherence tomography reveals transient phototropic change of photoreceptor outer segments. Optics Letters. 2014;39(24):6923–6926. doi: 10.1364/OL.39.006923. [DOI] [PMC free article] [PubMed] [Google Scholar]


