Abstract
Nitrogen catabolite repression (NCR), the ability of Saccharomyces cerevisiae to use good nitrogen sources in preference to poor ones, derives from nitrogen-responsive regulation of the GATA family transcription activators Gln3 and Gat1. In nitrogen-replete conditions, the GATA factors are cytoplasmic and NCR-sensitive transcription minimal. When only poor nitrogen sources are available, Gln3 is nuclear, dramatically increasing GATA factor-mediated transcription. This regulation was originally attributed to mechanistic Tor protein kinase complex 1 (mTorC1)-mediated control of Gln3. However, we recently showed that two regulatory systems act cumulatively to maintain cytoplasmic Gln3 sequestration, only one of which is mTorC1. Present experiments demonstrate that the other previously elusive component is uncharged transfer RNA-activated, Gcn2 protein kinase-mediated general amino acid control (GAAC). Gcn2 and Gcn4 are required for NCR-sensitive nuclear Gln3-Myc13 localization, and from epistasis experiments Gcn2 appears to function upstream of Ure2. Bmh1/2 are also required for nuclear Gln3-Myc13 localization and appear to function downstream of Ure2. Overall, Gln3 phosphorylation levels decrease upon loss of Gcn2, Gcn4, or Bmh1/2. Our results add a new dimension to nitrogen-responsive GATA-factor regulation and demonstrate the cumulative participation of the mTorC1 and GAAC pathways, which respond oppositely to nitrogen availability, in the nitrogen-responsive control of catabolic gene expression in yeast.
Keywords: Bmh1/2, Gat1, Gcn2, Gln3, nitrogen catabolite repression
WHEN simultaneously provided with both a good and poor nitrogen source, Saccharomyces cerevisiae cells will exhaust the good source from the medium before using the poor one (Watson 1977). However, there is no particular structural requirement for a compound to function as a good nitrogen source beyond being present in sufficient amounts, and transported and catabolized rapidly. These requirements result in the quality of a nitrogen source being somewhat dependent on the strain background analyzed. The regulatory system mediating this selectivity is designated nitrogen catabolite repression (NCR) (Cooper 1982, 2004; Broach 2012; Ljungdahl and Daignan-Fornier 2012; Conrad et al. 2014). The functional heart of NCR is the GATA factors, Gln3 and Gat1, which activate the transcription of genes needed to transport and catabolize poorly used nitrogen sources. In nitrogen-replete conditions, Gln3- and Gat1-mediated transcription is repressed, whereas it is derepressed when nitrogen supplies are meager.
Mechanism of TorC1-mediated Gln3 regulation
Once GATA factors were identified and the transcriptional wiring of NCR-sensitive transcriptional control elucidated (Hofman-Bang 1999; Cooper 2002, 2004; Magasanik and Kaiser 2002), the pressing question became how the response to such a breadth of compounds could be integrated and directed to regulate Gln3 and Gat1. The answer began to emerge by connecting the dots between Gln3 and its negative regulator, Ure2, with mechanistic Tor protein kinase complex 1 (mTorC1) (Blinder et al. 1996; Beck and Hall 1999; Cardenas et al. 1999; Hardwick et al. 1999; Bertram et al. 2000; Kulkarni et al. 2001; Carvalho and Zheng 2003). This global regulator integrates and generates responses to a diverse spectrum of nutrient- and stress-related inputs (Crespo and Hall 2002; Kim and Guan 2011; Loewith and Hall 2011; Laplante and Sabatini 2012; Lamming and Sabatini 2013; Bar-Peled and Sabatini 2014; Swinnen et al. 2014; Shimobayashi and Hall 2016; Stauffer and Powers 2016). When activated, mTorC1 upregulates processes associated with increased cell division, e.g., protein or ribosomal protein synthesis; and conversely downregulates those associated with nutrient limitation, e.g., NCR-sensitive transcription and autophagy. In nutrient-poor conditions the regulatory outcomes are reversed.
Models conceptualizing this and observations from subsequent investigations posit that excess nitrogen or glutamine activates mTorC1 via the intermediate action of a leucyl transfer RNA (tRNA)-Ego-Gtr complex (figure 1 in Rai et al. 2016) (Binda et al. 2009, 2010; Bonfils et al. 2012; Crespo et al. 2002). Thus activated, mTorC1 phosphorylates Gln3 and Tor-associated protein, Tap42 (Di Como and Arndt 1996; Beck and Hall 1999; Bertram et al. 2000). Phosphorylation of Gln3 facilitates its interaction with Ure2, sequestering it in the cytoplasm (Bertram et al. 2000). Tap42 phosphorylation facilitates its interaction with the Sit4 and PP2A phosphatases (Di Como and Arndt 1996; Jiang and Broach 1999). The Tap42-phosphatase complexes, bound to mTorC1, result in their inactivation; further maintaining Gln3 in its phosphorylated, Ure2-bound form (Beck and Hall 1999; Bertram et al. 2000; Wang et al. 2003; Yan et al. 2006). In limiting nitrogen or after rapamycin inhibition of mTorC1, the Tap42-Sit4 complex is released and thus activated, and it dephosphorylates Gln3; permitting it to dissociate from Ure2, enter the nucleus, and activate NCR-sensitive transcription (Beck and Hall 1999; Bertram et al. 2000; Wang et al. 2003; Yan et al. 2006) .
Figure 1.
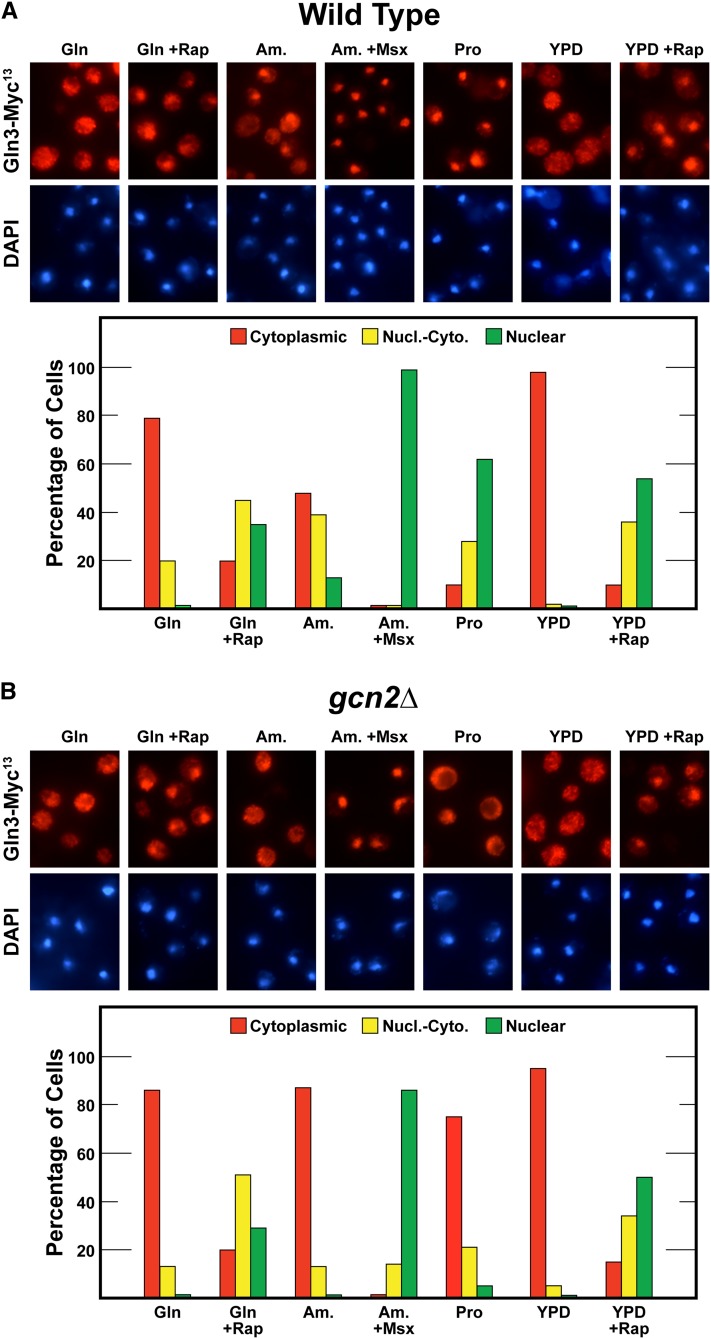
Gcn2 is required for nuclear Gln3-Myc13 localization in response to growth with nitrogen sources whose use requires NCR-sensitive transcription. Gln3-Myc13 localization was measured in (A) wild-type (BY4742) and (B) gcn2Δ cells cultured in complex YPD or YNB-minimal medium with glutamine (Gln), ammonia (Am.), or proline (Pro) as sole nitrogen source. Rapamycin (+Rap) or methionine sulfoximine (+Msx) were added where indicated to glutamine- or ammonia-grown cells, respectively. Intracellular Gln3-Myc13 was visualized and scored as cytoplasmic (red bars), nuclear-cytoplasmic (yellow bars), or nuclear (green bars) as described in Materials and Methods. Nucl.-Cyto., nuclear-cytoplasmic.
Need to enlarge the mTorC1 control model
As elegant and engaging as this model is, it has become increasingly clear that nitrogen-responsive mTorC1 regulation was insufficient to explain NCR (Cox et al. 2004a,b; Tate et al. 2006, 2009, 2010; Georis et al. 2008, 2011a,b; Fayyad-Kazan et al. 2016). Most significantly, the five methods interchangeably used to downregulate mTorC1 activity in fact represented five physiologically distinct conditions when a single reporter, Gln3, was employed (Tate and Cooper 2013): Rap-elicited nuclear Gln3 localization required both Sit4 and PP2A phosphatases. A similar Gln3 response to growth in derepressive proline medium or following short-term nitrogen starvation required only Sit4. On the other hand, long-term nitrogen starvation (correlating with G1 arrest) or nuclear Gln3 localization in response to the glutamine synthetase inhibitor, methionine sulfoximine (Msx), required neither phosphatase. Most telling, Gln3 intracellular localization was immune to leucine starvation, leucyl tRNA synthetase inhibitors, or abolishment of the Gtr-Ego complex components needed to activate mTorC1 (Tate and Cooper 2013; Tate et al. 2015a).
Parsing Gln3 regulation with Gln3 substitution mutants
Recent experiments have begun to parse and identify the missing regulatory components and mechanisms that cumulatively achieve NCR-sensitive Gln3 control. The construction of Gln3 substitutions uniquely abolishing the Gln3 response to one of the above five conditions while leaving others untouched has been pivotal to this progress. Alteration of Gln3656–662 (pRR850) abolishes its interaction with mTor1 and response to rapamycin. This results in cytoplasmic Gln3 sequestration in a nitrogen-replete medium decreasing by half, with Gln3 about equally distributed as cytoplasmic, nuclear-cytoplasmic, and nuclear (Rai et al. 2013). Alterations in Gln3526–539 (pRR1045) eliminates a response to rapamycin without any other effects (Rai et al. 2014) and alanine substitutions in Gln3477–497 (pRR680) diminishes cytoplasmic Gln3 sequestration by half in nitrogen-rich yeast nitrogen base (YNB)-glutamine medium, accompanied by the characteristic tripartite distribution, but without further effects (Rai et al. 2016). When the alanine substitutions in Gln3477–497 (pRR680) were combined by those in the Gln3-mTor1 interaction site (pRR850), they additively eliminated cytoplasmic Gln3 sequestration in cells provided with excess nitrogen. In other words, the distinct regulatory systems acting through these two Gln3 target sites cumulatively controlled Gln3 localization (Rai et al. 2016). It was paradoxical, however, that the Gln3 response to glutamine starvation (Msx treatment) was not affected by any of the above gln3-substitution mutants because mTorC1 activity had been reported to be regulated by glutamine (Crespo et al. 2002). How was glutamine regulating Gln3 localization?
The question was answered by investigating the phenotypes of several gln3 “nuclear export” mutants. The data obtained demonstrated that once Gln3 enters the nucleus, its intranuclear path is regulated by glutamine levels themselves or by those of a glutamine metabolite able to be mimicked by glutamine analogs (Rai et al. 2015). In high glutamine, Gln3 can exit from the nucleus in the absence of binding to its promoter GATA targets. In contrast, when glutamine levels are decreased, nuclear Gln3 export can no longer occur in the absence of functional DNA binding.
Candidates to join mTorC1 in cumulative Gln3 regulation
The clear demonstration that overall cumulative Gln3 regulation could be parsed with gln3 mutations provided the requisite information needed to search for proteins, other than mTorC1, required to achieve Gln3 control. What nitrogen-responsive regulators might be candidates, especially molecules not previously associated with overall NCR-sensitive transcription or Gln3 localization? Among the potential candidates were the general amino acid control (GAAC) pathway and the 14-3-3 phospho-protein binding proteins Bmh1/2 (Cherkasova and Hinnebusch 2003; van Heusden and Steensma 2006; van Heusden 2009).
Nitrogen-responsive GAAC and 14-3-3 proteins
Amino acid starvation increases the cellular levels of uncharged tRNAs (Staschke et al. 2010). These uncharged tRNAs can then bind to a histidyl tRNA synthetase-related domain of the protein kinase, Gcn2, and activate it (Cherkasova and Hinnebusch 2003; Hinnebusch 2005; Castilho et al. 2014; Lageix et al. 2015; Dever et al. 2016). Activated Gcn2 phosphorylates Ser51 of eIF2αP. Phosphorylated eIF2α-P inhibits the guanine exchange factor eIF2B required for conversion of eIF2-GDP to eIF2-GTP, which in turn is required for protein synthesis initiation. Hence decreased tRNA levels and correspondingly increased Gcn2 activity decreases the rate of protein synthesis. Activated Gcn2 also stimulates Gcn4 translation. Gcn4 is the transcription factor responsible for stimulating expression of >500 genes, including those of amino acid biosynthesis (Garcia-Barrio et al. 2000; Krishnamurthy et al. 2001; Hinnebusch 2005; Natarajan et al. 2001 Staschke et al. 2010). Gcn4 additionally participates in combination with Gln3 to coactivate transcription of a small number of specific NCR-sensitive genes whose promoters contain Gcn4 binding sites (Mitchell and Magasanik 1984; Natarajan et al. 2001; Valenzuela et al. 2001, data set URL is no longer active; Riego et al. 2002; Sosa et al. 2003; Staschke et al. 2010; Hernández et al. 2011). On the other hand, when charged tRNAs are in excess, Gcn2-mediated regulatory outcomes are reversed. Importantly, nitrogen conditions that activate mTorC1 are opposite to those required to activate Gcn2.
The Bmh1/2 proteins are involved in a wide variety of control pathways by virtue of binding to and positively or negatively regulating phosphorylated regulatory molecules ranging from Adr1, at the level of transcription (Parua et al. 2010; Parua and Young 2014), to their participation in Mks1-dependent negative regulation of nuclear Rtg1/3 localization and retrograde transcription (Liu et al. 2003, 2005).
Materials and Methods
Strains and culture conditions
The S. cerevisiae strains used in this work appear in Table 1. Experiments measuring the effects of abolishing Gcn2 were performed in the BY4742 background. Those associated with loss of Bmh1/2 employed Σ1278b derivative because this is one of the very few strain backgrounds where a bmh1Δ,bmh2Δ double mutant is able to grow (Roberts et al. 1997; Robertson et al. 2000). Transformants, prepared by the lithium acetate method (Ito et al. 1983), were used as soon as possible after transformation (5 days or less). Yeast strains for the gcn2Δ,ure2Δ epistasis experiment were generated using the primers in Table 2 using the method of Wach et al. (1994).
Table 1. Strains used in this work.
| Strain | Pertinent genotype | Complete genotype |
|---|---|---|
| 10560-2B | Wild type | MATa, ura3-52, his3::hisG, leu2::hisG |
| RRY1216 | bmh1Δ,bmh2Δ | MATa, ura3-52, bmh1Δ::His3, bmh2Δ::His3, his3, leu2 |
| BS0033a | ure2Δ,bmh1Δ,bmh2Δ | Mata, ura3, leu2, trp1, his3 bmh1Δ::His3, bmh2Δ::His3 |
| RR114 | ure2Δ | MATα, lys2, ura3, trp1, ure2::TRP1 |
| BY4742 | Wild type | MATα, his3Δ, leu2Δ, lys2Δ, ura3Δ |
| GCN2a | gcn2Δ | MATα, his3Δ, leu2Δ, lys2Δ, ura3Δ, gcn2Δ::KanMX |
| GCN4a | gcn4Δ | MATα, his3Δ, leu2Δ, lys2Δ, ura3Δ, gcn4Δ::KanMX |
| RR259 | ure2Δ | MATα, his3Δ, leu2Δ, lys2Δ, ura3Δ, ure2Δ::NatMX |
| JT11 | gcn2Δ,ure2Δ | MATα, his3Δ, leu2Δ, lys2Δ, ura3Δ, gcn2Δ::KanMX, ure2Δ::NatMX |
Obtained from transOMIC Technologies. Deletion was independently validated as described in Materials and Methods.
Table 2. Oligonucleotides used in this work.
| Use | Oligonucleotide sets |
|---|---|
| gcn2Δ,ure2Δ construction | ure2-natMX-forward |
| 5′-GTCATATTGTTTTAAGCTGCAAATTAAGTTGTACACCAAATGCGTACGCTGCAGGTCGAC-3′ | |
| ure2-natMX-reverse | |
| 5′-CCTCCTTCTTCTTTCTTTCTTGTTTTTAAACAGCCTTCAATCGATGAATTCGAGCTCG-3′ | |
| gcn2Δ,ure2Δ verification | ure2 forward ATG |
| 5′-GCTTCCTTACTCGAGGTTG-3′ | |
| ure2 reverse Nat | |
| 5′-GGATGTGATGTGAGAACTG-3′ | |
| ure2 forward Nat | |
| 5′-CGCTCTACATGAGCATGC-3′ | |
| ure2 reverse TGA | |
| 5′-GGAATTCTGTGGTTGGGGTAAC-3′ | |
| ure2 coding forward | |
| 5′-CCAAGTGTCGAATCTCTCCA-3′ | |
| ure2 coding reverse | |
| 5′-ATCATCGGACCAGAGTAATGG-3′ |
Cultures (50 ml) were grown to midlog phase (A600 nm = 0.3–0.5) in YNB (without amino acids or ammonia; Difco, Detroit, MI) minimal medium containing the indicated nitrogen source (final concentration 0.1%). gcn2Δure2Δ mutant cells were harvested at A600 nm = ∼0.4. Leucine (120 μg/ml), histidine (20 μg/ml), lysine (40 μg/ml), tryptophan (20 μg/ml), and uracil (20 μg/ml) were added as needed to cover auxotrophic requirements. Cells were treated with 200 ng/ml of rapamycin for 15 min (Gcn2 experiments) or 20 min (Bmh1/2 experiments) and for 30 min with 2 mM Msx as described Georis et al. (2011).
Plasmid construction
Gln3-Myc13 plasmids pRR536, pRR680, pRR850, pRR1045, and pRR1194, and Gat1-Myc13 plasmid pKA62 were constructed in CEN-based vectors and have been previously described (Liu et al. 2003; Kulkarni et al. 2006; Rai et al. 2013, 2014, 2016). All plasmids contained a full-length GLN3 or GAT1 gene whose transcription was driven by its native wild-type promoter. The structures of all constructs were verified by restriction mapping and DNA sequence analyses.
Gln3-Myc13, Gat1-Myc13, and Gln3-GFP localization
Cell collection and Gln3-Myc13 and Gat1-Myc13 visualization by indirect immunofluorescent microscopy were performed as described (Cox et al. 2002, 2004a,b; Tate et al. 2006, 2009; Georis et al. 2008; Tate and Cooper 2013). All cell images were collected as described earlier (Tate et al. 2010; Rai et al. 2013, 2014). pRS416-Gln3-GFP (Liu et al. 2003) was monitored in growing bmh1Δ,bmh2Δ mutant cultures as described in the text.
Image processing
Microscopic images for presentation were prepared using Adobe Photoshop and Illustrator programs. Level settings (shadow and highlight only) were altered where necessary to avoid any change or loss in cellular detail relative to that observed in the microscope; changes were applied uniformly to the image presented and were similar from one image to another. Midtone gamma settings were never altered. These processed images were used for illustrative presentation only, not for scoring Gln3-Myc13, Gat1-Myc13, or Gln3-GFP intracellular distributions.
Determination of intracellular Gln3-Myc13 and Gat1-Myc13 distributions
Gln3-Myc13 and Gat1-Myc13 intracellular localizations were manually scored in 200 or more cells for each data point. Unaltered, primary .zvi image files viewed with Carl Zeiss (Thornwood, NY) AxioVision 3.0 and 4.8.1 software were exclusively used for scoring purposes. Cells containing the tagged proteins were classified into one of three categories, based on where the protein was: cytoplasmic (cytoplasmic fluorescent material only; red histogram bars), nuclear-cytoplasmic (fluorescent material appearing in both the cytoplasm and colocalizing with DAPI-positive material, DNA; yellow bars), or nuclear (fluorescent material colocalizing only with DAPI-positive material; green bars). Representative “standard” images and detailed descriptions of these categories appear in figure 2 of Tate et al. (2009) along with descriptions of how the criteria were applied. The precision of our scoring has been repeatedly documented with a SD <10% for N = 7–10 experiments performed over 9 months in some cases and up to 3 years in others (Tate et al. 2006, 2010; Rai et al. 2013, 2014). Experiment-to-experiment variation can also be assessed by comparing data obtained with wild-type pRR536 in transformants cultured in glutamine, glutamine plus rapamycin, proline, ammonia, and ammonia plus Msx since a separate wild-type culture accompanied each of the mutants.
Figure 2.
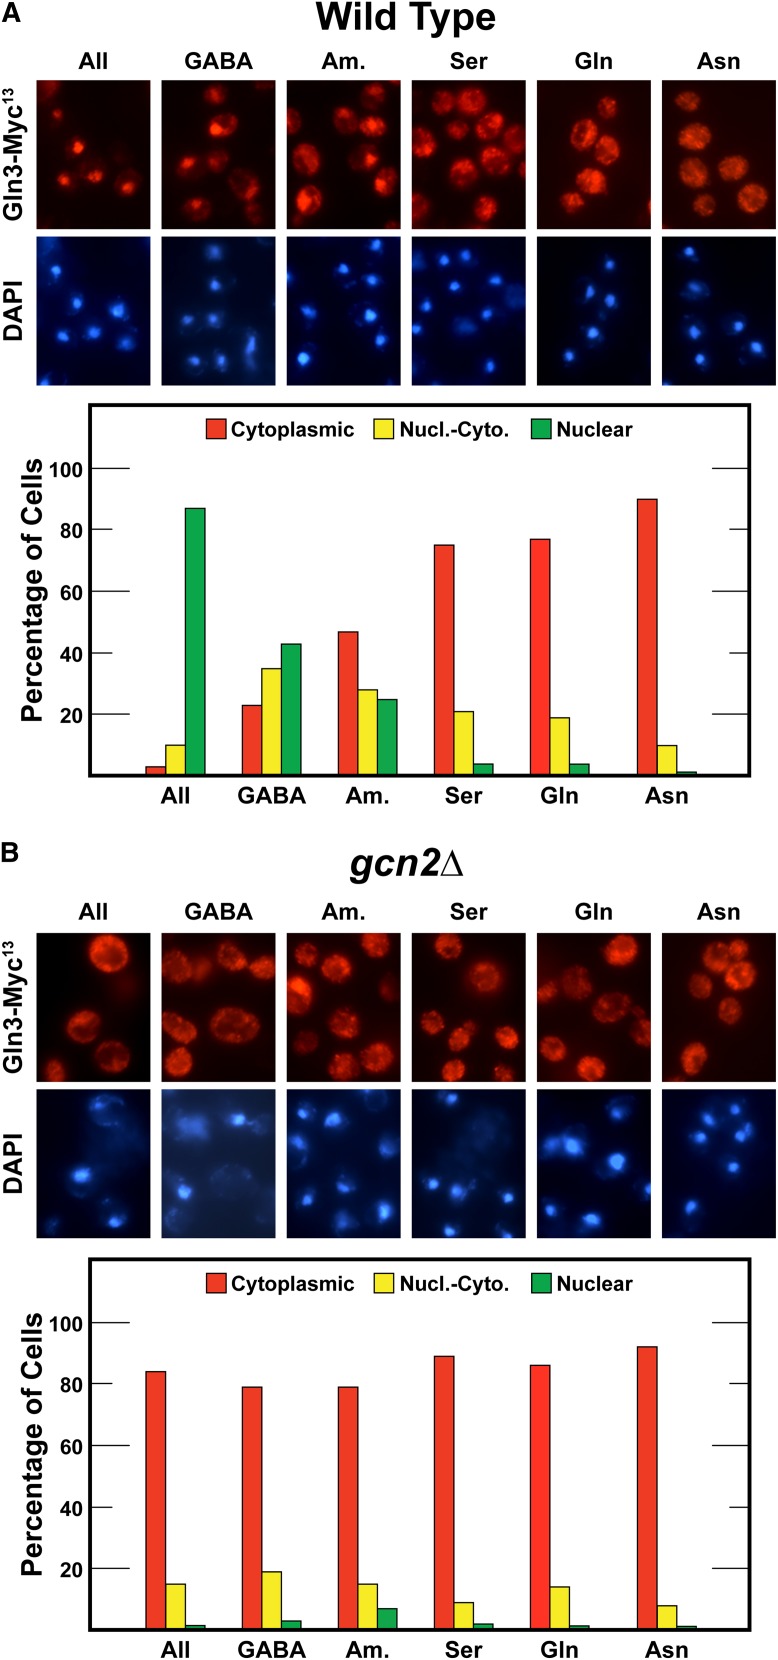
Gcn2 requirement for nuclear Gln3-Myc13 localization in cells provided with poor, derepressive nitrogen sources. Gln3-Myc13 localization was measured in (A) wild-type (BY4742) and (B) gcn2Δ cells. Nitrogen sources ranged from derepressive to repressive: allantoin (All), γ-amino-butyrate (GABA), ammonia (Am.), serine (Ser), glutamine (Gln), or asparagine (Asn) were provided (final concentration of 0.1%) as sole nitrogen source in YNB-minimal media. The experimental format and data presentation were as in Figure 1. Nucl.-Cyto., nuclear-cytoplasmic.
Only two categories (nuclear and nuclear-cytoplasmic) were used to score Gln3-GFP localization because high background fluorescence made it difficult to confidently conclude whether Gln3-GFP localization was nuclear-cytoplasmic vs. nuclear.
Images accompanying the histograms were chosen on the basis that they exhibited intracellular tagged protein distributions as close as possible to those observed by quantitative scoring. However, identifying a field that precisely reflected the more quantitative scoring data were sometimes difficult unless the tagged protein was situated in a single cellular compartment.
Northern blot analyses
Yeast strains used for Northern analyses were grown to midlog phase in the indicated medium. Total RNA was isolated as described earlier (Carlson and Botstein 1982; Schmitt et al. 1990), and Northern blot analyses performed as described by Cox et al. (2004a,b).
Western blot analyses
Extracts for Western blots were prepared and Western analyses were performed as previously described (Cox et al. 2004a; Rai et al. 2015).
Quantitative RT-PCR analyses
Quantitative RT-PCR (qRT-PCR) analyses were performed as described in Rai et al. (2015). GDH2 and TBP1 primer sequences were as previously described Georis et al. (2008, 2011).
Data availability
Results
Why GAAC might be a good candidate
We previously demonstrated nuclear Gln3-Myc13 localization is abolished by alteration of the rare glutamine tRNACUG (sup70-65 mutation) at the semipermissive temperature of 30° (Tate et al. 2015b). Investigating the more global effects of the mutant, Kemp et al. (2013) reported that sup70-65 tRNACUG was unstable and inefficiently charged at 30°. These observations suggested the following: (i) one or more events associated with tRNACUG were required for nuclear Gln3 localization, and (ii) these events were adversely affected in some specific (particular protein or tRNACUG-protein complex) or general (protein synthesis per se) way when tRNACUG was altered. The related finding that cycloheximide inhibition of protein synthesis causes Gln3 to relocate to the cytoplasm (Tate and Cooper 2013) argued in favor of the sup70-65 effects on overall protein synthesis being potentially pertinent. This focused our attention on work predominantly from the Hinnebusch laboratory which showed that Gcn2 protein kinase is exquisitely sensitive to the levels of charged tRNAs (Garcia-Barrio et al. 2000; Cherkasova and Hinnebusch 2003; Hinnebusch 2005), hence making it a possible candidate to explain how the glutamine tRNACUG sup70-65 mutation, cycloheximide inhibition of protein synthesis initiation, and repressive nitrogen sources might all function in a common mechanism to regulate nuclear Gln3 localization. This reasoning predicted that inactivating Gcn2 or deleting the nonessential GCN2 gene would adversely affect nuclear Gln3 localization.
Gcn2 is required for nuclear Gln3-Myc13 localization during growth with NCR-sensitive nitrogen sources
To test this hypothesis, we compared Gln3-Myc13 localization in wild type vs. gcn2Δ cells in response to our standard assay conditions. In repressive YNB-glutamine medium, the Gln3-Myc13 responses in wild-type and gcn2Δ cells were indistinguishable. In contrast, nuclear Gln3-Myc13 localization was almost completely abolished in ammonia- or proline-grown gcn2Δ cells (Figure 1). Consistent with these results, the growth rates of wild-type and gcn2Δ cells were relatively similar in repressive YNB-asparagine medium. In contrast, gcn2Δ growth was drastically slowed in YNB-proline medium. In other words, the gcn2Δ growth characteristics were very similar to those of gln3Δ as well as those expected if Gln3 was unable to enter the nucleus in proline-grown cells.
Importantly, the gcn2Δ phenotype exhibited high specificity. Gln3-Myc13 responses to rapamycin or Msx treatment, which have been shown to occur via mTorC1 and glutamine-mediated intranuclear regulation, respectively, were unaffected; they remained the same as wild type (Beck and Hall 1999; Cardenas et al. 1999; Hardwick et al. 1999; Bertram et al. 2000; Rai et al. 2015). The responses to abolishing Gcn2 were restricted to nitrogen sources whose uptake and/or metabolism depended on NCR-sensitive gene expression. To test this conclusion further, we assayed the effects of gcn2Δ on multiple nitrogen sources ranging from derepressive (allantoin, proline) to those that are highly repressive (asparagine, glutamine, serine). The more repressive the nitrogen source, the smaller the effect of deleting GCN2 on nuclear Gln3 localization (Figure 2). Again the phenotype correlated with that expected of abolishing Gln3 function.
Gcn2 is required for NCR-sensitive transcription
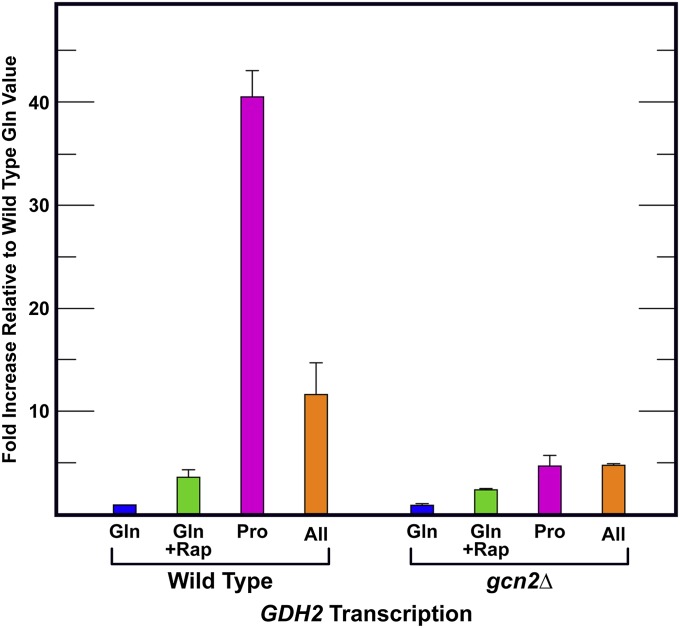
The above results with Gln3-Myc13 localization predicted that loss of Gcn2 should also have demonstrable effects on NCR-sensitive transcription. To test this prediction, we measured the steady-state levels of GDH2 messenger RNA in wild-type and gcn2Δ cells cultured in glutamine-, proline-, and allantoin-YNB media as well as in the presence of rapamycin using qRT-PCR (Figure 3). All of the data were compared to wild-type untreated glutamine levels. Abolishing Gcn2 had no demonstrable effect on GDH2 expression in untreated or rapamycin-treated, glutamine-grown cultures. The expression profile was the same as wild type. In derepressive proline medium, GDH2 expression increased 40-fold in wild-type cells, but <5-fold in gcn2Δ. The GDH2 transcription results correlated perfectly with the Gln3-Myc13 localization data (Figure 3).
Figure 3.
Gcn2 is required for NCR-sensitive GDH2 gene expression when cells are cultured with derepressive nitrogen sources. GDH2 expression was measured in wild-type (BY4742) and gcn2Δ cells using qRT-PCR provided with glutamine (Gln), proline (Pro), or allantoin (All) as sole nitrogen source. Where indicated, glutamine-grown cells were treated with rapamycin. Total RNA was collected and analyzed as described in Materials and Methods. +Rap, addition of rapamycin.
In allantoin-grown wild-type cells, GDH2 expression increased >10-fold relative to the repressed levels and decreased to <5-fold in gcn2Δ. The more modest effect of gcn2Δ observed in allantoin-grown cells was not unexpected because the main function of GDH2-encoded, NAD-dependent glutamate dehydrogenase is the production of ammonia. NCR-sensitive GDH2 expression is driven by a complex promoter and is known to be greater in medium containing the Gdh2 substrate, glutamate (a product of proline degradation), than it is in ammonia (a product of allantoin degradation) medium (Figure 3) (Miller and Magasanik 1991). Together the data indicated that high-level, NCR-sensitive transcription required Gcn2.
Effects of Gcn2 loss on short- and long-term nitrogen starvation
Another natural condition that triggers nuclear Gln3 localization is nitrogen starvation. The length of starvation, however, is an important parameter. Nuclear Gln3 localization in response to short-term nitrogen starvation (from minutes to 3 or 4 hr depending on the strain assayed) is Sit4 dependent, whereas long-term starvation (>3–4 hr), correlating with cells arresting in G1, is Sit4 independent (Tate et al. 2013). Gln3-Myc13 is distributed more or less equally in all three scoring categories (cytoplasmic, nuclear-cytoplasmic, nuclear) in Sit4-dependent, short-term nitrogen starvation; whereas in long-term starvation, Gln3-Myc13 becomes completely nuclear (Tate et al. 2013).
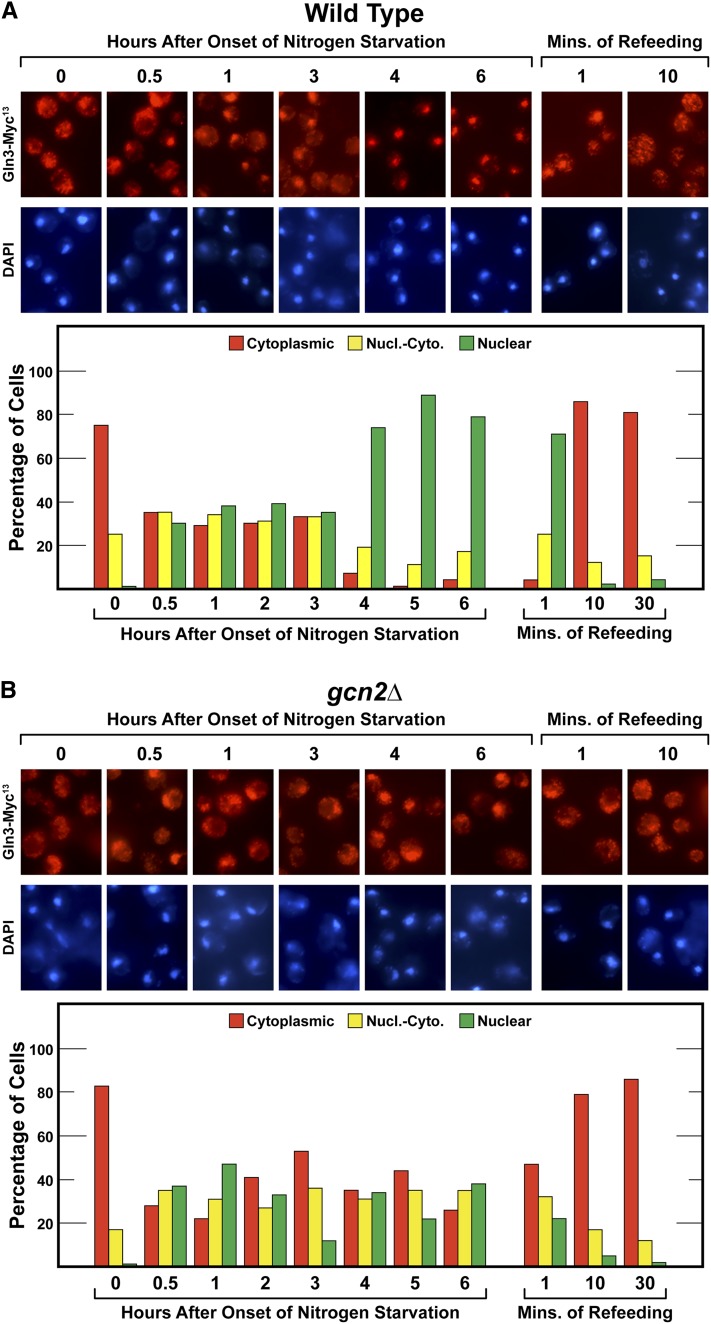
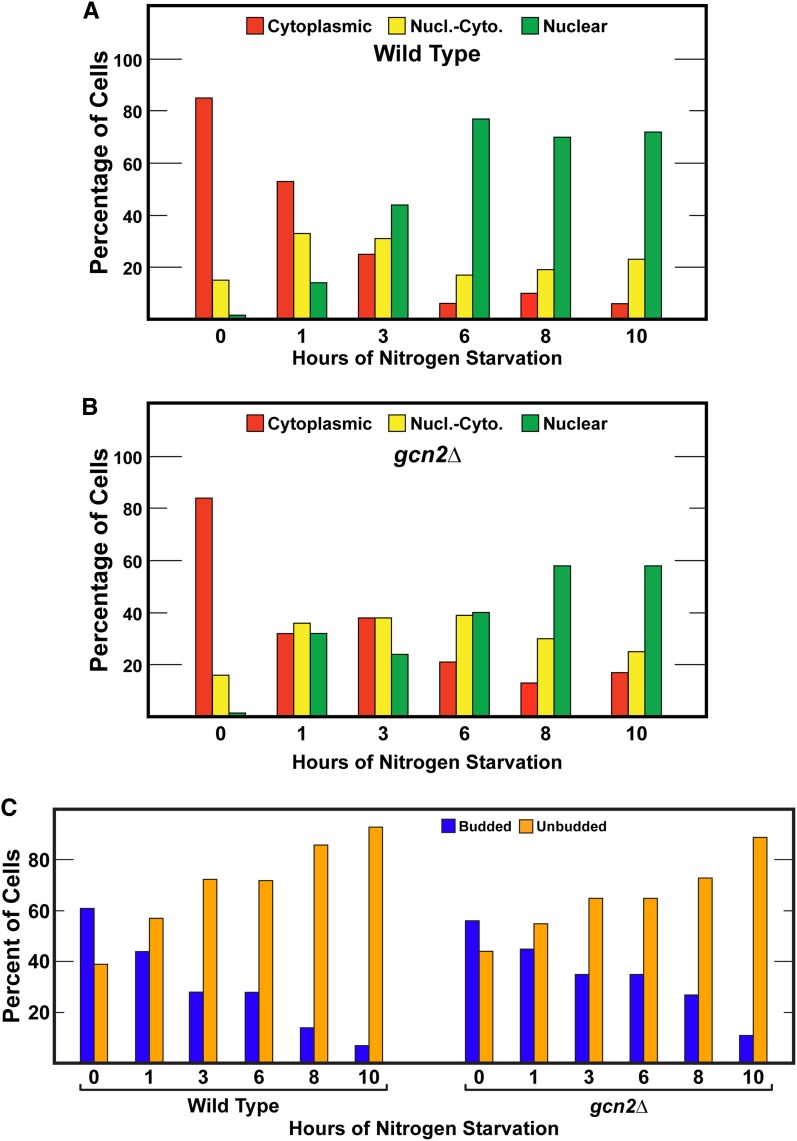
Short- and long-term nitrogen starvation elicited the expected Gln3 behavior cited above in wild-type cells, i.e., Gln3-Myc13 localization was equally distributed in the three scoring categories between 0.5 and 3 hr of starvation, and thereafter, became highly nuclear (Figure 4A and Figure 5A). In gcn2Δ, the Gln3-Myc13 response to short-term nitrogen starvation was unaffected and indistinguishable from wild type (Figure 4B). However, substantial Gln3-Myc13 relocation to the nucleus observed between 4 and 6 hr in the wild type did not occur in the mutant, suggesting at face value that Gcn2 was required for long-term nitrogen starvation. It is important to note, however, that gcn2Δ grew more slowly than wild type. Therefore, it was possible that the time needed for long-term starvation to occur correspondingly increased. To assess this possibility, we repeated the experiment tracking the bud index of the cultures to ascertain the timing of G1 arrest-correlated, long-term starvation. Wild-type cells behaved as in Figure 4A with Gln3-Myc13 becoming substantially nuclear beginning at 3 hr in concert with the increased number of unbudded cells (Figure 5, A and C). The overall profile of unbudded cell formation in gcn2Δ was similar to wild type, but was shifted somewhat to longer times (Figure 5C). Increased nuclear Gln3-Myc13 localization also occurred in the gcn2Δ mutant, but was also slowed relative to wild type, substantially increasing only at 8 hr (Figure 5B). Gln3-Myc13 did not quite achieve the same high nuclear levels as wild type. Together these data suggested that Gcn2 activity was not required for the response of Gln3 localization to short-term or long-term nitrogen starvation. The long-term nitrogen starvation results correlated well with the inability of gcn2Δ to affect the Gln3 response to Msx treatment, further attesting to the specificity of the gcn2Δ phenotype. It is also noteworthy that Gcn2 was not required for either steady-state cytoplasmic Gln3-Myc13 sequestration in glutamine-grown cells (Figure 4B, zero time point), or short-term Gln3-Myc13 relocation to the cytoplasm following addition of glutamine to previously starved cells (Figure 4B, 1 and 10 min time points).
Figure 4.
The effects of Gcn2 abolishment on Gln3-Myc13 localization in response to short- and long-term nitrogen starvation. (A) Wild-type (BY4742) and (B) gcn2Δ cells were grown to A600 nm = 0.5 in YNB-glutamine medium. They were then transferred (by filtration) to nitrogen-free YNB medium and sampled as indicated for 6 hr. At that time glutamine (0.1%) was added to the culture and sampling continued for 30 min. Gln3-Myc13 was visualized and scored as described in Materials and Methods. Nucl.-Cyto., nuclear-cytoplasmic.
Figure 5.
The effects of Gcn2 abolishment on budding and Gln3-Myc13 localization in response to long-term nitrogen starvation. (A) Wild-type (BY4742) and (B) gcn2Δ cells were grown to A600 nm = 0.5 in YNB-glutamine medium. They were then transferred (by filtration) to nitrogen-free YNB medium and sampled as indicated for 10 hr. Gln3-Myc13 was visualized and scored as described in Materials and Methods. The extent of cell budding (C) was scored in 200 or more cells per determination. Nucl.-Cyto., nuclear-cytoplasmic.
ure2Δ is epistatic to gcn2Δ for Gln3-Myc13 localization
The dramatic effects of abolishing Gcn2 on Gln3-Myc13 localization and GDH2 transcription prompted the question of whether it was functioning upstream or downstream of Ure2 in the nitrogen-responsive regulatory cascade. Since Gln3-Myc13 is highly nuclear in ure2Δ and highly cytoplasmic in gcn2Δ, we approached the question by determining the epistatic relationship of the two deletions. To this end, we constructed and validated a gcn2Δ,ure2Δ double mutant as described in Materials and Methods.
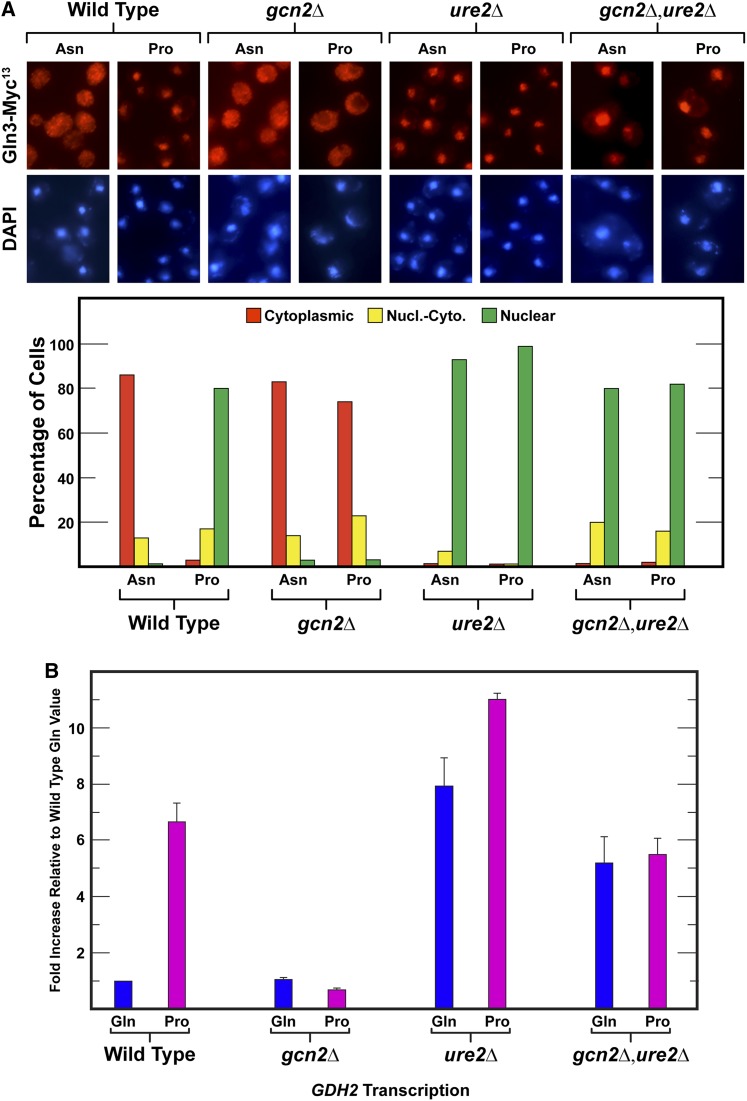
On analyzing Gln3-Myc13 localization we found that Gln3-Myc13 in wild type, ure2Δ, and gcn2Δ yielded the expected results: (i) a typical NCR-sensitive response in wild type, cytoplasmic, and nuclear in asparagine vs. proline media, respectively; (ii) predominantly nuclear in ure2Δ; and (iii) predominantly cytoplasmic in gcn2Δ, irrespective of the nitrogen source (Figure 6A). In the gcn2Δure2Δ double mutant, Gln3-Myc13 was again nearly all nuclear; indicating that ure2Δ was epistatic to gcn2Δ and therefore Gcn2 was likely functioning upstream of Ure2 (Figure 6A).
Figure 6.
ure2Δ is epistatic to gcn2Δ. Wild type (BY4742), gcn2Δ, ure2Δ (RR259), and gcn2Δure2Δ (JT11) mutants were cultured in YNB-glutamine (Gln), -asparagine (Asn) or -proline (Pro) medium. (A) Intracellular Gln3-Myc13 localization was followed in the various mutants grown in asparagine or proline medium as described in Figure 1. (B) Total RNA was harvested as described in Materials and Methods and subjected to qRT-PCR analysis using a GDH2 probe as described in Figure 3. Nucl.-Cyto., nuclear-cytoplasmic.
To further test this conclusion, we measured GDH2 gene expression (Figure 6B). As expected, GDH2 levels were NCR sensitive in wild-type cultures with expression much higher in proline than glutamine medium. Responses in the gcn2Δ and ure2Δ mutants were again opposite one another, being very low in gcn2Δ and higher than wild type in ure2Δ. In the gcn2Δ,ure2Δ double mutant, GDH2 expression was the same as wild-type derepressed levels, positively correlating with the conclusions reached by measuring Gln3-Myc13 localization.
It is reasonable to query why relative GDH2 expression levels in this experiment were lower than those observed in Figure 3. The reason is that GDH2 expression in the glutamine-grown cells of this experiment were somewhat higher than in Figure 3, thereby depressing the fold increase observed (note that the level in glutamine medium is defined as 1.0). This occurred because all of the strains in this experiment were transformed with Gln3-Myc13 to correlate with data from Figure 6A. Therefore, these strains possessed two copies of the GLN3 gene which accounted for the higher expression level in glutamine-grown cells. Note that wild-type GDH2 expression in Figure 6B was the same as that observed in Rai et al. (2015).
Components of Gln3 regulation affected by deletion of GCN2
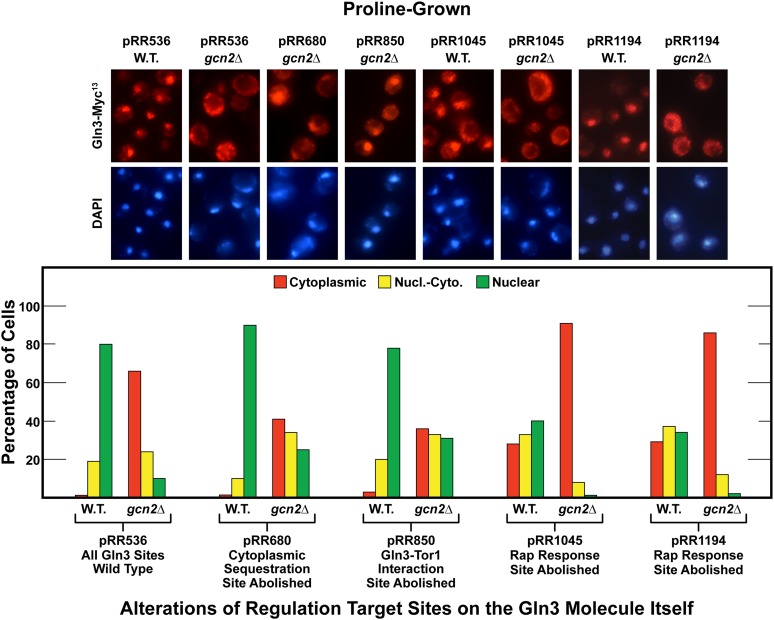
As noted in the Introduction, particular Gln3 residue substitutions adversely affect specific modes of Gln3 regulation. These mutants were previously used to demonstrate that multiple regulatory pathways cumulatively control Gln3 localization (Rai et al. 2013, 2014, 2016). Therefore, we wanted to ascertain how loss of Gcn2 would affect Gln3-Myc13 localization in each of these mutants and whether Gcn2 acted cumulatively with them. To that end, wild-type and gcn2Δ cells were transformed with a wild type or one of four mutant plasmids and the intracellular distribution of Gln3-Myc13 determined in proline-grown cells where mTorC1 is least active.
Gln3-Myc13 was almost exclusively nuclear in a wild-type transformant containing wild-type Gln3-Myc13 (pRR536), and became largely cytoplasmic in gcn2Δ (Figure 7). Gln3 was again mostly nuclear when the wild-type recipient (BY4742) was transformed with pRR680, in which Gln3 cannot be putatively phosphorylated because of serine to alanine substitutions (Rai et al. 2016). In contrast, when -gcn2Δ was used as the transformation recipient, Gln3-Myc13 was almost equally distributed in each of the three scoring categories (Figure 7). This phenotype has been repeatedly observed following the loss of one mode of Gln3 regulation (Rai et al. 2013, 2014, 2016) and is consistent with Gcn2 being responsible for half of the nuclear localization observed in wild type cells, the remaining half depending on the Gln3 residues substituted in pRR680. Results identical to those with pRR680 were also observed with pRR850, in which the Gln3-mTor1 interaction is abolished (Rai et al. 2013). Again, Gcn2 was required for full nuclear Gln3-Myc13 localization. A parallel experiment was then performed with pRR1045 and pRR1194. Substitutions in pRR1045 and pRR1194 are situated at N- and C-terminals, respectively, of the domain required for Gln3 relocation to the nucleus when cells are treated with rapamycin. Either of these substitutions abolishes the Gln3 response to rapamycin (Rai et al. 2014). In both cases, Gln3-Myc13 was no longer exclusively nuclear in the wild-type recipient, but rather equally distributed in the three scoring categories as observed when pRR850 and pRR680 were transformed into gcn2Δ (Figure 7). In other words, half of Gln3’s ability to localize to the nucleus was lost in the wild-type recipient due to abolishment of the Gln3 site required for a response to treating cells with rapamycin. The remaining half of nuclear Gln3 localization was then abolished when either pRR1045 or pRR1194 was transformed into gcn2Δ cells, resulting in Gln3-Myc13 being localized almost entirely in the cytoplasm (Figure 7). Therefore, loss of Gln3’s ability to respond to rapamycin together with abolishment of Gcn2 cumulatively eliminated nuclear Gln3-Myc13 localization.
Figure 7.
Gcn2 and mTorC1 are coregulators of intracellular Gln3-Myc13 regulation. Wild type (BY4742) and gcn2Δ strains were transformed with wild type (pRR536) and gln3 substitution mutant plasmids pRR680, pRR850, pRR1045, and pRR1194. The transformants were then grown in YNB-proline medium and Gln3-Myc13 intracellular localization assayed. The format and presentation of the experimental data were as described in Figure 1. Nucl.-Cyto., nuclear-cytoplasmic; W.T., wild type.
The uptake and assimilation of ammonia, like that of proline, requires NCR-sensitive transcription, e.g., of the MEP permease and GLN1 glutamine synthetase genes. As with proline, nuclear Gln3-Myc13 localization was abolished in ammonia-grown gcn2Δ cells (Figure 1B). Therefore, we grew wild-type and gcn2Δ transformants containing pRR680, pRR850, or pRR1045 in YNB-ammonia medium and measured Gln3-Myc13. The outcomes of those measurements exhibited similar profiles to those obtained with proline-grown cells in Figure 7 (data not shown), extending the correlation between Gcn2 function and NCR observed in Figure 1 and Figure 2. Together the data argued that Gcn2 functioned as one of the multiple modes of regulation to control nitrogen-responsive Gln3 localization.
Nuclear Gln3-Myc13 localization requires Gcn2-regulated Gcn4 activity
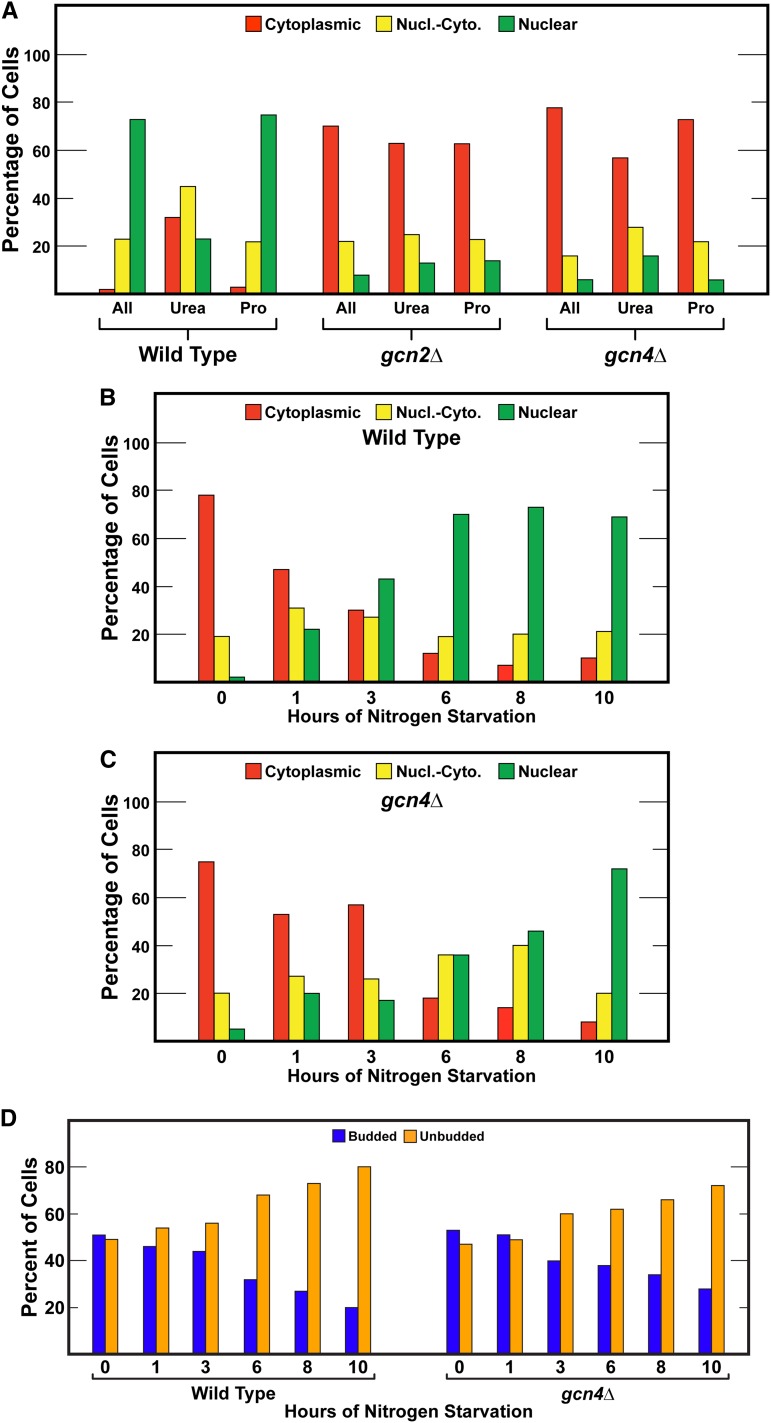
Having established participation of the metabolite-proximal global regulator, Gcn2, in Gln3 localization and function, our next objective was to begin trying to understand how that regulation was achieved. The most often observed mechanism of Gcn2-dependent regulation is via its upregulation of Gcn4 translation, a major transcriptional activator responsible for Gcn2-dependent expression of 100s of genes and in particular those required for amino acid biosynthesis. To test whether or not Gcn4 was participating in Gcn2-mediated Gln3 regulation, we obtained a Gcn4 deletion and assayed Gln3-Myc13 localization in response to our normal range of conditions. The first thing we noticed was that gcn4Δ grew more slowly than gcn2Δ, indicating that residual Gcn4 activity present in gcn2Δ was an important determinant in the growth phenotype. The Gln3-Myc13 responses in gcn4Δ cultured with a range of poor nitrogen sources were the same as those observed with gcn2Δ (Figure 8A). Similarly, equivalent Gln3-Myc13 localization responses were also observed in gcn2Δ and gcn4Δ cells subjected to short- and long-term nitrogen starvation (Figure 8, B–D). These data indicated that Gcn2-dependent regulation of Gln3 localization required Gcn4. Importantly, they also showed that the function lost in gcn4Δ could not be fulfilled by the basal levels of Gcn4 that are present in gcn2Δ.
Figure 8.
(A) Gcn4 is required for nuclear Gln3-Myc13 localization in response to growth with nitrogen sources whose use requires NCR-sensitive transcription. Gln3-Myc13 localization was measured in wild-type (BY4742), gcn2Δ, and gcn4Δ cells cultured in YNB-minimal medium provided with allantoin (All), urea, or proline (Pro) as nitrogen source. The format and presentation of the experimental data were as described in Figure 1. (B and C) Effects of Gcn4 abolishment on Gln3-Myc13 localization and cell budding (D) during nitrogen starvation. The format of the experiment and presentation of the data are as described in Figure 5. Nucl.-Cyto., nuclear-cytoplasmic.
Gln3-Myc13 is dephosphorylated in gcn2Δ and gcn4Δ mutants
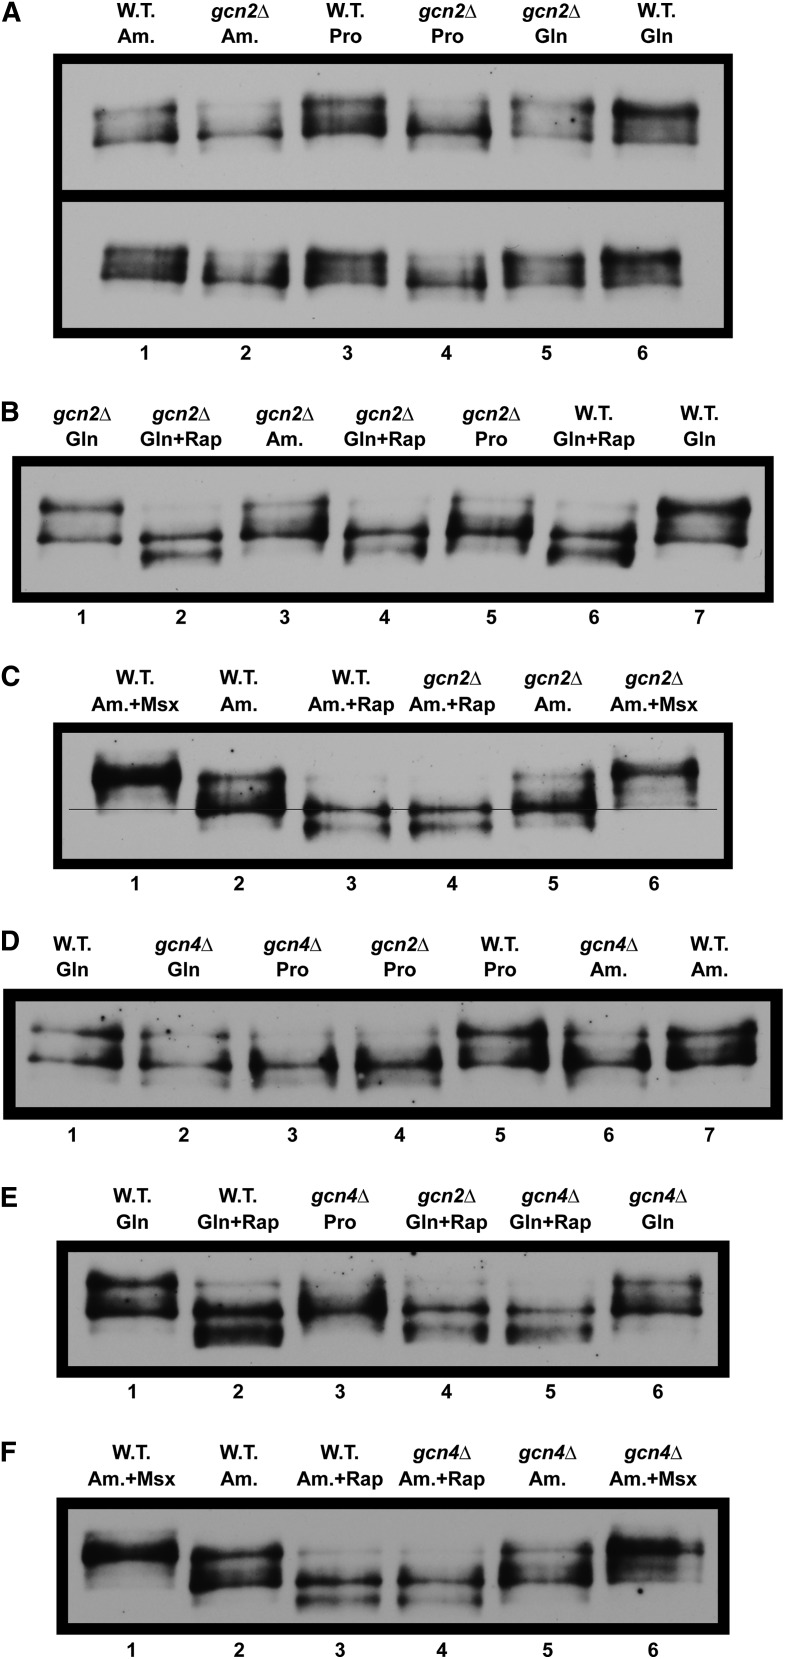
Although open questions remain (Tate et al. 2009; Feller et al. 2013), many models of mTorC1-mediated Gln3 regulation envision Gln3 to be dephosphorylated, thereby bringing about its dissociation from the Gln3-Ure2 complex and thus localization to the nucleus (Beck and Hall 1999; Bertram et al. 2000; Carvalho and Zheng 2003). Therefore, it was appropriate to ascertain whether Gln3-Myc13 phosphorylation levels, i.e., its electrophoretic mobility in Western blots, were altered in gcn2Δ and gcn4Δ mutants. To this end, we prepared extracts of glutamine-, ammonia-, or proline-grown wild-type vs. gcn2Δ cells. Gln3-Myc13 mobility increased in glutamine-, ammonia- and proline-grown gcn2Δ cells relative to wild type (Figure 9A). The increased mobility was most apparent in the ammonia- and proline-grown cells where the slowest mobility species all but disappeared (Figure 9A, lanes 1–4). Such increased Gln3 mobility has repeatedly been shown to result from decreased phosphorylation (Beck and Hall 1999; Bertram et al. 2000; Cox et al. 2004a,b; Tate and Cooper 2007). In other words, the presence of Gcn2 increased Gln3-Myc13 phosphorylation levels. This prompted us to query whether Gln3-Myc13 dephosphorylation levels would increase even further in rapamycin-treated gcn2Δ cells.
Figure 9.
Gln3-Myc13 phosphorylation levels decrease when Gcn2 (Panels A-C) or Gcn4 (Panels D-F) is abolished. Cell-free extracts were prepared from wild-type (BY4742), gcn2Δ, or gcn4Δ cultures grown in YNB-ammonia (Am.), -proline (Pro), or -glutamine (Gln). Rapamycin (+Rap) or Msx (+Msx) were added as indicated. Proteins in the extracts were then resolved using SDS-PAGE and Western blots prepared and visualized as described in Materials and Methods. W.T., wild type.
We addressed this question by comparing Gln3-Myc13 mobilities in wild-type and gcn2Δ cells treated with rapamycin. The mobility profiles of Gln3-Myc13 derived from glutamine-grown, rapamycin-treated wild-type and gcn2Δ cells were indistinguishable (Figure 9B; lanes 1, 2, 6, and 7). The loss of Gcn2 had no demonstrable effect on rapamycin-mediated Gln3-Myc13 dephosphorylation. Recall that loss of Gcn2 also had no effect on Gln3-Myc13 localization in glutamine-grown, rapamycin-treated cells (Figure 1). Therefore, we repeated the experiment, but this time used ammonia-grown cells where the loss of Gcn2 does have a marked effect on both Gln3-Myc13 localization and mobility. Similar to what occurred earlier, rapamycin treatment of ammonia-grown wild-type and gcn2Δ cells exhibited electrophoretic mobility profiles that were indistinguishable (Figure 9C, lanes 2–5). Similarly, the electrophoretic mobility profiles in Msx-treated wild-type and gcn2Δ cells were also indistinguishable. The lack of responses to rapamycin or Msx treatment again supports the specificity of the gcn2Δ phenotype.
To evaluate the potential participation of Gcn4 in Gln3-Myc13 dephosphorylation, we prepared a set of Western blots analogous to those in Figure 9, A–C, using extracts from gcn4Δ. Gln3-Myc13 mobility increased under the same conditions as it had in gcn2Δ (Figure 9, D–F). These results indicated that Gln3-Myc13 dephosphorylation was Gcn4 dependent. Since Gcn4 is a transcription activator rather than a kinase or phosphatase, the protein directly responsible for Gln3-Myc13 dephosphorylation is situated downstream of Gcn4 in the GAAC cascade.
Nuclear Gat1-Myc13 localization is also Gcn2 dependent
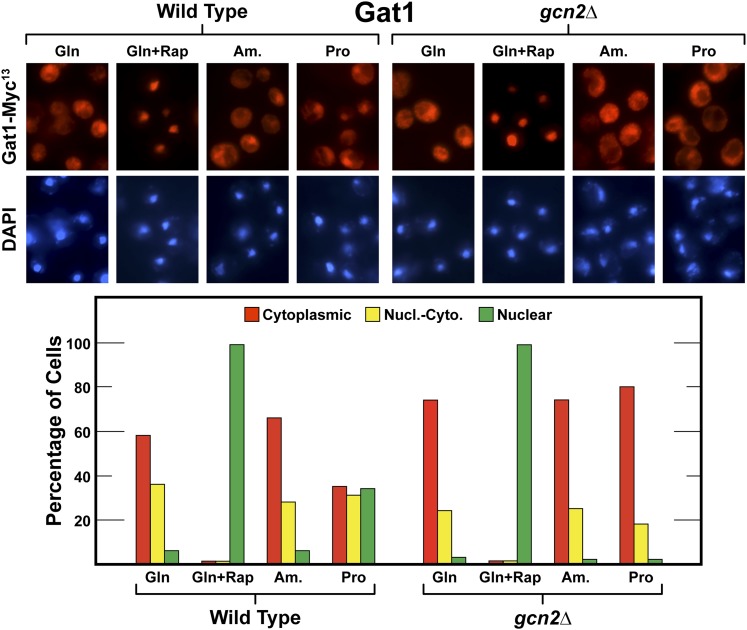
Gln3 and Gat1 share some, but not all, regulatory characteristics in common (Georis et al. 2008, 2011). Therefore, it was of interest to ascertain whether or not Gcn2 played a role in nuclear Gat1-Myc13 localization as well. In this context, it is important to recall that Gat1 localization is not nearly as NCR sensitive as Gln3 (Georis et al. 2008, 2011). We assayed the Gat1-Myc13 localization responses in wild-type and gcn2Δ cells and found the overall responses were similar to those obtained with Gln3 (Figure 10, compare with Figure 1).
Figure 10.
Gcn2 is required for nuclear Gat1-Myc13 localization in response to growth with nitrogen sources whose use requires NCR-sensitive transcription. Cells were cultured in YNB-glutamine (Gln), -ammonia (Am.), or -proline (Pro) medium. Rapamycin (+Rap) was added where indicated. The format and data presentation were as described in Figure 1. Nucl.-Cyto., nuclear-cytoplasmic.
Nuclear Gln3-Myc13 localization is abolished in a bmh1Δ,bmh2Δ double mutant
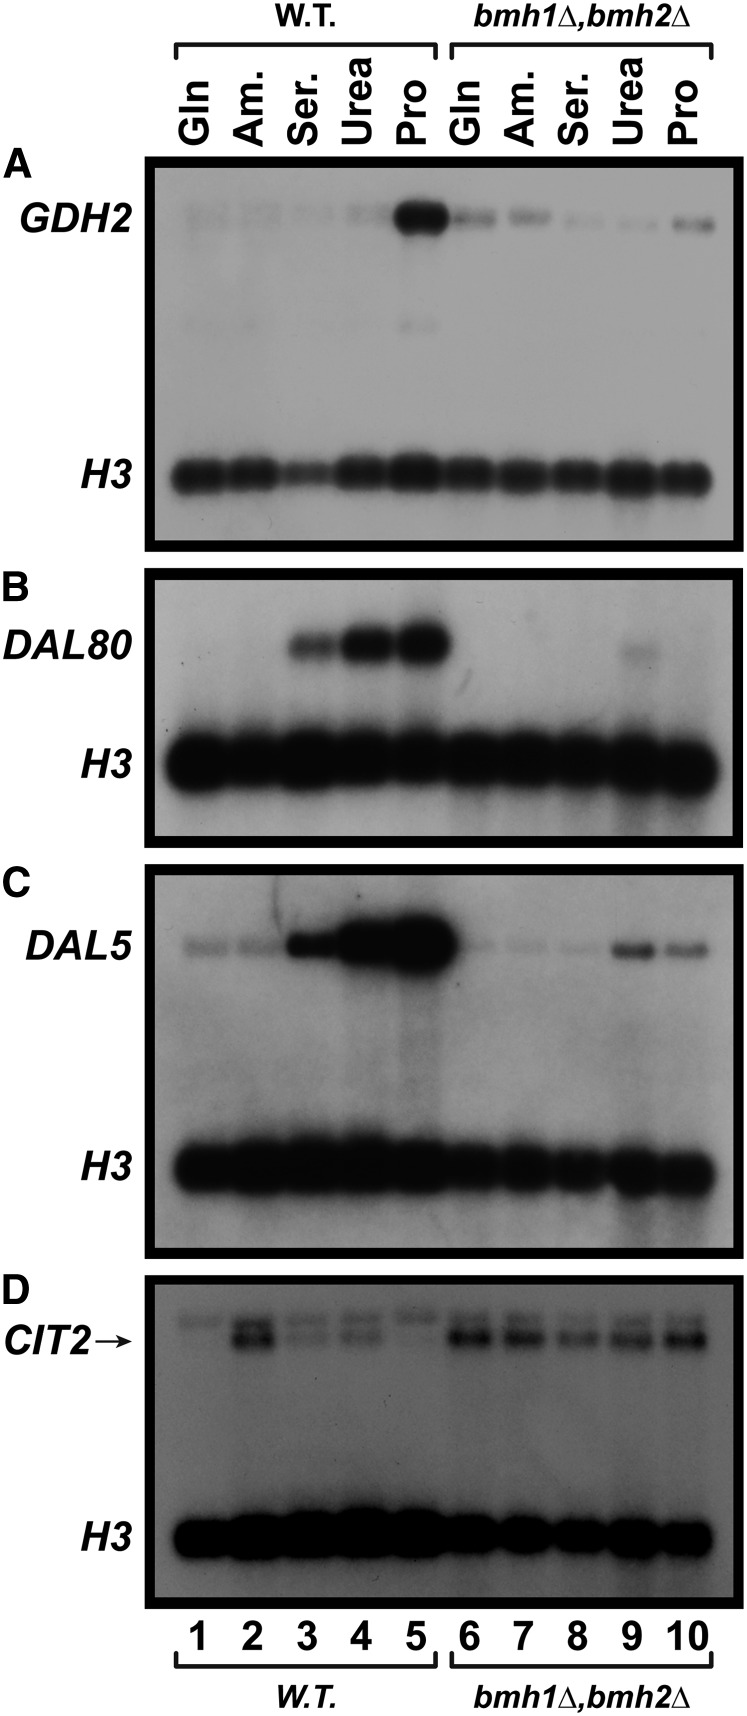
The preceding data showing that Gln3-Myc13 phosphorylation and nuclear localization both decreased in the gcn2Δ and gcn4Δ mutants prompted us to query whether the phospho-protein binding 14-3-3 proteins, Bmh1/2, participated in Gln3 localization and function. This was not as far-fetched a question as it might seem because Bmh2 has been reported to interact with Gln3 in genome-wide association liquid chromatography tandem-mass spectrometry (MS) analyses (Kakiuchi et al. 2007). Therefore, we assayed the expression of three NCR-sensitive genes, GDH2, DAL80, and DAL5 in wild-type and bmh1Δ,bmh2Δ double mutant cells (Figure 11). As previously shown, GDH2, whose expression is highly Gln3 dependent (Georis et al. 2011), was highly NCR sensitive in wild-type cells; being expressed only in derepressive proline medium (Figure 11A, lanes 1–5). In contrast, GDH2 expression was almost completely abolished in a bmh1Δ,bmh2Δ double mutant (Figure 11A, lanes 6–10). This and the following experiments with the bmh1Δ,bmh2Δ mutant were performed in a Σ1278b background, because Σ1278b is one of the very few strains where a bmh1Δ,bmh2Δ double mutant grows (Roberts et al. 1997).
Figure 11.
NCR-sensitive gene expression is abolished in a bmh1Δ,bmh2Δ mutant, whereas retrograde gene expression becomes constitutive. Wild-type (10560-2B) and bmh1Δ,bmh2Δ (RRY1216) cultures were grown to A600 nm = 0.5 in YNB medium containing the indicated nitrogen source: glutamine (Gln), ammonia (Am.), serine (Ser.), urea, or proline (Pro). Total RNA was then isolated and Northern blots prepared as described in Materials and Methods. Blots were probed for NCR-sensitive [(A) GDH2, (B) DAL80, or (C) DAL5 probes] or retrograde [(D) CIT2] gene expression. H3 was used as the loading control. W.T., wild type.
Similar results were obtained with the NCR-sensitive DAL80 and DAL5 genes (Figure 11, B and C). Note that their decreased NCR sensitivity (expression with urea and serine in addition to proline) correlates with the strong participation of Gat1 in their expression (Coffman et al. 1996, 1997; Cunningham et al. 2000a,b). As with GDH2, their expression was abolished in bmh1Δ,bmh2Δ. Retrograde CIT2 expression was abolished in wild-type glutamine- and proline-grown cells and highly expressed when ammonia was provided as nitrogen source, as previously reported (Tate and Cooper 2003) (Figure 11D, lanes 1–5). In contrast, CIT2 was expressed constitutively in bmh1Δ,bmh2Δ in agreement with Liu et al. (2003, 2005) (Figure 11D, lanes 6–10).
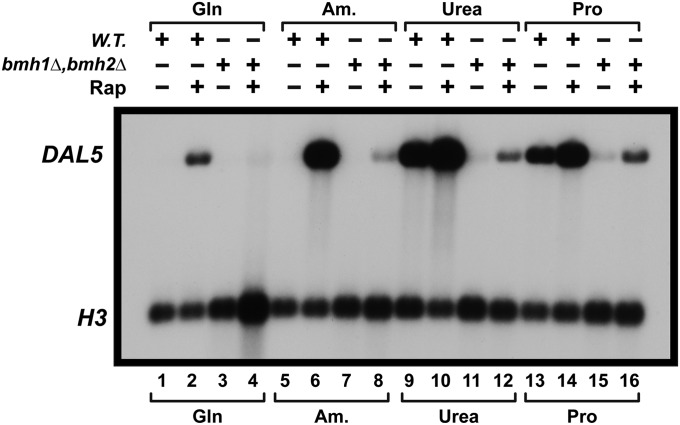
Next we determined whether the response of NCR-sensitive transcription to rapamycin treatment was adversely affected by the loss of Bmh1/2. As shown in Figure 12, the rapamycin response was also drastically diminished, but was not absolutely abolished in bmh1Δ,bmh2Δ. It is important to note that the adverse effects of bmh1Δ,bmh2Δ diminishes as the nitrogen source employed becomes more derepressive. In this strain, the strength of repression order is glutamine > ammonia > urea > proline (Cooper 1982). Yet rapamycin is envisioned to efficiently inhibit mTorC1 downstream of the metabolic signal controlling its activity, making this yet another demonstration of the multipartite regulation of Gln3 function.
Figure 12.
Rapamycin-elicited, NCR-sensitive gene expression is abolished in bmh1Δ,bmh2Δ. Wild type (10560-2B) and bmh1Δ,bmh2Δ (RRY1216) were cultured in YNB medium containing the indicated nitrogen source. The cultures were then treated with 200 ng/ml rapamycin. Northern blots were prepared as described in Materials and Methods. Am., ammonia; Gln, glutamine; Pro, proline; Rap, rapamycin; W.T., wild type.
bmh1Δ,bmh2Δ is epistatic to ure2Δ
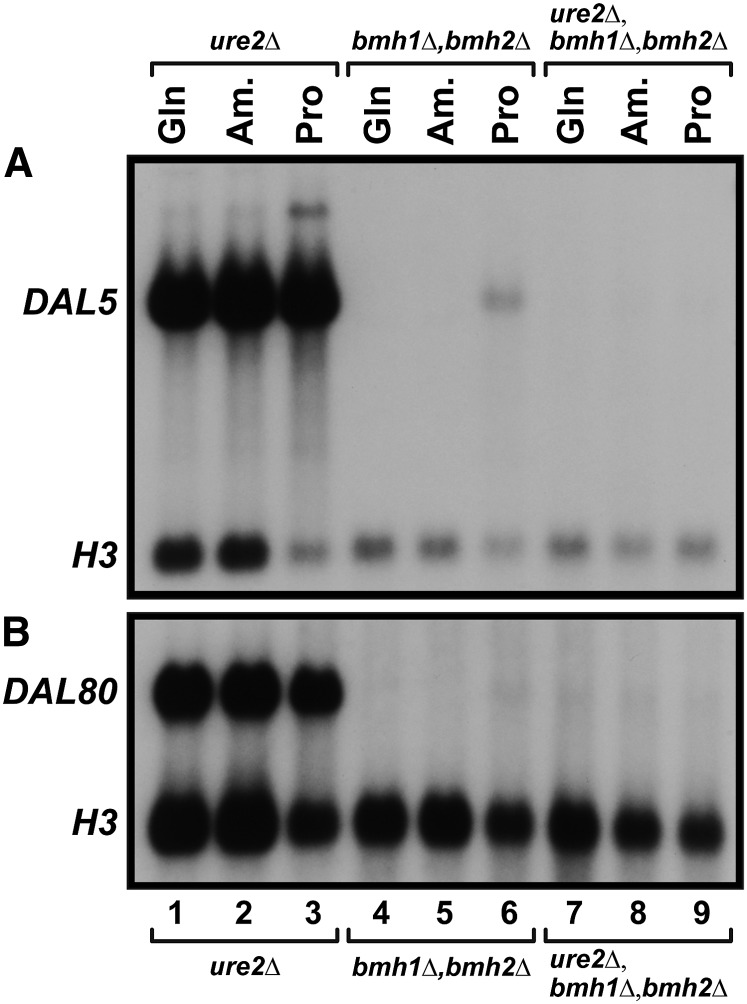
Our next goal was to determine whether Bmh1/2 participated in Gln3 regulation upstream or downstream of Ure2. To this end we performed an epistasis test between bmh1Δ,bmh2Δ and ure2Δ. DAL5 and DAL80 expression was equally robust in glutamine-, ammonia- or proline-grown ure2Δ cells, as expected (Figure 13, A and B, lanes 1–3). In sharp contrast, it was all but undetectable in the bmh1Δ,bmh2Δ mutant (Figure 13, A and B, lanes 4–6). Strikingly, NCR-sensitive DAL5 and DAL80 expression was undetectable in ure2Δ,bmh1Δ,bmh2Δ cells, indicating that bmh1Δ,bmh2Δ was epistatic to ure2Δ. This suggested that Bmh1/2 function downstream of Ure2 in the Gln3 regulatory cascade.
Figure 13.
(A and B) bmh1Δ,bmh2Δ is epistatic to ure2Δ. ure2Δ (RR114), bmh1Δ,bmh2Δ (RRY1216), and ure2Δ, bmh1Δ,bmh2Δ (BS0033a) cells were cultured in YNB medium containing the indicated nitrogen sources. Total RNA was then isolated and Northern blots prepared. These blots were probed for NCR-sensitive gene expression with (A) DAL5 and (B) DAL80 probes. Am., ammonia; Gln, glutamine; Pro, proline.
Bmh1/2 are required for nuclear Gln3-GFP localization
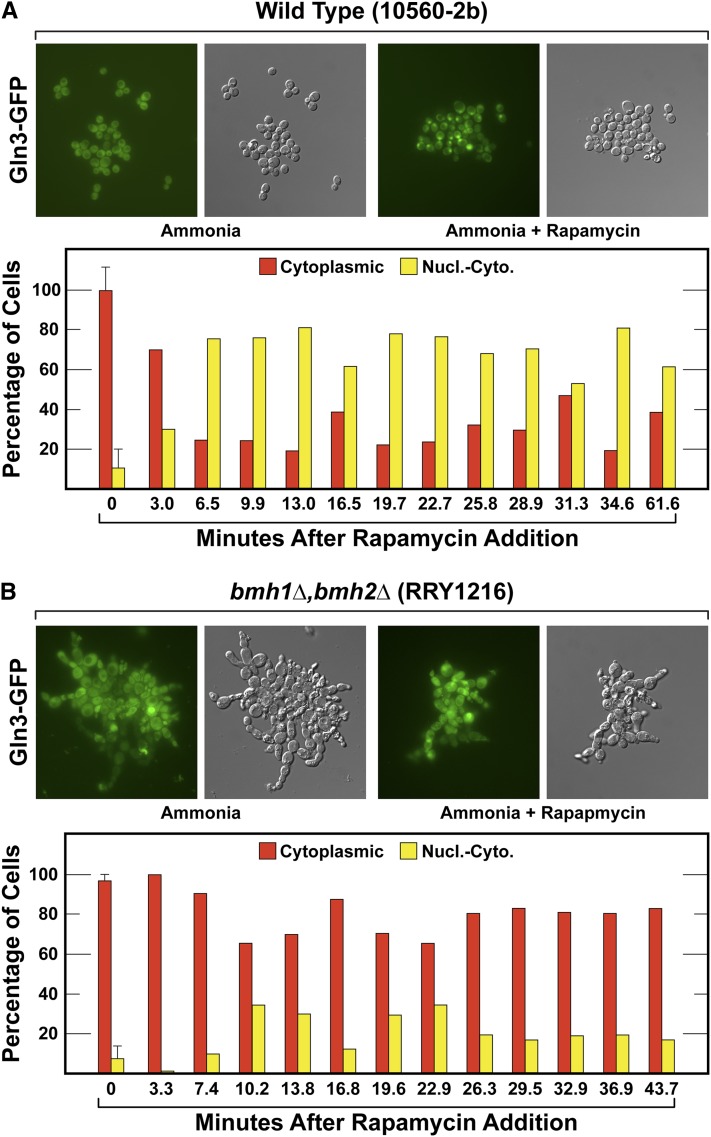
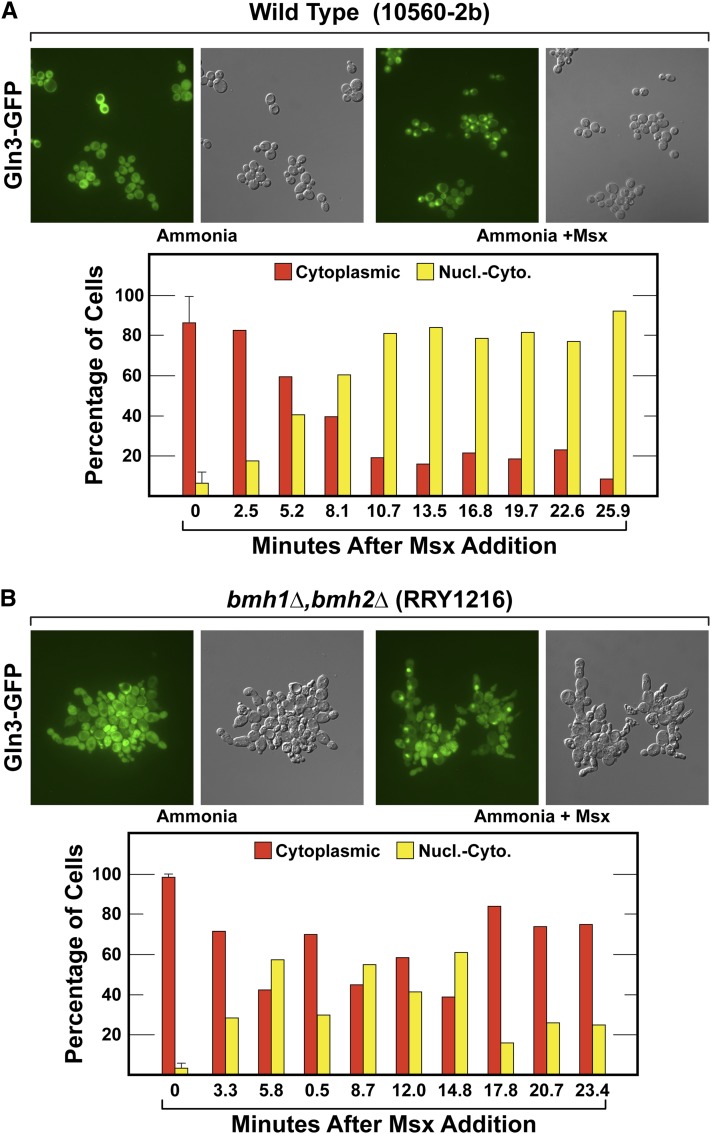
To ascertain whether the requirements for Gln3 localization correlated with NCR-sensitive transcription, we compared its localization in ammonia-grown, rapamycin- or Msx-treated cells (Figure 14 and Figure 15, respectively). This routine experiment turned out to be much more challenging than expected due to a surprising phenotype of the bmh1Δ,bmh2Δ mutations. bmh1Δ,bmh2Δ cells form pseudohyphal-like cell chains similar to those seen in the minor glutamine tRNACUG sup70-65 mutant, making it more difficult to determine Gln3-Myc13 localization (compare Figure 14 and Figure 15 with figure 5 and figure 6 in Tate et al. 2015b). First, as occurred earlier with sup70-65, the bmh1Δ,bmh2Δ cells were too fragile to employ our standard indirect immunofluorescence methodology (Tate et al. 2015b). We thus resorted to the use of Gln3-GFP. Unfortunately, this method does not permit as large a number of cells to be scored, because unconcentrated, growing cultures are being imaged. Further, it is also not possible to confidently distinguish cells where Gln3-GFP is nuclear from those where it is nuclear-cytoplasmic because of the significant background fluorescence in the unaltered images we use for scoring (Tate et al. 2015b). As a result, the nuclear and nuclear-cytoplasmic categories are combined as nuclear-cytoplasmic. Hence point-to-point variation of the data in a time-course experiment is a bit higher than if Gln3-Myc13 were being assayed.
Figure 14.
Nuclear Gln3-GFP localization in response to rapamycin treatment requires Bmh1/2. Gln3-GFP (pRS416-GLN3-GFP) transformants of (A) wild-type (10560-2B) and (B) bmh1Δ,bmh2Δ (RRY1216) cultures were grown in YNB-glutamine medium to a cell density of A600 nm = 0.5. Six samples (two images each) were collected for the zero time point and then pairs of images were collected thereafter for 60 min following rapamycin treatment. As described in the text, Gln3-GFP localization was scored as either completely cytoplasmic or nuclear-cytoplasmic. Nucl.-Cyto., nuclear-cytoplasmic.
Figure 15.
Nuclear Gln3-GFP localization in response to Msx treatment is reduced in bmh1Δ,bmh2Δ. (A) Wild-type (10560-2b) and (B) bmh1Δ,bhm2Δ cells (RRY1216). The experiment was performed as described in Figure 14, except that the cells were treated with Msx for ∼25 min in place of rapamycin. Nucl.-Cyto., nuclear-cytoplasmic.
These difficulties notwithstanding, Gln3-GFP quickly (within 6 min or more) relocated from being cytoplasmic in almost 100% of the wild-type cells to becoming nuclear-cytoplasmic in ∼70–80% following rapamycin treatment (Figure 14A). In contrast, similar Gln3-GFP relocation largely failed to occur in the bmh1Δ,bmh2Δ cells. Gln3-GFP continued to reside in the cytoplasm of ∼70–80% of the cells following the addition of rapamycin (Figure 14B). Although Gln3-GFP partitioning in the bmh1Δ,bmh2Δ cells was not as tight as observed in the transcription experiments, a positive correlation is clearly present.
We then repeated the experiment using Msx in place of rapamycin. In wild-type cells, Gln3-GFP relocated from being cytoplasmic in 80–90% of untreated cells to being only 10–20% cytoplasmic once maximal levels of relocation were achieved following the addition of Msx (Figure 15A). When the experiment was performed with Msx-treated bmh1Δ,bmh2Δ cells, Gln3-GFP was cytoplasmic in nearly 100% of the untreated cells and at most time points did not fall below being 70–80% cytoplasmic (Figure 15B). Although there was greater nuclear Gln3-GFP localization in Msx- than rapamycin-treated cells, it was also decreased in bmh1Δ,bmh2Δ cells.
Loss of Bmh1,Bmh2 increases Gln3-Myc13 mobility in a manner similar to loss of Gcn2
The fact that Bmh1/2 bind to phospho-proteins prompted us to ascertain the effects of abolishing them on Gln3-Myc13 phosphorylation. To that end, we prepared Western blots of extracts from ammonia-grown, untreated or rapamycin-treated, wild-type, and bmh1Δ,bmh2Δ cells. Abolishing Bmh1/2 in untreated cells increased Gln3-Myc13 mobility relative to wild type, indicative of Gln3-Myc13 hypo-phosphorylation (Figure 16A). Recall that increased Gln3-Myc13 mobility also occurred in untreated, ammonia-grown gcn2Δ cells (Figure 9A). Treating wild-type cells with rapamycin generated a similar increase in Gln3-Myc13 dephosphorylation (Figure 16B). In fact, Gln3-Myc13 species exhibited indistinguishable electrophoretic mobilities in rapamycin-treated, wild-type, and bmh1Δ,bmh2Δ cells (Figure 16C). However Gln3-GFP is nuclear in rapamycin-treated wild-type cells, but not in bmh1Δ,bmh2Δ cells.
Figure 16.
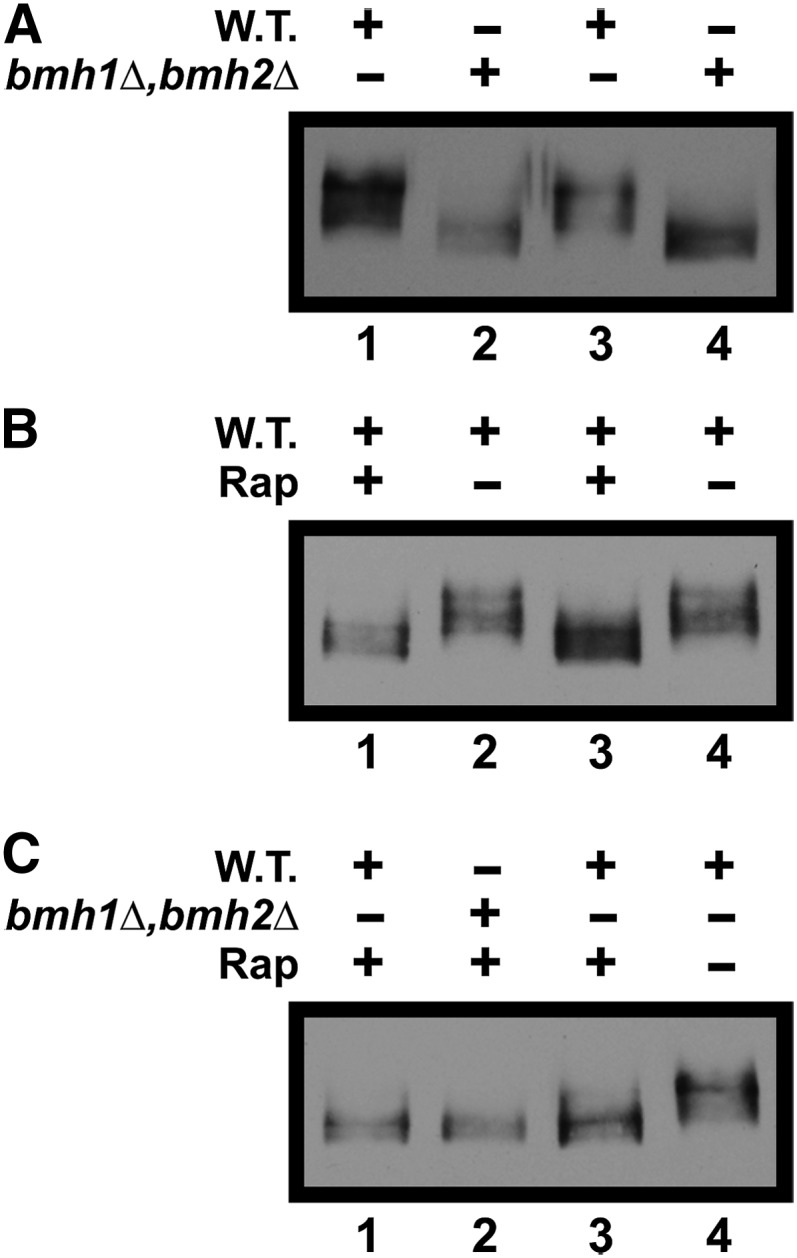
Gln3-Myc13 phosphorylation decreases in a bmh1Δ,bmh2Δ mutant. Wild-type (10560-2B, Panels A-C) and bmh1Δ,bmh2Δ (RRY1216, Panels A and C) cells were cultured to a cell density of A600 nm = 0.5 in YNB-ammonia medium. Cultures were then treated with 200 ng/ml rapamycin where indicated. Extracts of all cultures were then prepared and subjected to western blot analyses as described in Materials and Methods. Rap, rapamycin; W.T., wild type.
Discussion
New regulatory components required for NCR-sensitive Gln3 control
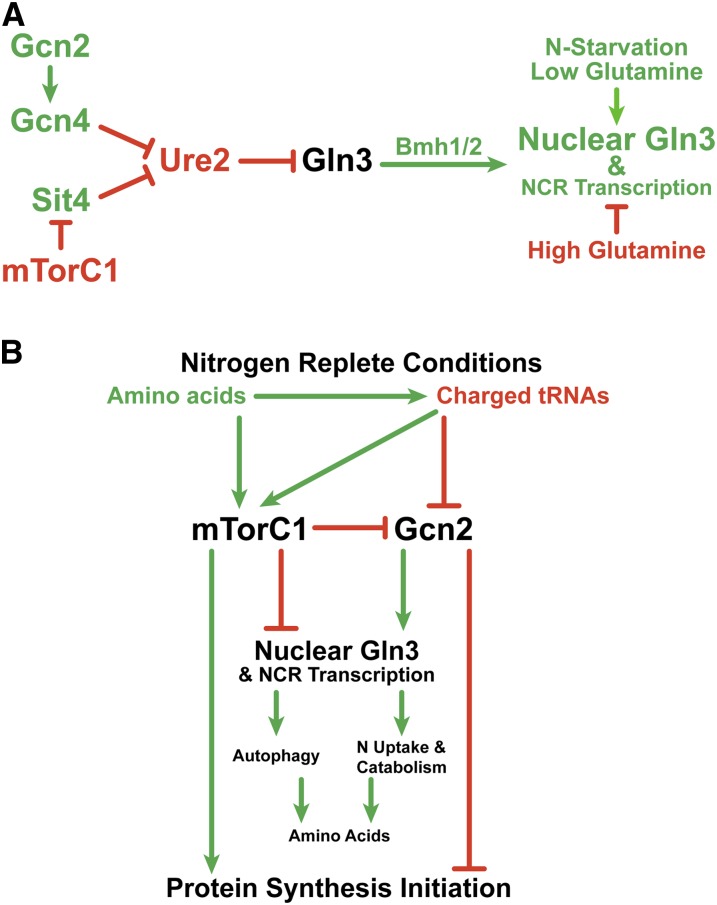
Results presented in this work substantially expand our understanding of GATA factor-mediated, NCR-sensitive regulation by identifying three new important players in the Gln3 nitrogen-responsive cascade: GAAC components, i.e., the Gcn2 protein kinase; the Gcn4 transcription activator; as well as the 14-3-3 phosphoprotein-binding proteins Bmh1/2 (Figure 17A). Epistasis data suggest that Gcn2 functions upstream of Ure2, while Bmh1/2 function downstream of it. Previous data demonstrated that multiple regulatory pathways cumulatively and independently control nitrogen-responsive relocation of Gln3 from the cytoplasm to the nucleus (Rai et al. 2016). mTorC1 represents one of these pathways and the data presented in this work lead us to conclude that GAAC via charged tRNA-mediated regulation of Gcn2 is another. Identification of these two metabolite-proximal global regulators as being cumulatively responsible for NCR-sensitive control of Gln3 relocation from the cytoplasm to the nucleus, and the ability to parse their effects using gln3 amino acid substitution mutants, will significantly facilitate further elucidation of the detailed molecular mechanisms involved.
Figure 17.
Schematic summary of results obtained from experiments presented in this and earlier work. (A) Epistatic relationships of the genes encoding mTorC1, Sit4, Ure2, Gcn2, Gcn4, and Bmh1/2 in the regulation of NCR-sensitive Gln3 localization. Green arrows and designations indicate positive regulation, whereas red bars and designations indicate negative regulation. (B) Description of the global relationships of mTorC1- and Gcn2-mediated regulation on Gln3 localization and protein synthesis when cells are grown in nitrogen-replete medium.
Participation of GAAC components Gcn2 and Gcn4
gcn2 and gcn4 mutant responses to a range of growth conditions precisely correlated with those expected when Gln3 is unable to mediate NCR-sensitive transcription or the GLN3 gene is deleted. Loss of Gcn2 or Gcn4 did not significantly affect growth or Gln3-Myc13 localization in repressive nitrogen sources such as glutamine or asparagine where Gln3 is minimally required. In contrast, growth with nitrogen sources that require nuclear Gln3 localization and Gln3-dependent transcription were drastically decreased along with Gln3-Myc13 phosphorylation when GCN2 or GCN4 were deleted. Positively correlating with these gross growth and phosphorylation responses, nuclear Gln3-Myc13 localization and Gln3-mediated, NCR-sensitive transcription were abolished and drastically diminished following the loss of Gcn2. A similar loss of nuclear Gln3-Myc13 localization occurred upon deleting GCN4. The effects of losing GAAC-mediated Gln3 regulation was not a general, off-target decrease in Gln3 localization. There was high specificity to the effects of deleting GCN2 or GCN4 (Figure 17A). Physiological conditions previously demonstrated to be associated with other modes of Gln3 regulation were unaffected by deleting GCN2 or GCN4: (i) rapamycin inhibition of mTorC1, (ii) Msx inhibition of glutamine synthetase, and (iii) long-term nitrogen starvation. This degree of specificity and correlation argues strongly against the gcn2 and gcn4 mutant phenotypes we report deriving from indirect, off-target effects of the deletions. It is difficult to see, however, how a transcription activator such as Gcn4 could directly influence intracellular Gln3 localization, leading us to conclude that an unidentified, Gcn2/Gcn4-dependent, Gln3 regulator that acts negatively on Ure2 function remains to be found.
This conclusion is most strongly supported by data obtained with the Gln3 substitution mutants, pRR1045 and pRR1194 (Figure 7). When GCN2 and Gln3 residues required for rapamycin-elicited nuclear Gln3 localization (Gln3 rapamycin target) are both wild type, as when pRR536 was transformed into wild-type cells, Gln3-Myc13 is predominantly nuclear. In contrast, when the Gln3 rapamycin target is abolished but GCN2 remains wild type, as when pRR1045 or pRR1194 was transformed into wild-type cells, half of the nuclear Gln3-Myc13 localization is lost and the characteristic tripartite Gln3-Myc13 intracellular distribution is observed. Finally, when both the Gln3 rapamycin target and GCN2 are abolished, as when pRR1045 or pRR1194 was transformed into gcn2Δ cells, the remaining nuclear Gln3-Myc13 localization is lost and Gln3-Myc13 becomes predominantly cytoplasmic. Thus the outcomes of the rapamycin-inhibiting mTorC1 regulatory pathway and presence of the Gcn2 GAAC pathway are cumulatively responsible for nuclear Gln3 localization in proline-grown cells. The unaffected rapamycin response of Gln3 in gcn2Δ (Figure 1) indicates that the rapamycin-sensitive mTorC1- and Gcn2-dependent regulatory pathways are functioning independently.
Opposing mTorC1- and Gcn2/Gcn4-mediated regulation maintains nutrient homeostasis
The effects of nitrogen availability and hence overall amino acid and charged tRNA levels on mTorC1- and Gcn2/Gcn4-mediated control of Gln3 localization is a fascinating example of opposing regulation (Figure 17B). Nitrogen-replete medium elicits opposite effects on these two global regulators but with the same downstream outcomes: High amino acid levels, generated in nitrogen-replete media, minimize the need for NCR-sensitive transcription and, along with charged tRNALeu, activate mTorC1. Activated mTorC1 in turn upregulates protein synthesis initiation and downregulates Gcn2 needed for nuclear Gln3 localization. Additionally, the high levels of charged tRNA in nitrogen excess further downregulate Gcn2 which is required to inactivate protein synthesis initiation and to upregulate nuclear Gln3 localization. Hence, nuclear Gln3 localization fails to occur in nitrogen excess. On the other hand, low amino acid flux, which occurs when scavenging poor nitrogen sources, inactivates mTorC1 and decreases charged tRNA levels, both of which activate Gcn2 and inhibit protein synthesis initiation (Cherkasova and Hinnebusch 2003; Hinnebusch 2005; Staschke et al. 2010; Castilho et al. 2014; Lageix et al. 2015; Dever et al. 2016). Active Gcn2 upregulates nuclear Gln3 localization, thereby increasing the cell’s ability to maintain the supply of nitrogen precursors required for amino acid biosynthesis in an adverse nitrogen environment.
Completing the supply and demand homeostatic circle, the downstream outcomes of Gln3 regulation generate the signals that control both mTorC1 and Gcn2 activities in conditions where the nitrogen supply is limiting. Two major metabolic inputs drive protein synthesis and the signals to which mTorC1 and Gcn2 respond. The internal nitrogen supply derives from vacuolar accumulation of nitrogen-rich compounds (amino acids, allantoin, glutathione, etc.) and protein degradation, fed by autophagic import of cytoplasmic components into the vacuole. The external nitrogen supply derives from cytoplasmic nitrogen supplied by the environment via nitrogenous compound transport into the cell and cytoplasmic degradation/interconversion. Both of these inputs are controlled by Gln3. Supporting this conclusion are the following observations: (i) the transcription of the ATG8 and ATG14 genes encoding critical components of the autophagic pathway are Gln3- and Gat1-dependent (Kirisako et al. 1999; Huang et al. 2000; Chan et al. 2001); (ii) autophagy occurs at high levels in ure2Δ where Gln3/Gat1-activated, NCR-sensitive transcription is constitutive (Noda and Ohsumi 1998); and (iii) transcription of the genes encoding the proteins required for the transport and catabolism of all poor nitrogen sources is NCR-sensitive (Hofman-Bang 1999; Cooper 2002, 2004; Magasanik and Kaiser 2002).
Participation of Bmh1/2 in Gln3 localization and function
The alteration of Gln3 phosphorylation levels by rapamycin and Msx treatments, nitrogen and carbon starvation, nitrogen source identity, as well as abolishment of Sit4 and PP2A subunits, all contributed to our interest in and investigation of the phospho-protein binding 14-3-3 proteins Bmh1/2 (Xiao et al. 1995; Muslin et al. 1996). Growth was poor in bmh1Δ,bmh2Δ under all conditions so that characteristic in itself was not informative. On the other hand, nuclear Gln3 localization was significantly diminished and NCR-sensitive transcription abolished in a bmh1Δ,bmh2Δ mutant. This suggests that Bmh1/2 may well bind to a phosphorylated form of Gln3. Consistent with this suggestion, MS analyses by Kakiuchi et al. (2007) show that Bmh2 and Gln3 interact with one another. One may speculate that a Bmh1/2-Gln3 interaction would stabilize the phosphorylated form of Gln3, and hence their loss would increase Gln3 dephosphorylation as we observe. A formally similar argument was made with respect to the Gln3-Ure2 interaction (Bertram et al. 2000). This, however, does not explain the function of Bmh1/2. The conclusion that Bmh1/2 likely functions downstream of Ure2 and the possibility that the loss of nuclear Gln3-GFP localization in bmh1Δ,bmh2Δ cells was not as absolute as NCR-sensitive transcription raises the pivotal question of whether Bmh1/2 function prior to or after Gln3 enters the nucleus.
Open questions: the functions of Gcn2, Gcn4, Bmh1/2, and their effects on Gln3 phosphorylation
The participation of Gcn4 in Gln3 control was a surprise. How could Gcn4, a highly characterized transcription activator, influence intracellular Gln3 localization? It is true that Gcn4 collaborates with Gln3 in upregulating the expression of a limited number of NCR-sensitive genes containing binding sites for both transcription factors in their promoters, as well as those encoding GLN3 and GAT1 (Mitchell and Magasanik 1984; Natarajan, et al. 2001; Valenzuela et al. 2001, data set URL is no longer active; Riego et al. 2002; Staschke et al. 2010; Hernández et al. 2011). Such collaboration of Gln3 and Gcn4 coactivating transcription might conceptually shift the Gln3 localization balance toward greater dwell times in the nucleus. Hence a gcn2 or gcn4 deletion might, by this reasoning, be expected to shift that balance somewhat toward the cytoplasm. This interpretation, however, fails to account for the observation that Gcn2 likely functions upstream rather than downstream of Ure2 and the very strong effects of the gcn2 and gcn4 deletions on abolishing nuclear Gln3 localization in nitrogen-poor medium. Such extensive cytoplasmic Gln3 sequestration would a priori predict that Gln3- and Gat1-dependent, NCR-sensitive transcription in general would be uniformly affected across the board when GAAC regulation is altered. This was not observed in the studies mentioned above. While some NCR-sensitive genes responded to altered GAAC regulation, other well-characterized NCR-sensitive genes did not. For example, GLT1 was weakly induced, GLN1 expression was repressed, and GDH3 showed little response to 3-aminotriazole (3AT) treatment (Natarajan et al. 2001). CAR1, DAL5, and GAP1 did not respond in the comparison GCN4C/gcn4Δ (Natarajan et al. 2001), and some highly NCR-sensitive genes (ASP1; DAL1; DAL4; DCG1; DUR1,2; PUT4; ATG8; GAT4; and DAL80) were either unaffected or repressed by 3AT treatment (Staschke et al. 2010). Deletion of GCN4 increased expression of DAL5, DAL1, and GAP1 in YPD-grown, rapamycin-treated cells (Valenzuela et al. 2001). In none of these analyses did Gln3-mediated, NCR-sensitive transcription uniformly correlate with GAAC. In short, these earlier studies did not shed much light on GAAC regulation of Gln3 localization in nitrogen-poor medium for two reasons: (i) The promoters of many of the NCR-sensitive genes, including those above, have been dissected and shown to contain a complex array of cis-acting regulatory sites which limit the extent to which transcriptional analyses alone are able to visualize all of the multifactorial regulation that occurs; and (ii) the transcription data were obtained in cells cultured in repressive media, conditions where GCN2 and GCN4 deletions do not exhibit demonstrable effects on Gln3 localization.
The second major question concerns the decreased levels of phosphorylation observed in the bmh1Δ,bmh2Δ, gcn2Δ, and gcn4Δ mutants. A priori this suggests the loss of a phosphorylation function or inhibition of a phosphatase that depends on the GAAC and Bmh1/2 proteins. In this context it is important to note that rapamycin treatment in glutamine-grown cells and deletion of the GCN2, GCN4, or BMH1/2 in proline-grown cells generate Gln3 species with indistinguishable mobilities in SDS gels yet exhibit opposite outcomes on Gln3 localization. Therefore, what is the relationship of Gln3 phosphorylation and dephosphorylation as well as Gcn2 Gcn4, Bmh1/2, and Sit4 functions in the regulation of Gln3 localization and Gln3-mediated transcription? Clearly, much more remains to be done before we will have a detailed molecular model of nitrogen-responsive Gln3 regulation which congruently fits all of the existing experimental data.
Acknowledgments
The authors thank Zhengchang Liu, Evelyne Dubois, and Isabelle Georis for mutant strains; Bill Taylor and the University of Tennessee Molecular Resource Center for assistance with the quantitative RT-PCR experiments; and Thomas Cunningham who performed all of the DNA sequencing associated with this work. The Bmh1/2 experiments formed a portion of D.B.’s doctoral thesis. Supported by National Institutes of Health grant GM-3564227.
Footnotes
Communicating editor: M. Hampsey
Literature Cited
- Bar-Peled L. D. M., Sabatini D. M., 2014. Regulation of mTORC1 by amino acids. Trends Cell Biol. 24: 400–406. [DOI] [PMC free article] [PubMed] [Google Scholar]
- Beck T., Hall M. N., 1999. The TOR signalling pathway controls nuclear localization of nutrient-regulated transcription factors. Nature 402: 689–692. [DOI] [PubMed] [Google Scholar]
- Bertram P. G., Choi J. H., Carvalho J., Ai W., Zeng C., et al. , 2000. Tripartite regulation of Gln3p by TOR, Ure2p, and phosphatases. J. Biol. Chem. 275: 35727–35733. [DOI] [PubMed] [Google Scholar]
- Binda M., Péli-Gulli M. P., Bonfils G., Panchaud N., Urban J., et al. , 2009. The Vam6 GEF controls TORC1 by activating the EGO complex. Mol. Cell 35: 563–573. [DOI] [PubMed] [Google Scholar]
- Binda M., Bonfils G., Panchaud N., Péli-Gulli M. P., De Virgilio C., 2010. An EGOcentric view of TORC1 signaling. Cell Cycle 9: 221–222. [DOI] [PubMed] [Google Scholar]
- Blinder D., Coschigano P. W., Magasanik B., 1996. Interaction of the GATA factor Gln3p with the nitrogen regulator Ure2p in Saccharomyces cerevisiae. J. Bacteriol. 178: 4734–4736. [DOI] [PMC free article] [PubMed] [Google Scholar]
- Bonfils G., Jaquenoud M., Bontron S., Ostrowicz C., Ungermann C., et al. , 2012. Leucyl-tRNA synthetase controls TORC1 via the EGO complex. Mol. Cell 46: 105–110. [DOI] [PubMed] [Google Scholar]
- Broach J. R., 2012. Nutritional control of growth and development in yeast. Genetics 192: 73–105. [DOI] [PMC free article] [PubMed] [Google Scholar]
- Cardenas M. E., Cutler N. S., Lorenz M. C., Di Como C. J., Heitman J., 1999. The TOR signaling cascade regulates gene expression in response to nutrients. Genes Dev. 13: 3271–3279. [DOI] [PMC free article] [PubMed] [Google Scholar]
- Carlson M., Botstein D., 1982. Two differentially regulated mRNAs with different 5′ ends encode secreted and intracellular forms of yeast invertase. Cell 28: 145–154. [DOI] [PubMed] [Google Scholar]
- Carvalho J., Zheng X. F., 2003. Domains of Gln3p interacting with karyopherins, Ure2p, and the target of rapamycin protein. J. Biol. Chem. 278: 16878–16886. [DOI] [PubMed] [Google Scholar]
- Castilho B. A., Shanmugam R., Silva R. C., Ramesh R., Himme B. M., et al. , 2014. Keeping the eIF2 alpha kinase Gcn2 in check. Biochim. Biophys. Acta 1843: 1948–1968. [DOI] [PubMed] [Google Scholar]
- Chan T. F., Bertram P. G., Ai W., Zheng X. F., 2001. Regulation of APG14 expression by the GATA-type transcription factor Gln3p. J. Biol. Chem. 276: 6463–6467. [DOI] [PubMed] [Google Scholar]
- Cherkasova V. A., Hinnebusch A. G., 2003. Translational control by TOR and TAP42 through dephosphorylation of eIF2alpha kinase GCN2. Genes Dev. 17: 859–872. [DOI] [PMC free article] [PubMed] [Google Scholar]
- Coffman J. A., Rai R., Cunningham T., Svetlov V., Cooper T. G., 1996. Gat1p, a GATA family protein whose production is sensitive to nitrogen catabolite repression, participates in transcriptional activation of nitrogen-catabolic genes in Saccharomyces cerevisiae. Mol. Cell. Biol. 16: 847–858. [DOI] [PMC free article] [PubMed] [Google Scholar]
- Coffman J. A., Rai R., Loprete D. M., Cunningham T., Svetlov V., et al. , 1997. Cross regulation of four GATA factors that control nitrogen catabolic gene expression in Saccharomyces cerevisiae. J. Bacteriol. 179: 3416–3429. [DOI] [PMC free article] [PubMed] [Google Scholar]
- Conrad M., Schothorst J., Kankipati H. N., Van Zeebroeck G., Rubio-Texeira M., et al. , 2014. Nutrient sensing and signaling in the yeast Saccharomyces cerevisiae. FEMS Microbiol. Rev. 38: 254–299. [DOI] [PMC free article] [PubMed] [Google Scholar]
- Cooper T. G., 1982. Nitrogen metabolism in Saccharomyces cerevisiae, pp 39–99 in Molecular Biology of the Yeast Saccharomyces: Metabolism and Gene Expression, edited by Strathern J. N., Jones E.W., Broach J. R. Cold Spring Harbor Laboratory, Cold Spring Harbor, NY. [Google Scholar]
- Cooper T. G., 2002. Transmitting the signal of excess nitrogen in Saccharomyces cerevisiae from the Tor proteins to the GATA factors: connecting the dots. FEMS Microbiol. Rev. 26: 223–238. [DOI] [PMC free article] [PubMed] [Google Scholar]
- Cooper T. G., 2004. Integrated regulation of the nitrogen-carbon interface, pp. 225–257 in Nutrient-Induced Responses in Eukaryotic Cells, topics in current genetics, Vol. 7, edited by Winderickx J., Taylor P. M. Springer-Verlag, Berlin. [Google Scholar]
- Cox K. H., Kulkarni A., Tate J. J., Cooper T. G., 2004a Gln3 phosphorylation and intracellular localization in nutrient limitation and starvation differ from those generated by rapamycin inhibition of Tor1/2 in Saccharomyces cerevisiae. J. Biol. Chem. 279: 10270–10278. [DOI] [PMC free article] [PubMed] [Google Scholar]
- Cox K. H., Tate J. J., Cooper T. G., 2002. Cytoplasmic compartmentation of Gln3 during nitrogen catabolite repression and the mechanism of its nuclear localization during carbon starvation in Saccharomyces cerevisiae. J. Biol. Chem. 277: 37559–37566. [DOI] [PMC free article] [PubMed] [Google Scholar]
- Cox K. H., Tate J. J., Cooper T. G., 2004b Actin cytoskeleton is required for nuclear accumulation of Gln3 in response to nitrogen limitation but not rapamycin treatment in Saccharomyces cerevisiae. J. Biol. Chem. 279: 19294–19301. [DOI] [PMC free article] [PubMed] [Google Scholar]
- Crespo J. L., Hall M. N., 2002. Elucidating TOR signaling and rapamycin action: lessons from Saccharomyces cerevisiae. Microbiol. Mol. Biol. Rev. 66: 579–591. [DOI] [PMC free article] [PubMed] [Google Scholar]
- Crespo J. L., Powers T., Fowler B., Hall M. N., 2002. The TOR-controlled transcription activators GLN3, RTG1, and RTG3 are regulated in response to intracellular levels of glutamine. Proc. Natl. Acad. Sci. USA 99: 6784–6789. [DOI] [PMC free article] [PubMed] [Google Scholar]
- Cunningham T. S., Andhare R., Cooper T. G., 2000a Nitrogen catabolite repression of DAL80 expression depends on the relative levels of Gat1p and Ure2p production in Saccharomyces cerevisiae. J. Biol. Chem. 275: 14408–14414. [DOI] [PMC free article] [PubMed] [Google Scholar]
- Cunningham T. S., Rai R., Cooper T. G., 2000b The level of DAL80 expression down-regulates GATA factor-mediated transcription in Saccharomyces cerevisiae. J. Bacteriol. 182: 6584–6591. [DOI] [PMC free article] [PubMed] [Google Scholar]
- Dever T. E., Kinzy T. G., Pavitt G. D., 2016. Mechanism and regulation of protein synthesis in Saccharomyces cerevisiae. Genetics 203: 65–107. [DOI] [PMC free article] [PubMed] [Google Scholar]
- Di Como C. J., Arndt K. T., 1996. Nutrients, via the Tor proteins, stimulate the association of Tap42 with type 2A phosphatases. Genes Dev. 10: 1904–1916. [DOI] [PubMed] [Google Scholar]
- Fayyad-Kazan M., Fellera A., Bodo E., Boeckstaens M., Marini A. M., et al. , 2016. Yeast nitrogen catabolite repression is sustained by signals distinct from glutamine and glutamate reservoirs. Mol. Microbiol. 99: 360–379. [DOI] [PubMed] [Google Scholar]
- Feller A., Georis I., Tate J. J., Cooper T. G., Dubois E., 2013. Alterations in the Ure2 αCap domain elicit different GATA factor responses to rapamycin treatment and nitrogen limitation. J. Biol. Chem. 288: 1841–1855. [DOI] [PMC free article] [PubMed] [Google Scholar]
- Garcia-Barrio M., Dong J., Ufano S., Hinnebusch A. G., 2000. Association of GCN1–GCN20 regulatory complex with the N-terminus of eIF2alpha kinase GCN2 is required for GCN2 activation. EMBO J. 19: 1887–1899. [DOI] [PMC free article] [PubMed] [Google Scholar]
- Georis I., Tate J. J., Cooper T. G., Dubois E., 2008. Tor pathway control of the nitrogen-responsive DAL5 gene bifurcates at the level of Gln3 and Gat1 regulation in Saccharomyces cerevisiae. J. Biol. Chem. 283: 8919–8929. [DOI] [PMC free article] [PubMed] [Google Scholar]
- Georis I., Tate J. J., Cooper T. G., Dubois E., 2011a Nitrogen-responsive regulation of GATA protein family activators Gln3 and Gat1 occurs by two distinct pathways, one inhibited by rapamycin and the other by methionine sulfoximine. J. Biol. Chem. 286: 44897–44912. [DOI] [PMC free article] [PubMed] [Google Scholar]
- Georis I., Tate J. J., Feller A., Cooper T. G., Dubois E., 2011b Intranuclear function for protein phosphatase 2A: Pph21 and Pph22 are required for rapamycin-induced GATA factor binding to the DAL5 promoter in yeast. Mol. Cell. Biol. 31: 92–104. [DOI] [PMC free article] [PubMed] [Google Scholar]
- Hardwick J. S., Kuruvilla F. G., Tong J. K., Shamji A. F., Schreiber S. L., 1999. Rapamycin-modulated transcription defines the subset of nutrient-sensitive signaling pathways directly controlled by the Tor proteins. Proc. Natl. Acad. Sci. USA 96: 14866–14870. [DOI] [PMC free article] [PubMed] [Google Scholar]
- Hernández H., Aranda C., Riego L., González A., 2011. Gln3-Gcn4 hybrid transcriptional activator determines catabolic and biosynthetic gene expression in the yeast Saccharomyces cerevisiae. Biochem. Biophys. Res. Commun. 404: 859–864. [DOI] [PubMed] [Google Scholar]
- Hinnebusch A. G., 2005. Translational regulation of GCN4 and the general amino acid control of yeast. Annu. Rev. Microbiol. 59: 407–450. [DOI] [PubMed] [Google Scholar]
- Hofman-Bang J., 1999. Nitrogen catabolite repression in Saccharomyces cerevisiae. Mol. Biotechnol. 12: 35–73. [DOI] [PubMed] [Google Scholar]
- Huang W. P., Scott S. V., Kim J., Klionsky D. J., 2000. The itinerary of a vesicle component, Aut7p/Cvt5p, terminates in the yeast vacuole via the autophagy/Cvt pathways. J. Biol. Chem. 275: 5845–5851. [DOI] [PubMed] [Google Scholar]
- Ito H., Fukuda Y., Murata K., Kimura A., 1983. Transfomation of intact yeast cells treated with alkali ions. J. Bacteriol. 53: 163–168. [DOI] [PMC free article] [PubMed] [Google Scholar]
- Jiang Y., Broach J. R., 1999. Tor proteins and protein phosphatase 2A reciprocally regulate Tap42 in controlling cell growth in yeast. EMBO J. 18: 2782–2792. [DOI] [PMC free article] [PubMed] [Google Scholar]
- Kakiuchi K., Yamauchi Y., Taoka M., Iwago M., Fujita T., et al. , 2007. Proteomic analysis of in vivo 14-3-3 interactions in the yeast Saccharomyces cerevisiae. Biochemistry 46: 7781–7792. [DOI] [PubMed] [Google Scholar]
- Kemp A. J., Betney R., Ciandrini L., Schwenger A. C., Romano M. C., et al. , 2013. A yeast tRNA mutant that causes pseudohyphal growth exhibits reduced rates of CAG codon translation. Mol. Microbiol. 87: 284–300. [DOI] [PMC free article] [PubMed] [Google Scholar]
- Kim J., Guan K.-L., 2011. Amino acid signaling in TOR activation. Annu. Rev. Biochem. 80: 1001–1032. [DOI] [PubMed] [Google Scholar]
- Kirisako T., Baba M., Ishihara N., Miyazawa K., Ohsumi M., et al. , 1999. Formation process of autophagosome is traced with Apg8/Aut7p in yeast. J. Cell Biol. 147: 435–446. [DOI] [PMC free article] [PubMed] [Google Scholar]
- Krishnamurthy N., Meyer M. R., Jackson B. M., Slade D., Roberts C., et al. , 2001. Transcriptional profiling shows that Gcn4p is a master regulator of gene expression during amino acid starvation in yeast. Mol. Cell. Biol. 21: 4347–4368. [DOI] [PMC free article] [PubMed] [Google Scholar]
- Kulkarni A. A., Abul-Hamd A. T., Rai R., El Berry H., Cooper T. G., 2001. Gln3p nuclear localization and interaction with Ure2p in Saccharomyces cerevisiae. J. Biol. Chem. 276: 32136–32144. [DOI] [PMC free article] [PubMed] [Google Scholar]
- Kulkarni A. A., Buford T. D., Rai R., Cooper T. G., 2006. Differing responses of Gat1 and Gln3 phosphorylation and localization to rapamycin and methionine sulfoximine treatment in Saccharomyces cerevisiae. FEMS Yeast Res. 6: 218–229. [DOI] [PMC free article] [PubMed] [Google Scholar]
- Lageix S., Zhang J., Rothenburg S., Hinnebusch A. G., 2015. Interaction between the tRNA-binding and C-terminal domains of Yeast Gcn2 regulates kinase activity in vivo. PLoS Genet. 11: e1004991. [DOI] [PMC free article] [PubMed] [Google Scholar]
- Lamming D. W., Sabatini D. M., 2013. A Central role for mTOR in lipid homeostasis. Cell Metab. 18: 465–469. [DOI] [PMC free article] [PubMed] [Google Scholar]
- Laplante M., Sabatini D. M., 2012. mTOR signaling in growth control and disease. Cell 149: 274–293. [DOI] [PMC free article] [PubMed] [Google Scholar]
- Liu Z., Sekito T., Spirek M., Thornton J., Butow R. A., 2003. Retrograde signaling is regulated by the dynamic interaction between Rtg2p and Mks1p. Mol. Cell 12: 401–411. [DOI] [PubMed] [Google Scholar]
- Liu Z., Spirek M., Thornton J., Butow R. A., 2005. A novel degron-mediated degradation of the RTG pathway regulator, Mks1p, by SCFGrr1. Mol. Biol. Cell 16: 4893–4904. [DOI] [PMC free article] [PubMed] [Google Scholar]
- Ljungdahl P. O., Daignan-Fornier B., 2012. Regulation of amino acid, nucleotide, and phosphate metabolism in Saccharomyces cerevisiae. Genetics 190: 885–929. [DOI] [PMC free article] [PubMed] [Google Scholar]
- Loewith R., Hall M. N., 2011. Target of Rapamycin (TOR) in nutrient signaling and growth control. Genetics 189: 1177–1201. [DOI] [PMC free article] [PubMed] [Google Scholar]
- Magasanik B., Kaiser C. A., 2002. Nitrogen regulation in Saccharomyces cerevisiae. Gene 290: 1–18. [DOI] [PubMed] [Google Scholar]
- Miller S. M., Magasanik B., 1991. Role of the complex upstream region of the GDH2 gene in nitrogen regulation of the NAD-linked glutamate dehydrogenase in Saccharomyces cerevisiae. Mol. Cell. Biol. 11: 6229–6247. [DOI] [PMC free article] [PubMed] [Google Scholar]
- Mitchell A. P., Magasanik B., 1984. Three regulatory systems control production of glutamine synthetase in Saccharomyces cerevisiae. Mol. Cell. Biol. 4: 2767–2773. [DOI] [PMC free article] [PubMed] [Google Scholar]
- Muslin A. J., Tanner J. W., Allen P. M., Shaw A. S., 1996. Interaction of 14-3-3 with signaling proteins is mediated by the recognition of phosphoserine. Cell 84: 889–897. [DOI] [PubMed] [Google Scholar]
- Natarajan K., Meyer M. R., Jackson B. M., Slade D., Roberts C., et al. , 2001. Transcriptional profiling shows that Gcn4p is a master regulator of gene expression during amino acid starvation in yeast. Mol. Cell. Biol. 21: 4347–4368. [DOI] [PMC free article] [PubMed] [Google Scholar]
- Noda T., Ohsumi Y., 1998. Tor, a phosphatidylinositol kinase homologue, controls autophagy in yeast. J. Biol. Chem. 273: 3963–3966. [DOI] [PubMed] [Google Scholar]
- Parua P. K., Young E. T., 2014. Binding and transcriptional regulation by 14-3-3 (Bmh) proteins requires residues outside of the canonical motif. Eukaryot. Cell 13: 21–30. [DOI] [PMC free article] [PubMed] [Google Scholar]
- Parua P. K., Ratnakumar S., Braun K. A., Dombek K. M., Arms E., et al. , 2010. 14-3-3 (Bmh) proteins inhibit transcription activation by Adr1 through direct binding to its regulatory domain. Mol. Cell. Biol. 30: 5273–5283. [DOI] [PMC free article] [PubMed] [Google Scholar]
- Rai R., Tate J. J., Nelson D. R., Cooper T. G., 2013. gln3 mutations dissociate responses to nitrogen limitation (nitrogen catabolite repression) and rapamycin inhibition of TorC1. J. Biol. Chem. 288: 2789–2804. [DOI] [PMC free article] [PubMed] [Google Scholar]
- Rai R., Tate J. J., Shanmuganatham K., Howe M. M., Cooper T. G., 2014. A domain in the transcription activator Gln3 specifically required for rapamycin responsiveness. J. Biol. Chem. 289: 18999–19018. [DOI] [PMC free article] [PubMed] [Google Scholar]
- Rai R., Tate J. J., Shanmuganatham K., Howe M. M., Nelson D., et al. , 2015. Nuclear Gln3 import is regulated by nitrogen catabolite repression whereas export is specifically regulated by glutamine. Genetics 201: 989–1016. [DOI] [PMC free article] [PubMed] [Google Scholar]
- Rai R., Tate J. J., Cooper T. G., 2016. Multiple targets on the Gln3 transcription activator are cumulatively required for control of its cytoplasmic sequestration. G3 6: 1391–1408. [DOI] [PMC free article] [PubMed] [Google Scholar]
- Riego L., Avendaño A., DeLuna A., Rodríguez E., González A., 2002. GDH1 expression is regulated by GLN3, GCN4, and HAP4 under respiratory growth. Biochem. Biophys. Res. Commun. 293: 79–85. [DOI] [PubMed] [Google Scholar]
- Roberts R. L., Mösch H. U., Fink G. R., 1997. 14-3-3 proteins are essential for RAS/MAPK cascade signaling during pseudohyphal development in S. cerevisiae. Cell. 89: 1055–1065. [DOI] [PubMed] [Google Scholar]
- Robertson L. S., Causton H. C., Young R. A., Fink G. R., 2000. The yeast A kinases differentially regulate iron uptake and respiratory function. Proc. Natl. Acad. Sci. USA 97: 5984–5988. [DOI] [PMC free article] [PubMed] [Google Scholar]
- Schmelzle T., Beck T., Martin D. E., Hall M. N., 2004. Activation of the RAS/cyclic AMP pathway suppresses a TOR deficiency in yeast. Mol. Cell. Biol. 24: 338–351. [DOI] [PMC free article] [PubMed] [Google Scholar]
- Schmitt M. E., Brown T. A., Trumpower B. L., 1990. A rapid and simple method for preparation of RNA from Saccharomyces cerevisiae. Nucleic Acids Res. 18: 3091–3092. [DOI] [PMC free article] [PubMed] [Google Scholar]
- Shimobayashi M., Hall M. N., 2016. Multiple amino acid sensing inputs to mTorC1. Cell Res. 26: 7–20. [DOI] [PMC free article] [PubMed] [Google Scholar]
- Sosa E., Aranda C., Riego L., Valenzuela L., DeLuna A., et al. , 2003. Gcn4 negatively regulates expression of genes subjected to nitrogen catabolite repression. Biochem. Biophys. Res. Commun. 310: 1175–1180. [DOI] [PubMed] [Google Scholar]
- Staschke K. A., Dey S., Zaborske J. M., Palam L. R., McClintick J. N., et al. , 2010. Integration of general amino acid control and target of rapamycin (TOR) regulatory pathways in nitrogen assimilation in yeast. J. Biol. Chem. 285: 16893–16911. [DOI] [PMC free article] [PubMed] [Google Scholar]
- Stauffer B., Powers T., 2016. Target of rapamycin signaling mediates vacuolar fragmentation. Curr. Genet. DOI: 10.1007/s00294-016-0616-0. [DOI] [PMC free article] [PubMed] [Google Scholar]
- Swinnen E., Ghillebert R., Wilms T., Winderickx J., 2014. Molecular mechanisms linking the evolutionary conserved TORC1-Sch9 nutrient signalling branch to lifespan regulation in Saccharomyces cerevisiae. FEMS Yeast Res. 14: 17–32. [DOI] [PubMed] [Google Scholar]
- Tate J. J., Cooper T. G., 2003. Tor1/2 regulation of retrograde gene expression in Saccharomyces cerevisiae derives indirectly as a consequence of alterations in ammonia metabolism. J. Biol. Chem. 278: 36924–36933. [DOI] [PMC free article] [PubMed] [Google Scholar]
- Tate J. J., Cooper T. G., 2007. Stress-responsive Gln3 localization in Saccharomyces cerevisiae is separable from and can overwhelm nitrogen source regulation. J. Biol. Chem. 282: 18467–18480. [DOI] [PMC free article] [PubMed] [Google Scholar]
- Tate J. J., Cooper T. G., 2013. Five conditions commonly used to down-regulate tor complex 1 generate different physiological situations exhibiting distinct requirements and outcomes. J. Biol. Chem. 288: 27243–27262. [DOI] [PMC free article] [PubMed] [Google Scholar]
- Tate J. J., Feller A., Dubois E., Cooper T. G., 2006. Saccharomyces cerevisiae Sit4 phosphatase is active irrespective of the nitrogen source provided, and Gln3 phosphorylation levels become nitrogen source-responsive in a sit4-deleted strain. J. Biol. Chem. 281: 37980–37992. [DOI] [PMC free article] [PubMed] [Google Scholar]
- Tate J. J., Georis I., Feller A., Dubois E., Cooper T. G., 2009. Rapamycin-induced Gln3 dephosphorylation is insufficient for nuclear localization: Sit4 and PP2A phosphatases are regulated and function differently. J. Biol. Chem. 284: 2522–2534. [DOI] [PMC free article] [PubMed] [Google Scholar]
- Tate J. J., Georis I., Dubois E., Cooper T. G., 2010. Distinct phosphatase requirements and GATA factor responses to nitrogen catabolite repression and rapamycin treatment in Saccharomyces cerevisiae. J. Biol. Chem. 285: 17880–17895. [DOI] [PMC free article] [PubMed] [Google Scholar]
- Tate J. J., Georis I., Rai R., Vierendeels F., Dubois E., et al. , 2015a GATA factor regulation in excess nitrogen occurs independently of Gtr-Ego complex-dependent TorC1 activation. G3 (Bethesda) 5: 1625–1638. [DOI] [PMC free article] [PubMed] [Google Scholar]
- Tate J. J., Rai R., Cooper T. G., 2015b Nitrogen starvation and TorC1 inhibition differentially affect nuclear localization of the Gln3 and Gat1 transcription factors through the rare glutamine tRNACUG in Saccharomyces cerevisiae. Genetics 199: 455–474. [DOI] [PMC free article] [PubMed] [Google Scholar]
- Valenzuela L., Aranda C., Gonzalez A., 2001. TOR modulates GCN4-dependent expression of genes turned on by nitrogen limitation. J. Bacteriol. 183: 2331–2334. [DOI] [PMC free article] [PubMed] [Google Scholar]
- van Heusden G. P., 2009. 14-3-3 Proteins: insights from genome-wide studies in yeast. Genomics 94: 287–293. [DOI] [PubMed] [Google Scholar]
- van Heusden G. P., Steensma H. Y., 2006. Yeast 14-3-3 proteins. Yeast 23: 159–171. [DOI] [PubMed] [Google Scholar]
- Wach A., Brachat A., Pöhlmann R., Philippsen P., 1994. New heterologous modules for classical or PCR-based gene disruptions in Saccharomyces cerevisiae. Yeast 10: 1793–1808. [DOI] [PubMed] [Google Scholar]
- Wang H., Wang X., Jiang Y., 2003. Interaction with Tap42 is required for the essential function of Sit4 and type 2A phosphatases. Mol. Biol. Cell 14: 4342–4351. [DOI] [PMC free article] [PubMed] [Google Scholar]
- Watson T. G., 1977. Inhibition of proline utilization by glutamate during steady state growth of Saccharomyces cerevisiae. J. Gen. Microbiol. 103: 123–126. [Google Scholar]
- Xiao B., Smerdon S. J., Jones D. H., Dodson G. G., Soneji Y., et al. , 1995. Structure of a 14-3-3 protein and implications for coordination of multiple signalling pathways. Nature 376: 188–191. [DOI] [PubMed] [Google Scholar]
- Yan G., Shen X., Jiang Y., 2006. Rapamycin activates Tap42-associated phosphatases by abrogating their association with Tor complex 1. EMBO J. 25: 3546–3555. [DOI] [PMC free article] [PubMed] [Google Scholar]
Associated Data
This section collects any data citations, data availability statements, or supplementary materials included in this article.


