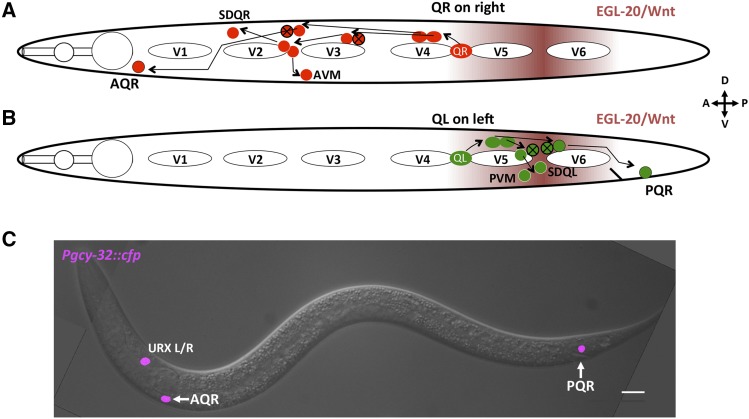
Figure 1.
Migration of QR and QL descendants. (A and B) Diagrams representing the migration and cell division pattern of QR on the right side (A) and QL on the left side (B) in the L1 animal, showing birthplace of the Q neuroblasts and approximate locations of the Q descendants. Maroon shading represents the posteriorly derived EGL-20/Wnt signal. White ovals are hypodermal seam cells V1–V6. Circles with black X indicate cells that undergo programmed cell death after cell division. Dorsal is up, anterior to the left. (C) Merged DIC and fluorescent micrograph showing location of Q descendants AQR and PQR in an adult wild-type animal. Pgcy-32::cfp is expressed in AQR, PQR, and URXL/R. Bar, 10 μM.

