Figure 2.
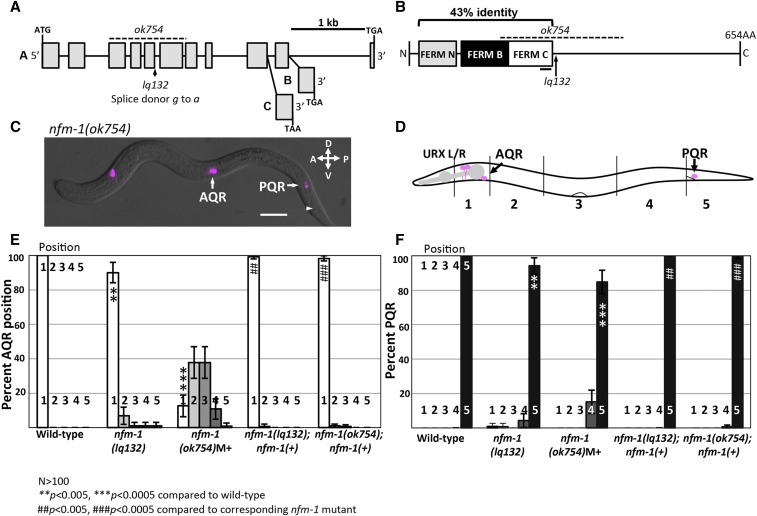
Position of Q descendants AQR and PQR in nfm-1 mutants. (A) Diagram of the nfm-1 locus and alleles used. The ok754 deletion (dashed line) and lq132 splice site mutation (arrow) are noted. The alternate 3′ exon use in the three nfm-1 isoforms A–C are shown (from WormBase). (B) NFM-1 isoform A domain structure and allele locations are shown. The FERM domain lobes N (gray), B (black), and C (white) are shown. The black bar under FERM C represents predicted actin-binding motif. The dashed line is ok754 in-frame deletion, and lq132 splice donor mutation location is marked by an arrow. NF2 and NFM-1 show 43% identity throughout the FERM N, B, and C regions. (C) Merged DIC and fluorescent micrograph of an nfm-1(ok754) arrested larval mutant animal. Both AQR and PQR failed to migrate (PQR wild-type position noted by arrowhead). Bar, 10 μM. (D) Diagram of scoring positions in an L4 animal used in E and F, with wild-type locations of AQR and PQR shown as magenta circles. (E and F) Chart showing percent of AQR (E) or PQR (F) in positions 1–5 in different genotypes as shown in D. All animals unless otherwise noted were scored using lqIs58 (Pgcy-32::cfp). M+ indicates animals were scored from heterozygous mother and have wild-type maternal contribution of nfm-1. nfm-1(+) animals harbor the array containing the nfm-1::gfp fosmid. Asterisks indicate degree of significance of difference from wild-type (N > 100; * P < 0.05, ** P < 0.005, *** P < 0.0005, Fisher’s exact test). Pound signs indicate, for that position, a significant rescue of corresponding nfm-1 mutant (N > 100; # P < 0.05, ## P < 0.005, ### P < 0.0005, Fisher’s exact test). Error bars represent two times the SE of the proportion in each direction.

