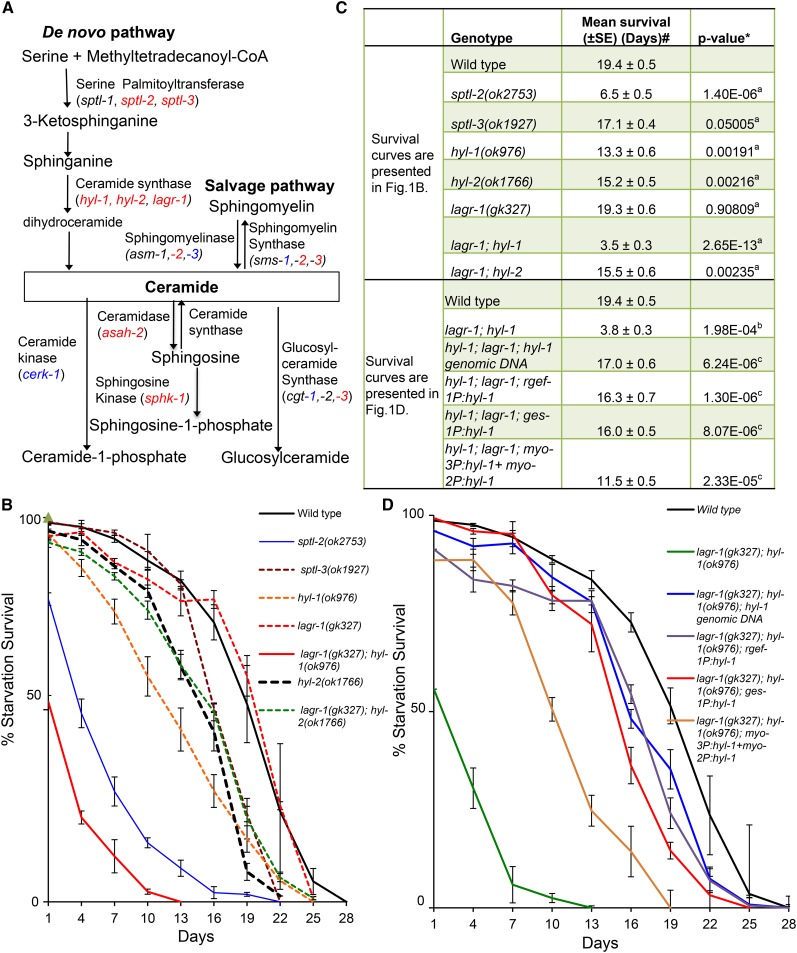
Figure 1.
Ceramide functions to promote L1 starvation survival. (A) Simplified diagram to illustrate the C. elegans orthologs of genes involved in ceramide biosynthesis and metabolism. Deletion mutations of genes in red, but not genes in blue, displayed a significant defect in L1 starvation survival (see Table S1 for raw data and statistical analysis). Genes that are not highlighted with red or blue color are not included in L1 starvation study due to unavailable mutants, or the mutation of that gene resulting larval lethality. (B) Survival rates of ceramide synthesis reduction mutants [lagr-1(gk327); hyl-1(ok976) is referred as CerS(rf) in all figures]. Percentage survival is defined as the percentage of worms surviving to the third larval stage and beyond on NGM plates with OP50 bacteria after incubation in S-basal buffer in the absence of food for the indicated time. Data of each strain represent the mean of three or more independent biological replicates. Errors bars are the SEs at each time point indicated. (C) The mean survival rate of individual replicates was calculated through OASIS software available at http://sbi.postech.ac.kr/oasis (Yang et al. 2011). #The average of the mean survival rate of all individual replicates for each strain is presented here. *The statistical analyses (P value) to assess the difference between the mean survival rates were conducted using Student’s t-test. a,b,cP values indicate the significance of the difference from wild type in (B) (aP), wild type in (D) (bP) and lagr-1(gk327); hyl-1(ok976) mutant animals in (D) (cP), respectively. (D) Starvation survival rate of the CerS(rf) L1 mutant animals carrying extrachromosomal arrays expressing the wild-type hyl-1 gene driven by its own promoter, and three other tissue specific promoters [intestine (ges-1), pan-neurons (rgef-1), and muscle (myo-2/myo-3)]. Transgenic animals were scored on the basis of the expression of the sur-5P:dsRed coinjection marker with a Leica fluorescence microscope. Percentage survival is defined as the percentage of animals surviving to the third larval stage and beyond on food after L1 worms were starved in S-basal buffer for the indicated time. The average from multiple independent transgenic lines for each genotype is reported with the SEM for each time point (±SEM). The starvation survival data for wild-type animals are the same as that presented in (B). Raw data and the statistical analysis data for individual starvation survival experiments for (B) and (D) are presented in Table S1.

