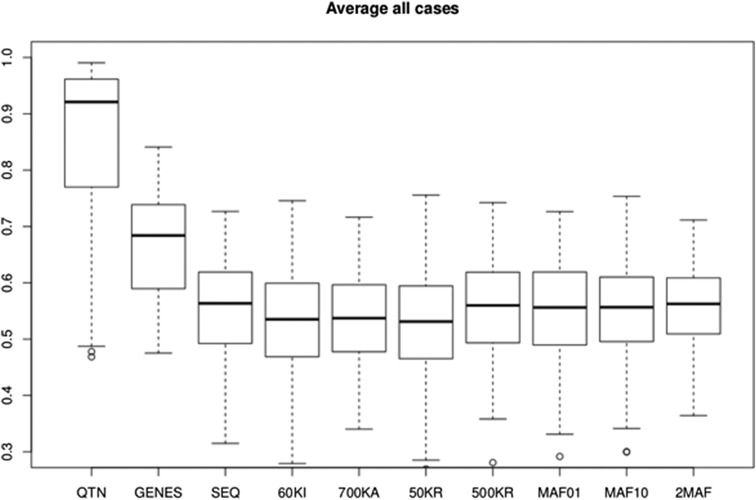
Figure 7.
Average performance of different models using GBLUP. Shown are accuracies across all scenarios and genetic architectures considered in this work. Values reported are accuracies, defined as squared correlation between true and predicted genetic values. Models shown are: QTN, GRM computed with all QTNs; SEQ, all SNPs; 60KI, Illumina’s 60k array; 700KA, Affymetrix; 50KR, 50,000 random SNPs; 500KR, 500,000 random SNPs; MAF01, 1 million SNPs with MAF < 0.01; MAF10, 1 million SNPs with MAF > 0.1; 2MAF, the model uses MAF01 and MAF10; and GENES, GRM obtained with the SNPs segregating in any of the genes containing a QTN. GBLUP, genomic best linear unbiased prediction; MAF, minimum allele frequency; QTN, quantitative trait nucleotide.

