Abstract
Light-sheet fluorescence microscopy (LSFM) is an optical sectioning technique capable of rapid three-dimensional (3D) imaging of a wide range of specimens with reduced phototoxicity and superior background rejection. However, traditional light-sheet generation approaches based on elliptical or circular Gaussian beams suffer an inherent trade-off between light-sheet thickness and area over which this thickness is preserved. Recently, an increase in light-sheet uniformity was demonstrated using rapid biaxial Gaussian beam scanning along the lateral and beam propagation directions. Here we apply a similar scanning concept to an elliptical beam generated by a cylindrical lens. In this case, only z-scanning of the elliptical beam is required and hence experimental implementation of the setup can be simplified. We introduce a simple dimensionless uniformity statistic to better characterize scanned light-sheets and experimentally demonstrate custom tailored uniformities up to a factor of 5 higher than those of un-scanned elliptical beams. This technique offers a straightforward way to generate and characterize a custom illumination profile that provides enhanced utilization of the detector dynamic range and field of view, opening the door to faster and more efficient 2D and 3D imaging.
OCIS codes: (180.2520) Fluorescence microscopy, (180.6900) Three-dimensional microscopy, (110.1080) Active or adaptive optics
1. Introduction
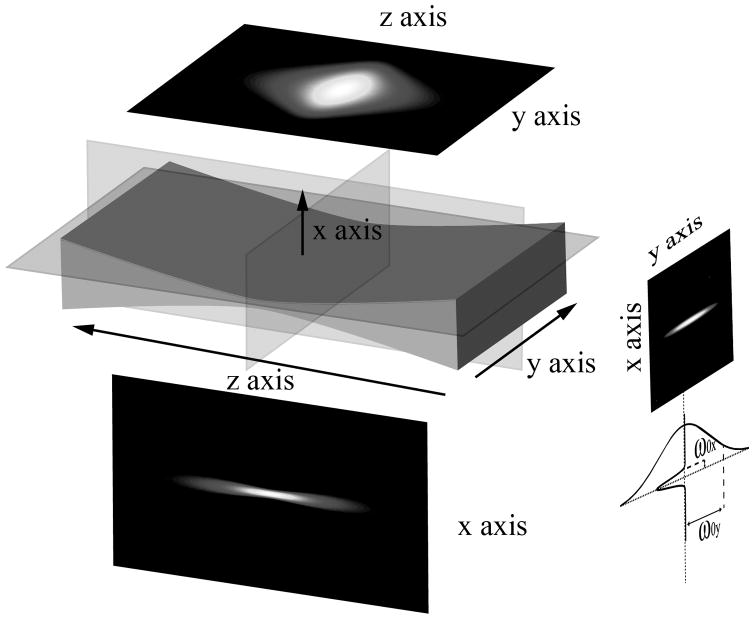
In the quest for an optical technique capable of characterizing dynamic 3D biological systems, light-sheet fluorescence microscopy (LSFM) is particularly well positioned due to its unique combination of high-parallelization, optical sectioning capability and minimal phototoxicity (Huisken et al., 2004; Huisken and Stainier, 2009; Keller et al., 2008; Truon et al., 2011). Such characteristics are the result of the particular layout of a traditional LSFM setup: excitation, in the form of a thin sheet of light, is performed parallel to the imaging plane (Greger et al., 2007). In this way, a thin section of a 3D sample can be captured in a single camera frame with the axial imaging performance primarily limited by the characteristics of the light-sheet. In particular, the thickness of the light-sheet determines the optical sectioning capabilities of the system, whereas the area over which a suitable thickness is maintained limits the usable field of view. Ideally, one would like to generate light-sheets as thin as possible over the entire field of view of the imaging objective. The most common conventional LSFM approaches include selective plane illumination microscopy (SPIM) (Huisken et al., 2004) and digital scanned laser light-sheet fluorescence microscopy (DSLM) (Keller et al., 2008). Both methods suffer an inherent trade-off between light-sheet thickness and uniformity analogous to the decrease in depth of focus for a large numerical aperture lens. One way to alleviate this problem is to use non-traditional beam shapes. In particular, the use of the diffraction-free beams including Bessel beams (Planchon et al., 2011; Fahrback et al., 2010; Fahrbach et al., 2012), sectioned Bessel beams (Fahrbach et al., 2013), Airy beams (Vettenburg et al., 2014), or optical lattices (Chet et al., 2014), enables extended uniformity without significantly sacrificing thickness and improving spatiotemporal resolution. Such an improvement, however, comes at the cost of a more complex optical design that may require significant post-acquisition analysis. Alternatively, it has been recently demonstrated that a Gaussian beam rapidly scanned biaxially (along the y and z axes – see Figure 1) results in significant uniformity enhancement with minimal loss in light-sheet thickness (Dean and Fiolka, 2014; Dean et al., 2015; Zong et al., 2014). In this case, a circular Gaussian beam is laterally scanned (y-axis) to generate the light-sheet in a DSLM setup and further scanned along the beam propagation direction (z-axis) to provide extended uniformity. Generally, one axis must scan at a far higher rate than the other and some care must be taken to avoid patterned illumination that does not fully cover space (e.g. Lissajous figures). In addition, to reconstruct a complete volumetric image, translation of the light-sheet relative to the sample is still needed so that scanning in three directions of space is still required.
Figure 1.
Normalized cross-sectional intensity maps of an elliptical beam in the paraxial approximation where the beam propagates along the z-axis. The minimal width of the beam in the x and y directions, ω0x and ω0y where intensity drops by a factor of 1/e2 from the principal axis, are shown on the far right.
Here, we apply the concept of z-axis scanning using a variable focus optic to improve the uniformity of a light-sheet generated in a SPIM setup. Due to the sheet-like nature of the beam produced by a cylindrical lens, this approach requires one fewer scan directions than DSLM and, hence, offers advantages in imaging speed and simplicity of setup. In addition, the possibility to use lower intensities in SPIM compared to the high local intensities of DSLM can also be beneficial in terms of photobleaching and phototoxicity. To better standardize the measure of uniformity we develop a statistic that informs the fractional improvement in uniformity relative to the un-scanned beam. Using this new statistic, we present the results of a paraxial simulation that assesses the relative increase in uniformity created by z-scanning of an elliptical and circular Gaussian beam. The scanning approach is experimentally validated by imaging fluorescent beads. Our experiments demonstrate that the uniformity of axially scanned elliptical beams can be more than a factor of 5 larger than traditional un-scanned elliptical light-sheets.
2. Materials and Methods
2.1 Light-sheet uniformity
We start by defining a statistic to evaluate the uniformity of a light-sheet along its principal axis generated by axially scanning a Gaussian beam. Notably, in the case of a circular Gaussian beam, the ratio of the axial beam extent as characterized by the Rayleigh range ZR (where the thickness is a factor of larger than the beam waist) to the beam waist ω0x provides a first indication of the beam uniformity. Ideally, one would like this ratio to be as large as possible before lateral scanning (y-axis) to produce a light-sheet. However, for a standard Gaussian beam under the paraxial approximation (low NA objectives, NA<0.5, are typically used in LSFM) this ratio is fixed and given by (Appendix):
| (1) |
Note that, for a light-sheet generated by uniform lateral (y-axis) scanning of a Gaussian beam, Equation 1 is still valid with ω0x being the minimum light-sheet thickness in the center of the light sheet which would be used for imaging. In the case of an elliptical beam generated by a cylindrical lens (no lateral scanning required), Equation 1 also holds with the caveat that at the Rayleigh range the intensity is only reduced by below the intensity at the focus (Appendix).
The linear decrease of the ratio ZR/ω0x with NA described in Equation 1 constitutes a fundamental feature of traditional light-sheets: choosing high NA optics that maximize optical sectioning (minimize ω0x) leads to a significant limitation of the usable, uniformly illuminated area of the camera field of view; choosing low NA optics that maximize axial extent leads to thick light sheets. However, in the case of either axially scanned elliptical or circular beams, the time-averaged shape of the beam no longer retains a Gaussian cross-section along the x-axis. In this case, ω0x no longer clearly represents the light-sheet thickness. Consequently, the restriction imposed by Equation 1 does not strictly apply to the time-averaged beam. One way to address the non-Gaussian cross-section and avoid the bias of a Gaussian-based statistic is to instead consider the full width at half maximum (FWHM), which can be ubiquitously measured but is still directly proportional to ω0x in the case of an unscanned Gaussian beam. With this in mind, we define a uniformity statistic U suitable for both scanned and un-scanned beams as:
| (2) |
where the FWHM is related to ω0x through the equation . As defined, the value of U will be identically one for an un-scanned light-sheet of any numerical aperture NA. For other beam shapes, such as the axially scanned elliptical beams presented in this manuscript, we expect a smooth transition to a different value of U that represents the fractional change in uniformity relative to an un-scanned beam.
2.2 Simulations
A comparison of the salient characteristics of simulated light-sheets with and without z-scanning is shown in Figure 2 and Figure 3. All simulations are carried out using the paraxial approximation. In general, a 3D Gaussian beam (with circular or elliptical cross section) is uniformly translated through different axial ranges and the integrated intensity profile is evaluated. From this intensity, we determine the beam confocal parameter (defined as 2ZR) and the FWHM at the axial focus from which we calculate the corresponding uniformity U. The results are numerically evaluated using MatLab. Note that the generation of a light sheet from a circular Gaussian beam requires additional y-scanning that is typically much slower than the z-scanning to prevent the introduction of undesired spatial structure. Under these conditions, the analysis presented herein is unaffected by y-scanning.
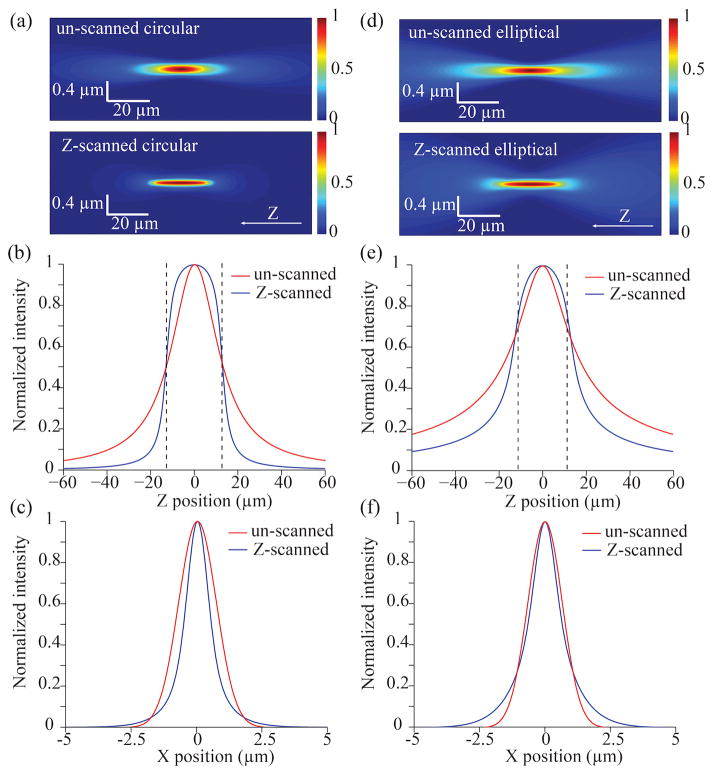
Figure 2.
Simulation of the paraxial focusing characteristics of light-sheets generated using different methods. Colormap intensity cross-sections (XZ plane) of light-sheets generated with (bottom) and without (top) axial scanning of (a) a circular DSLM-style beam and (d) an elliptical SPIM-style beam. The cross-sections corresponding to z-scanning are calculated for an objective lens with a numerical aperture of 0.25 and a scanning range of 25 μm. In the absence of z-scanning, the cross-section is calculated using a different numerical aperture objective (NA=0.09) that results in the same confocal parameter as the scanning counterpart. The corresponding intensity profiles along the z and x directions for circular (b,c) and elliptical (e,f) beams demonstrate a flattened profile within the scan range. The confocal parameter is delimited by dashed lines.
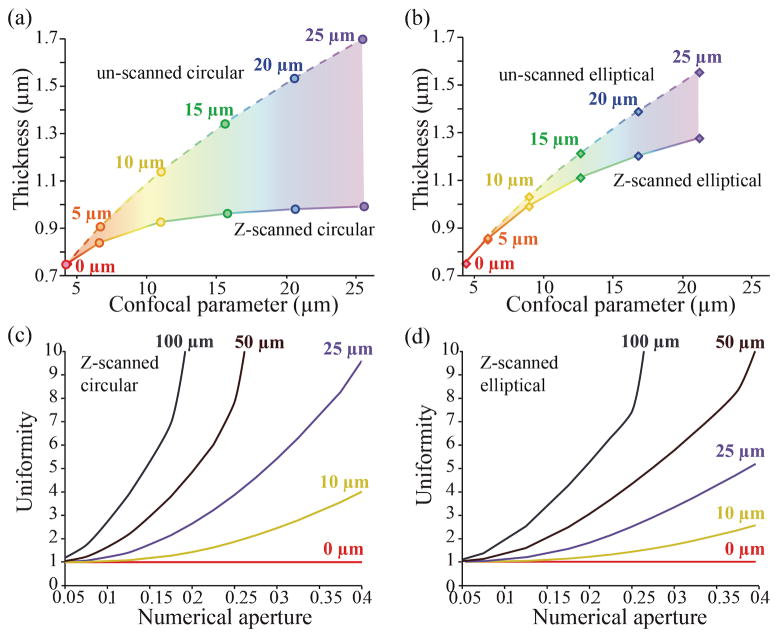
Figure 3.
Properties of z-scanned versus un-scanned light-sheets. A plot of the light-sheet thickness versus confocal parameter is shown for (a) circular DSLM-style beams and (b) elliptical SPIM-style beams with and without axial scanning. The values corresponding to z-scanning are calculated for an objective lens with a numerical aperture of 0.25. In the absence of z-scanning, the light sheet properties are calculated using a different numerical aperture objective that results in the same confocal parameter as the scanning counterpart. The colored regions indicate the decrease in light-sheet thickness and corresponding increase in resolution induced by z-scanning for a fixed confocal parameter. The different axial ranges are indicated in color. A plot of the uniformity U versus numerical aperture for (c) a y-scanned circular and (d) an elliptical beam is shown for different scanning ranges.
To illustrate the difference between an axial un-scanned and scanned light-sheet generated in a DSLM approach (circular Gaussian beam – y-scanning implied), Figure 2a shows the xz-plane intensity profiles of two light-sheets with identical axial extent. In this case, the intensity distribution of a z-scanned light-sheet focused through a 0.25 NA objective is calculated for an axial scanning range of 25 μm and compared to un-scanned light-sheet of different NA that exhibits the same confocal parameter (see Equation 1). Notably, the z-scanned light-sheet presents a smaller thickness than the un-scanned one (Figure 2c). In this case, the light-sheet thickness generated with z-scanning is a factor of 1.7 thinner than without axial scanning (1.0 μm vs 1.7 μm). In addition, there is a marked flattening of the intensity profile along the axial direction within the region defined by the confocal parameter (Figure 2b). This is in contrast to an un-scanned light-sheet, in which the intensity undergoes a Lorentzian decrease off-focus.
A similar analysis for the case of z-scanning using elliptical beams (SPIM approach) is presented in Figure 2d. Interestingly, although the same trends as for the circular beams are observed, in this case z-scanning does not produce the same degree of enhancement in optical sectioning. Specifically (Figure 2f), the same z-scanning range of 25 μm results in a light-sheet thickness of 1.3 μm compared to 1.6 μm for a traditional un-scanned elliptical light-sheet with the identical confocal parameter. Hence, a factor of only 1.2 enhancement occurs. The different level of thickness enhancement that results by z-scanning circular and elliptical beams can be attributed to their individual intensity dependencies along the z axis: whereas forcircular beams the axial intensity decays as [1+(z/ZR)2]−1, for highly elliptical beams it decays as [1+(z/ZR)2]−1/2 (Appendix). This effect can be clearly observed by comparing Figure 2e to Figure 2b. As a consequence, when axially scanning an elliptical beam, the off-focus intensity will contribute more to the time-averaged profile than it will for a circular beam. In other words, contribution from the beam “tails” will be larger when scanning an elliptical beam resulting in a light-sheet with a comparatively larger thickness.
A more detailed analysis of the properties of a z-scanned light-sheet is presented in Figure 3a&b. Here we graphically show how much a 0.25 NA beam scanned various axial ranges (0, 5, 10, 15, 20 & 25 μm) changes in thickness compared to an unscanned beam with an equivalent confocal parameter. The specific example cited (scanning range of 25 μm) corresponds to the uppermost set of points labeled 25 μm. Interestingly, the benefit of axial scanning increases with scanning range both for circular and elliptical light-sheets. Indeed, the confocal parameter obtained with z-scanning remains similar in magnitude to the scanning range, whereas the light-sheet thickness increases proportionally less with scanning. This facilitates the technical implementation of this approach in practice, since one can simply select the z-scanning range according to the desired confocal parameter. In comparing Figure 3a to Figure 3b one can see that for a fixed scan range, a circular beam attains both a larger confocal parameter and maintains a smaller light-sheet thickness. As previously mentioned, this behavior is rooted in the differing axial intensity profiles of the un-scanned beams.
While the previous results are specific to a 0.25 NA objective, we can generalize the method and predict a relative geometrical improvement due to scanning by computing our uniformity statistic U as a function of NA (Figure 3c&d). The uniformity U has a value of one for all values of NA for an un-scanned circular or elliptical beam (red lines). Importantly, z-scanning always results in an increase in light-sheet uniformity that increases with increasing scan range (line colors match colors in Figure 3a&b). For a circular beam, an increase up to a factor of 10 can be achieved for a scanning range of 25 μm as the numerical aperture of the focusing objective approaches 0.4. In the case of an elliptical beam, a similar scanning range enables one to increase the uniformity of the light-sheet a factor of 5. Although Figure 3c&d would seem to indicate that objectives of NA above 0.4 would be desirable for maximal light-sheet uniformity, the paraxial approximation used in our simulations no longer applies so that our aberration-free model cannot predict the behavior of high NA objectives. Note that if the scan range is further increased, the statistic U indicates a significant increase in uniformity for both circular and elliptical beams even for lower NA systems. In other words, the trends observed in Figure 2, where z-scanned light-sheets are thinner than the un-scanned counterparts with identical confocal parameter, will also hold true for low NA systems provided a sufficient scanning range is used (on the order of the confocal parameter of the beam prior to z-scanning). However, there are competing factors that limit the benefit of an extended scan. Increased scan length requires increased scan speed to maintain uniform illumination during a single frame capture. In addition, extending the scan length will reduce the illumination intensity per unit distance along the scan axis potentially leading to a reduction in the image signal to noise ratio. Lastly, there may be an upper limit to the desired light-sheet thickness for a given NA objective that would limit the scanning range (Appendix, Figure A2).
2.3 Experimental Setup
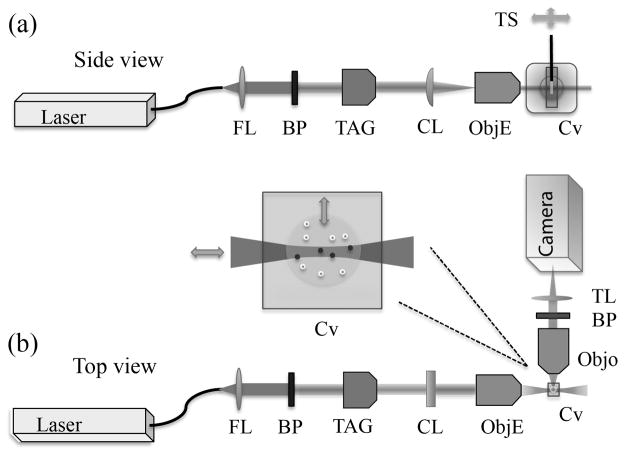
Our simulations show that z-scanning in DSLM or SPIM enables improved optical sectioning capabilities with respect to traditional un-scanned light-sheets. In addition, there is the implied ability to tailor a light-sheet thickness profile by simply changing the z-scanning range without the need to change optics or modify the system numerical aperture. While the improved uniformity has been demonstrated in the DSLM configuration (Dean and Fiolka, 2014; Dean et al., 2015; Zong et al., 2014), to experimentally evaluate the optical properties of a scanned elliptical light-sheet, we construct a standard SPIM system as described in Figure 4. A Spectra Physics ArKr gas laser operating at 488 nm is used for excitation in all experiments. Light-sheet generation is carried out by an achromatic cylindrical lens (Thorlabs ACY254-050-A, f=50 mm) that places the focused beam waist in the back focal plane of a 10x objective (Nikon, Plan Flour, NA 0.3). Axial scanning of the light-sheet is enabled by an acousto-optic liquid lens. In particular, we use a tunable acoustic gradient index (TAG) lens (Mermillod-Blondin et al., 2008) (TAG Optics Inc., TAG Lens 2.0) placed in-line with the laser beam feeding the cylindrical lens. This low-NA optic introduces minimal spherical aberration and maintains paraxial conditions (Duocastella et al., 2014). The TAG lens, driven at a base frequency of 140 kHz and with a clear aperture of 1 cm, behaves as an ultra-high speed varifocal lens that produces a sinusoidal modulation of the input beam at microsecond time scales. In this way, tunable light-sheet z-scanning is achieved with an axial range that can be controlled by varying the amplitude of the lens driving voltage (Duocastella et al., 2012).
Figure 4.
Layout of experimental setup showing (a) side view and (b) top view. The fiber launcher (FL), band pass (BP), cylindrical lens (CL), objective lenses (Obj), cuvette (Cv), translation stage (TS), tube lens (TL), and TAG element are shown in relative locations. The central inset shows the excitation light-sheet passing through the translatable agarose sample (not to scale).
We characterize the thickness and axial extent of un-scanned and z-scanned elliptical light-sheets by imaging sub-diffraction fluorescent emitters suspended in a dilute agarose matrix. The sample is made by preparing a warm 0.5% agarose solution (Sigma-Aldrich) in DI water seeded with 0.5 μm diameter green fluorescent beads (Duke Scientific G500) so that the final bead concentration is near 1 pM. After the solution cools and sets, a 0.5 mm cylindrical glass capillary is used to extract a core of the agarose for observation. The capillary with the agarose core inside is then mounted on a 3-axis translation stage and suspended in a custom 3.5 ml glass cuvette (wall thickness of 0.17 mm) filled with DI water. The agarose core is partially extruded and positioned in space until the light-sheet passes through its center and the fluorescing beads are in focus over the entire field of view of the imaging camera (QImaging, QICAM). All images are acquired through a 525 +/− 20 nm band pass filter (Chroma Technology). The mechanical translation of the agarose sample along the light-sheet x-axis and sequential image capture is then used to reconstruct a full 3D intensity response profile of the illumination beam from which the confocal parameter, FWHM and uniformity statistic U are calculated.
3. Results
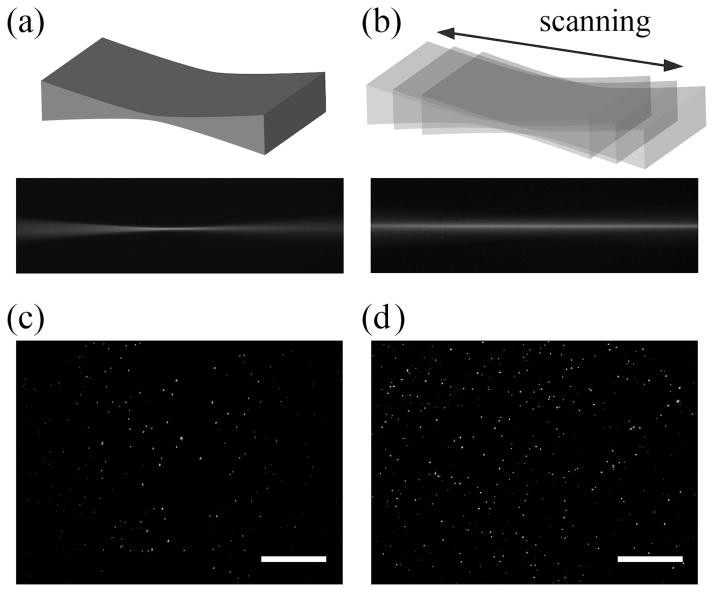
The general effect of z-scanning an elliptical light-sheet in our instrument is shown qualitatively in Figure 5a&b. In this case, the cylindrical lens is rotated 90o with respect to the regular configuration for SPIM in order to capture the xz plane where the light-sheet is thinnest. Here we capture an image of the light-sheet propagating through the cuvette filled only with a solution of 10 nM fluorescein without (Figure 5a) and with (Figure 5b) axial scanning. When the light-sheet is scanned, the xz cross-section is significantly more uniform. Consistent with our simulations, the axial extent of the beam significantly increases while increasing in thickness. The corresponding effect on a captured image, after reestablishing the SPIM configuration, is shown in Figure 5c&d. The image acquired without scanning (Figure 5c) shows a low concentration of bright beads in the center that progressively increases in density and decreases in intensity moving away from the center. In fact, the beads located at the image edges are near the detection limit of the camera while the few beads in the center of the field are near or above the saturation limit. In contrast, the image acquired with a z-scanned light-sheet (Figure 5d) presents a uniform concentration of beads with a much smaller spread in intensity across the entire camera field of view. Qualitatively, both the decrease in central bead intensity and increase in the concentration of beads toward the image edges are consistent with the expected light-sheet uniformity increase.
Figure 5.
Qualitative demonstration of light-sheet imaging (a) without and (b) with z-scanning. Note the widened but more uniform thickness of the scanned light-sheet in cross-section in (b) versus (a). Images of fluorescent beads embedded in agarose obtained (c) without and (d) with z-scanning of an elliptical Gaussian beam. Note the increase in field of view and in uniformity induced by axial scanning. Overall laser power remained constant for both images. The scale bar is 100 μm.
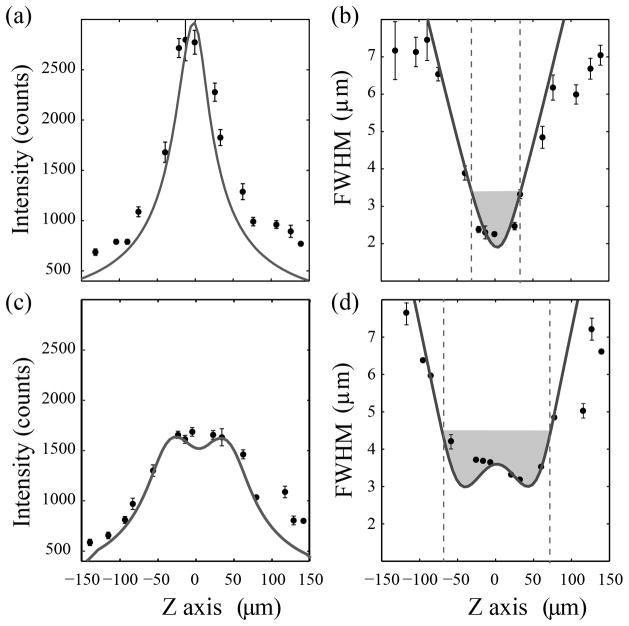
A more rigorous quantification of the z-scanned light-sheet is presented in Figure 6. Here, we use the aforementioned mechanical translation of fluorescent beads in agarose to measure light-sheet profiles under conditions of no scanning and sinusoidal scanning with a 130 μm axial range. The plots of the light-sheet intensity along the z direction (Figure 6a&c) exhibit the expected central flattening of the profile with a corresponding lower intensity peak but wider axial extent. In addition, the measured axial dependency of the light sheet thickness presented in Figure 6b&d is also in good agreement with the simulation. In particular, the un-scanned light-sheet presents a minimum FWHM of 2.3 μm and confocal parameter of 65 μm. In this case, the expected uniformity parameter U is equal to one (Equation 1) which implies that the effective numerical aperture is 0.06. This value (below the NA of the focusing objective) is the result of underfilling of the back-aperture of the focusing objective by the cylindrical lens. In the case of 130 μm z-scanning, the minimum FWHM increases to a value of 3.1 μm and the confocal parameter increases more than a factor of 2 to 137 μm. The corresponding uniformity U increases to 1.6. Therefore, the beam uniformity extends by 60%. This is also in reasonable agreement with the behavior predicted (Upred~1.4) by the simulations presented in Figure 3d.
Figure 6.
Measured intensity profile and light-sheet thickness along the axial direction of a light-sheet generated by a cylindrical lens (a,b) without and (c,d) with z-scanning (scanning range of 130 μm). The solid lines correspond to theoretical values computed using a Zemax model. The grey areas in the right column correspond to the confocal parameter, measured as the axial distance where the minimum beam thickness increases a factor of √2.
To further assess the validity of our approach, we use Zemax (v12, Radiant Zemax, LLC) to model our experimental setup and simulate the sinusoidal axial scanning conditions. We use an optical model for our cylindrical lens (www.thorlabs.com) coupled to a model for a diffraction-limited spherical lens doublet with an NA matched to our proprietary (i.e. no model available) Nikon objective. Note that due to sample inhomogeneity and scatter we restrict our comparison between measurement and theory to a mostly qualitative assessment. The Zemax model is characterized by a single parameter (central intensity of the un-scanned beam) and yields an un-scanned profile similar to our experimental setup (solid lines Figure 6). Importantly, the relative intensity decrease at z=0 and the primary illumination profile characteristics appear well modeled. The model does not do as well far from the central focus (right and left side of plots in Figure 6). The discrepancy is attributed to the observable light scatter within the medium (Lavagnino et al., 2013). As discussed previously, the sinusoidal axial modulation should result in higher intensities and thinner light-sheets at the ends of the scanning range due to the longer dwell times of the scanned light-sheet at these positions (Duocastella and Arnold, 2013). To more clearly demonstrate the effect, we increase the scan range to 240 μm and again measure the intensity profile so that the predicted effect becomes clear (Appendix, Figure A1). In principle, by using pulsed illumination synchronized with the TAG lens oscillation this effect can be augmented as desired. However, one may also consider this effect advantageous: the lens driving amplitude can be used to control the dwell time of the beam waist at particular locations and hence the resulting light-sheet thickness at that location. Such tuning may provide for better imaging in a heterogeneous sample where certain features benefit from additional imaging clarity.
Finally, it is interesting to discuss the benefit of z-scanned light sheet in terms of detection efficiency. In general, wide field imaging is both faster and more convenient than a scanned point detector. Nevertheless, all light detection schemes are subject to detector limitations such as the dynamic range and level of digitization. To fully leverage a given image, sufficient signal-to-noise and a lack of pixel saturation must exist throughout the captured scene to enable analysis. The traditional light-sheet intensity profile tapers by a significant amount over the field of view such that the abbreviated axial range limits the performance of the instrument. As a result, some of the dynamic range of the detection system will be used to accommodate this illumination variation, potentially sacrificing some sensitivity to relevant features within a captured image. While there is indeed a loss of depth resolution associated with the thicker light-sheet presented by axial scanning, when compared to an un-scanned beam the uniformity of the illumination over a larger field may be overall advantageous for some applications.
4. Discussion
Fast z-scanning of elliptical light-sheets implemented in a SPIM system enables imaging over a larger field of view than traditional un-scanned illumination, allowing an increase in the amount of spatiotemporal information retrieved from a single sample image. The enhancement in uniformity achieved depends on the numerical aperture of the focusing objective and the selected scan range. Both choices can be guided by the uniformity statistic U presented. Although z-scanned circular beams in a DSLM system offer better performance in terms of light-sheet thickness and confocal parameter, the implementation of z-scanning with elliptical beams is straightforward and reduces the complexity of the overall imaging system. Our method for z-scanning based on an acousto-optic liquid lens provides a way to electronically control the properties of the elliptical light-sheet at microsecond time scales. The possibility to select the uniformity of the excitation beam without the requirement to change optics opens the door to a novel approach in SPIM where one generates tailored light-sheets in real-time depending on sample or application.
Acknowledgments
We wish to thank Robert Austin for use of the Spectra Physics ArKr gas laser and Christian Theriault from TAG Optics for use of the TAG lens. Support for this work came in part from NIH (2R01GM065421-06, R01 GM114405), AFOSR (FA9550-11-1-0208) and NSF (CMMI-1235291).
5. Appendix
To characterize the axial extent of a circularly symmetric Gaussian beam, it is generally sufficient to consider the Rayleigh range (where the beam thickness is a factor of larger than the beam waist at z=0) for the xz planar cross-section of the beam defined as:
| (A1) |
Notably, when z =ZR, the optical intensity on the optical axis has decreased to one half the maximal value. However, the solution to the paraxial Helmholtz equation for a highly elliptical Gaussian beam, where ω0x ≪ ω0y, is characterized by a different functional form. An elliptical light-sheet is typically produced by launching a Gaussian beam through a low NA cylindrical lens followed by a higher NA, low-aberration microscope objective with the intent of using a highly corrected objective lens to accomplish the major focusing. Upon passing through the cylindrical lens the function I(x, y, z) that describes the optical intensity about the beam center is:
| (A2) |
where the distance along the beam axis z and the Cartesian coordinates x and y are defined with respect to the center of the beam focus. Equation 2 corresponds to an elliptical Gaussian beam, where the widths of the cross-sectional intensity profiles, ωx(z) and ωy(z) are:
| (A3) |
with ZRi correspond to the Rayleigh range for each direction. Without loss of generalization, we choose the x-axis to represent the axis in which the cylindrical lens focuses the incident beam. Thus, in the paraxial approximation, ω0i can be written as (Duocastella and Arnold 2012):
| (A4) |
where ωin is the width of the beam at the lens entrance, f is the x-axis focal length of the lens, λ is the wavelength of light in vacuum, and NAcy is the numerical aperture of the lens assuming the beam fills the lens entrance (1/e2 criteria). Once the elliptical beam passes through the higher NA microscope objective, the new expressions for the minimum beam width at the focus are:
| (A5) |
where fo is the focal length of the focusing objective and NAo is the numerical aperture of the objective (1/e2 criteria). In general, ω0x ≪ ω0y so that any significant variation in the intensity field over the image size is captured by the dynamics of ωx(z). Thus, Equations 2 and 3 reveal that the uniformity of the intensity field of the observed elliptical light-sheet is primarily a function of the minimum beam width at the focus, ω0x. In this case then, Equation 2 implies that at z=ZRx the optical intensity has only dropped by a factor of . Interestingly, the half power point is reached only after z=√3 ZRx, highlighting the different functional forms of the intensity profiles along the z-axis.
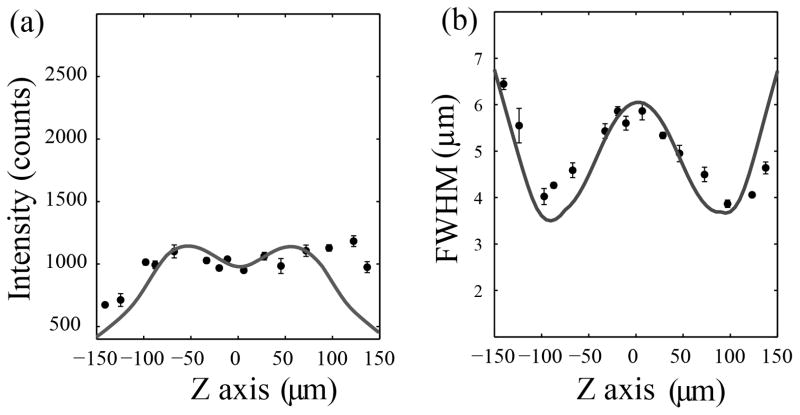
In the main text, we briefly discuss the implications of non-uniformly scanning a cylindrical light-sheet (see Experimental Demonstration). The predicted effects are more clearly demonstrated here (Figure A1) by increasing the amplitude of the sinusoidal modulation shown in Figure 6. Once again, the measured change in thickness and uniformity qualitatively mirror the Zemax model.
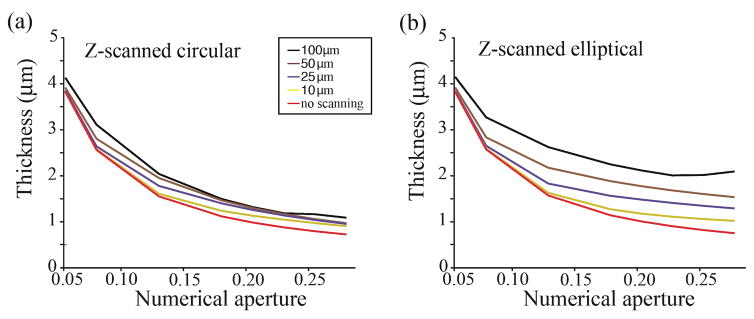
If the NA of the focusing objective is fixed, axial scanning always results in both an increase in light-sheet uniformity and thickness. While it will often be prudent to select the NA of the focusing object based on the desired field of view, it may also be useful to consider how the light-sheet thickness changes as a function of the objective NA for various axial scan lengths where the confocal parameter is not constrained (Figure A2).
Figure A1.
Measured intensity profile and light-sheet thickness along the axial direction of a light-sheet generated by a cylindrical lens when axially scanning at a range of 240 μm. The solid lines correspond to theoretical values computed using a Zemax model. The data shows the effect of the sine wave modulated scanning.
Figure A2.
Families of curves showing the dependence of light-sheet thickness (FWHM) on the NA of the focusing objective without constraining the confocal parameter. Axial scan ranges are indicated by the inset for both figures (a) and (b) where the colored lines are consistent with Figure 3c&d.
References
- Chen BC, et al. Lattice light-sheet microscopy: Imaging molecules to embryos at high spatiotemporal resolution. Science. 2014;346:1257998–1257998. doi: 10.1126/science.1257998. [DOI] [PMC free article] [PubMed] [Google Scholar]
- Dean KM, Fiolka R. Uniform and scalable light-sheets generated by extended focusing. Opt Express. 2014;22:26141. doi: 10.1364/OE.22.026141. [DOI] [PubMed] [Google Scholar]
- Dean KMM, Roudot P, Welf ESS, Danuser G, Fiolka R. Deconvolution-free Subcellular Imaging with Axially Swept Light Sheet Microscopy. Biophys J. 2015;108:2807–2815. doi: 10.1016/j.bpj.2015.05.013. [DOI] [PMC free article] [PubMed] [Google Scholar]
- Duocastella M, Vicidomini G, Diaspro A. Simultaneous multiplane confocal microscopy using acoustic tunable lenses. Opt Express. 2014;22:19293. doi: 10.1364/OE.22.019293. [DOI] [PubMed] [Google Scholar]
- Duocastella M, Sun B, Arnold CB. Simultaneous imaging of multiple focal planes for three-dimensional microscopy using ultra-high-speed adaptive optics. J Biomed Opt. 2012;17:050505. doi: 10.1117/1.JBO.17.5.050505. [DOI] [PubMed] [Google Scholar]
- Duocastella M, Arnold CB. Enhanced depth of field laser processing using an ultra-high-speed axial scanner. Appl Phys Lett. 2013;102:061113. [Google Scholar]
- Duocastella M, Arnold CB. Bessel and annular beams for materials processing. Laser Photon Rev. 2012;6:607–621. [Google Scholar]
- Fahrbach FO, Rohrbach A. A line scanned light- sheet microscope with phase shaped self-reconstructing beams. Opt Express. 2010;18:2608–2610. doi: 10.1364/OE.18.024229. [DOI] [PubMed] [Google Scholar]
- Fahrbach FO, Rohrbach A. Propagation stability of self-reconstructing Bessel beams enables contrast-enhanced imaging in thick media. Nat Commun. 2012;3:632. doi: 10.1038/ncomms1646. [DOI] [PubMed] [Google Scholar]
- Fahrbach FO, Gurchenkov V, Alessandri K, Nassoy P, Rohrbach A. Self-reconstructing sectioned Bessel beams offer submicron optical sectioning for large fields of view in light-sheet microscopy. Opt Express. 2013;21:11425–11440. doi: 10.1364/OE.21.011425. [DOI] [PubMed] [Google Scholar]
- Greger K, Swoger J, Stelzer EHK. Basic building units and properties of a fluorescence single plane illumination microscope. Rev Sci Instrum. 2007;78:023705. doi: 10.1063/1.2428277. [DOI] [PubMed] [Google Scholar]
- Huisken J, Swoger J, Del Bene F, Wittbrodt J, Stelzer EHK. Live Embryos by Selective Plane Illumination Microscopy. Science. 2004;305:1007–1009. doi: 10.1126/science.1100035. [DOI] [PubMed] [Google Scholar]
- Huisken J, Stainier DYR. Selective plane illumination microscopy techniques in developmental biology. Development. 2009;136:1963–75. doi: 10.1242/dev.022426. [DOI] [PMC free article] [PubMed] [Google Scholar]
- Keller PJ, Schmidt AD, Wittbrodt J, Stelzer EHK. Reconstruction of Zebrafish Early Light Sheet Microscopy. 2008;322:1065–1069. doi: 10.1126/science.1162493. [DOI] [PubMed] [Google Scholar]
- Lavagnino Z, Zanacchi FC, Ronzitti E, Diaspro A. Two photon excitation selective plane illumination microscopy (2PE-SPIM) of highly scattering samples: characterization and application. Opt Express. 2013;21:5998–6008. doi: 10.1364/OE.21.005998. [DOI] [PubMed] [Google Scholar]
- Mermillod-Blondin A, McLeod E, Arnold CB. High-speed varifocal imaging with a tunable acoustic gradient index of refraction lens. Opt Lett. 2008;33:2146–2148. doi: 10.1364/ol.33.002146. [DOI] [PubMed] [Google Scholar]
- Planchon TA, Gao L, Milkie DE, Davidson MW, Galbraith JA, Galbraith CG, Betzig E. Rapid three-dimensional isotropic imaging of living cells using Bessel beam plane illumination. Nat Methods. 2011;8:417–423. doi: 10.1038/nmeth.1586. [DOI] [PMC free article] [PubMed] [Google Scholar]
- Truong TV, Supatto W, Koos DS, Choi JM, Fraser SE. Deep and fast live imaging with two-photon scanned light-sheet microscopy. Nat Methods. 2011;8:757–60. doi: 10.1038/nmeth.1652. [DOI] [PubMed] [Google Scholar]
- Vettenburg T, Dalgarno HIC, Nylk J, Coll-Lladó C, Ferrier DEK, Čižmár T, Gunn-Moore FJ, Dholakia K. Light-sheet microscopy using an Airy beam. Nat Methods. 2014;11:541–4. doi: 10.1038/nmeth.2922. [DOI] [PubMed] [Google Scholar]
- Zong W, Zhao J, Chen X, Lin Y, Ren H, Zhang Y, Fan M, Zhou Z, Cheng H, Sun Y, Chen L. Large-field high-resolution two-photon digital scanned light-sheet microscopy. Cell Res. 2014:1–4. doi: 10.1038/cr.2014.124. [DOI] [PMC free article] [PubMed] [Google Scholar]


