

Abstract
Importance
Accurate, real-time case identification is needed to target interventions to improve quality and outcomes for hospitalized patients with heart failure. Problem lists may be useful for case identification, but are often inaccurate or incomplete. Machine learning approaches may improve accuracy of identification but can be limited by complexity of implementation.
Objective
To develop algorithms that use readily available clinical data to identify heart failure patients while in the hospital.
Design, Setting, and Participants
We performed a retrospective study of hospitalizations at an academic medical center. Hospitalizations for patients≥18 years who were admitted after January 1, 2013 and discharged prior to February 28, 2015 were included. From a random 75% sample of hospitalizations, we developed five algorithms for heart failure identification using electronic health record (EHR) data: 1) heart failure on problem list; 2) presence of at least one of three characteristics: heart failure on problem list, inpatient loop diuretic, or brain natriuretic peptide≥500 pg/ml; 3) logistic regression of 30 clinically relevant structured data elements; 4) machine learning approach using unstructured notes; 5) machine learning approach using both structured and unstructured data.
Main Outcome and Measure
Heart failure diagnosis, based on discharge diagnosis and physician review of sampled charts.
Results
Of 47,119 included hospitalizations, 6,549 (13.9%) had a discharge diagnosis of heart failure. Inclusion of heart failure on the problem list (algorithm 1) had a sensitivity of 0.40 and positive predictive value (PPV) of 0.96 for heart failure identification. Algorithm 2 improved sensitivity to 0.77 at the expense of PPV of 0.64. Algorithms 3, 4, and 5 had areas under the receiver operating curves (AUCs) of 0.953, 0.969, and 0.974, respectively. With PPV of 0.9, these algorithms had associated sensitivities of 0.68, 0.77, and 0.83, respectively.
Conclusion and Relevance
The problem list is insufficient for real-time identification of hospitalized patients with heart failure. The high predictive accuracy of machine learning using free text demonstrates that support of such analytics in future EHR systems can improve cohort identification.
Keywords: phenotype, electronic health record, heart failure, hospitalization
Accurate, real-time identification of the diseases or conditions of a hospitalized patient is important for direct patient care, quality improvement, in-hospital registries and electronic health record (EHR) interventions such as clinical decision support. Ostensibly, problem lists offer the ability to readily identify patients with a condition such as heart failure; as a result, problem list documentation has been associated with improved quality of care.1,2 Unfortunately, problem lists are often incomplete3,4 and fail to capture a significant number of individuals with a given disease.5
A number of algorithms and interventions have been developed to improve disease cohort identification.6–9 Most studies examining real-time identification of hospitalized patients with heart failure have relied on a small number of clinical factors and have had mixed success.10,11 More recently, approaches have incorporated machine learning and natural language processing (NLP) of unstructured text from clinical documentation9 with some suggestion of improvement in predictive accuracy.12 However, such approaches can be challenging to implement within EHR systems, which may pose some limitation to their clinical utility in real-time. Head-to-head comparisons of the accuracy of different approaches to cohort identification are lacking, but are critical to help health systems determine whether any increased accuracy of a machine learning approach is worth the increased complexity of design and implementation.
The purpose of this study was to develop algorithms to identify hospitalized patients with heart failure. We compared algorithms of increasing complexity in order to determine relative benefit associated with using more advanced approaches. In comparing algorithms, we took the perspective of a health care system needing to efficiently identify heart failure patients for real-time clinical quality improvement. Therefore, we prioritized high positive predictive value to minimize false positives, which impede staff efficiency in chart reviews and inhibit uptake of clinical decision support. We focused on patients with both acute and chronic heart failure, as all hospitalized patients with heart failure are at high risk of insufficient quality of care and poor post-discharge outcomes.13
Methods
We performed a retrospective study of hospitalizations at NYU Langone Medical Center using data obtained from the EHR (Epic, Epic Systems, Verona, WI). We included hospitalizations for patients≥18 years admitted on or after January 1, 2013 and discharged by February 28, 2015. We excluded hospitalizations that were less than 24 hours or on obstetrics. We also excluded hospitalizations of patients who died during hospitalization or were discharged to hospice care, as these patients are typically excluded from quality improvement metrics.14
From these 47,119 hospitalizations, we sampled 315 hospitalizations for physician chart review; these charts were used for initial validation of hospital classifiers including discharge diagnoses.15,16 Of the remaining hospitalizations, we randomly selected 75% for model development and 25% for model validation.
We developed classification algorithms for identification of hospitalized patients who have heart failure, including cases in which heart failure was the primary reason for hospitalization and cases in which heart failure was a secondary condition. For model development, heart failure was defined using standard International Classification of Diseases, Ninth Revision (ICD-9) discharge diagnosis codes14,17 in any position; based on physician review of 315 charts, we determined that this definition had a sensitivity of 71.4%, a specificity of 98.7% and performed similarly to other simple phenotype approaches using discharge characteristics.16 For model development, we used variables present up to the second midnight of hospitalization.18
Potential structured data elements used for heart failure classification were demographics, laboratory results, vital signs, problem lists diagnoses, and heart failure related medications. For laboratory results and vital signs, we included an indicator of presence or absence of results and the value. We included an indicator of the presence of an echocardiogram test; however, we did not include ejection fraction (EF) in the model as this data element was not structured in our database. Problem list diagnoses included heart failure, acute myocardial infarction, and atherosclerosis. We also included variables of a prior discharge diagnosis of heart failure, with separate variables for a principal diagnosis of heart failure, i.e. an admission specifically for heart failure, and any prior discharge diagnosis. Medications included inpatient or outpatient: loop diuretic, angiotensin converting enzyme (ACE) inhibitor or angiotensin receptor blocker (ARB), beta-blocker, and evidence-based heart failure beta-blocker. Unstructured data elements included admission notes, physician progress notes, echocardiogram reports, chest imaging reports, and consult notes.
We developed five algorithms for identification of patients with heart failure at the second midnight of hospitalization based on increasing complexity of data and analysis. The first algorithm was based exclusively on the presence of heart failure on the problem list. The second was the presence of at least one of the following characteristics: heart failure on the problem list; inpatient oral or intravenous loop diuretic use, or brain natriuretic peptide (BNP; NT-proBNP assay, Roche Diagnostics)≥500 pg/ml. The third algorithm used logistic regression with clinically relevant structured variables. The fourth algorithm used a machine learning approach with the unstructured data. The fifth algorithm used a machine learning approach with both structured and unstructured data.
As part of model validation, we performed physician chart review to enhance our gold standard. Classification of hospitalizations was based on guidelines developed and validated in the Atherosclerosis Risk in Communities (ARIC) study; cases were those adjudicated as either acute decompensated or chronic stable heart failure.19 Two physicians independently reviewed hospitalizations with an overlap of 50 charts that demonstrated a kappa of 0.86. Differences for these charts were adjudicated by a third reviewer.
To estimate the potential benefit of each algorithm in clinical practice, we calculated the number of patients with heart failure who were not compliant with three care measures. We then projected the number of these patients who would be correctly identified by each algorithm. The care measures were: an echocardiogram to measure EF either prior to or during hospitalization, an ACE inhibitor or ARB at discharge for patients with a documented EF≤40%14,20 and no contraindication, and an evidence-based beta-blocker at discharge for patients with EF≤40% and no allergy.14,20 Contraindications to an ACE inhibitor/ARB included an allergy to either medication class, creatinine>2.5 mg/dl at discharge, potassium>5.0 mmol/L at discharge, or systolic blood pressure<90 mmHg at discharge.21 For this analysis, heart failure was based on a discharge diagnosis and EF was obtained using text extraction for the majority of echocardiograms that utilized a standard format.
The study was approved by the NYU School of Medicine Institutional Review Board, which approved a waiver of consent.
Statistical Analysis
Each of the five classification algorithms were developed using the development set. For the third algorithm, we developed a logistic regression model using a heart failure discharge diagnosis as the dependent variable and structured data elements as the independent variables. We developed the fourth algorithm using an L1-regularized logistic regression model which searched over all free text words in a computationally efficient variable selection method (see supplement).22 Our fifth algorithm was developed using L1-regularized logistic regression on both the structured data in used in algorithm 3 and the unstructured data in algorithm 4.
We evaluated performance characteristics of the five algorithms as compared to discharge diagnoses, in both the development and validation sets. Sensitivity and PPV were calculated for each algorithm based on two gold standards: 1) discharge diagnosis; 2) physician chart review. For algorithms 3–5, which provide a continuous-valued prediction, we calculated the cutoff values in the development set for each algorithm to fix the PPV at 0.8 and determined the corresponding sensitivity; we then calculated PPV and sensitivity in the validation set for these cutoff values. For these algorithms, we also measured AUC using the discharge diagnosis gold standard to determine discrimination.
We then calculated sensitivity and PPV for the determined cutoff value using chart review in the validation set based on the method used by Wright and colleagues.6 In this approach, we divided the validation set into three groups. The first group consisted of hospitalizations which almost certainly had a true heart failure diagnosis; these hospitalizations were defined as having all three of the following characteristics: a discharge diagnosis of heart failure, a loop diuretic, and an echocardiogram. Based on chart review, this group had a PPV for hospitalizations of patients with heart failure of 94%.16 The second group contained patients who almost certainly did not have heart failure, defined as the absence of these three characteristics. Based on chart review, this group had a negative predictive value for hospitalizations with heart failure of 99%.16 The third group represented the remaining patients, for whom heart failure status was not obvious at time of discharge. From these hospitalizations, we randomly selected 100 algorithm positive and 100 algorithm negative hospitalizations for each of the five algorithms. These 200 charts were reviewed by a physician and adjudicated as heart failure or not heart failure based on ARIC criteria; we then determined the number of true and false positives and true and false negatives for these charts. We weighted these results based on the sampling scheme and combined them with groups 1 and 2 to determine the sensitivity and PPV for each algorithm.6
To estimate the number of patients for whom there was an opportunity for care improvement, we took all hospitalizations in the validation set that had a discharge diagnosis of heart failure. We calculated the number of these hospitalizations that were not in compliance with each of the three care measures. We then counted the number of these non-compliant hospitalizations that were identified by each of the algorithms. We also determined PPV for the quality metric of echocardiogram.
Results
We included 47,119 hospitalizations in the study. After excluding 315 charts for initial chart review, there were 35,114 hospitalizations in the development set and 11,690 hospitalizations in the validation set. Of these hospitalizations, 6,549 (13.9%) had a diagnosis of heart failure in any position and 1,214 (2.6%) had a principal diagnosis of heart failure (Table 1).
Table 1.
Characteristics of 47,119 hospitalizations.
| Characteristic | |
|---|---|
| Age, Mean (SE) | 60.9 (18.15) |
| Female | 50.83 |
| Black/African American Race | 11.16 |
| Hispanic/Latino Ethnicity | 7.78 |
| Medicaid | 17.62 |
| Heart failure in problem list | 7.70 |
| Prior diagnosis of any heart failure | 6.34 |
| Prior diagnosis of primary heart failure | 1.31 |
| Prior echocardiography | 33.82 |
| Inpatient loop diuretics | 14.51 |
| Outpatient loop diuretics | 13.64 |
| Inpatient ACE inhibitors or ARB | 27.94 |
| Outpatient ACE inhibitors or ARB | 31.40 |
| Inpatient beta-blockers | 41.91 |
| Outpatient beta-blockers | 31.56 |
| Inpatient heart failure beta-blockers | 13.39 |
| Outpatient heart failure beta-blockers | 18.35 |
| Systolic blood pressure, Mean (SE) | 123.3 (18.26) |
| Diastolic blood pressure, Mean (SE) | 67.8 (12.85) |
| Creatinine, Mean (SE) | 1.06 (1.10) |
| Sodium, Mean (SE) | 138.4 (3.68) |
| BNP | |
| <500 | 23.42 |
| 500–999 | 11.95 |
| 1000–4999 | 34 |
| 5000–9999 | 12.67 |
| 10000–19999 | 8.87 |
| ≥20000 | 9.08 |
| Any Systolic blood pressure | 99.71 |
| Any diastolic blood pressure | 99.71 |
| Any creatinine | 98.89 |
| Any sodium | 98.93 |
| Any BNP | 15.59 |
| Acute MI in problem list | 2.02 |
| Atherosclerosis in problem list | 13.05 |
| Final diagnosis of heart failure | 13.9 |
| Final principal diagnosis of heart failure | 2.6 |
Values are percent unless otherwise noted
The inclusion of heart failure on the problem list (algorithm 1) was associated with a sensitivity of 0.52 and a PPV of 0.96 for identification of heart failure based on the discharge diagnosis code gold standard in the validation set (table 2). Heart failure on the problem list had a sensitivity of 0.40 and PPV of 0.96 in validation using the gold standard of sampling with physician chart review. Algorithm 2—defined as having the presence of either heart failure on the problem list, an inpatient loop diuretic, or a BNP≥500—was associated with sensitivities of 0.84 and 0.77 and PPV of 0.58 and 0.64 as compared to discharge diagnosis and physician review gold standards in the validation set, respectively.
Table 2.
Comparison of performance of five algorithms for classification of heart failure
| Development Set | Validation Set | Validation with Chart Review | |||||||
|---|---|---|---|---|---|---|---|---|---|
| Algorithm | Description | AUC | Sensitivity | PPV | AUC | Sensitivity | PPV | Sensitivity | PPV |
| 1 | Heart failure on problem list | – | 0.53 | 0.95 | – | 0.52 | 0.96 | 0.40 | 0.96 |
| 2 | Presence of ≥1 clinical characteristic* | – | 0.85 | 0.56 | – | 0.84 | 0.58 | 0.77 | 0.64 |
| 3 | Logistic regression with structured data | 0.959 | 0.78 | 0.80 | 0.953 | 0.76 | 0.80 | 0.68 | 0.90 |
| 4 | Machine learning using notes and imaging reports | 0.988 | 0.92 | 0.80 | 0.969 | 0.84 | 0.80 | 0.77 | 0.88 |
| 5 | Combination of structured and unstructured data | 0.990 | 0.93 | 0.80 | 0.974 | 0.86 | 0.80 | 0.83 | 0.90 |
characteristics were: heart failure on problem list, inpatient loop diuretic, and brain natriuretic peptide≥500 pg/ml
The third algorithm, in which heart failure was classified using logistic regression, included 30 structured data elements in the model. Variables that had a strong association with heart failure included: heart failure on the problem list, any prior diagnosis of heart failure, inpatient diuretics, outpatient heart failure beta-blocker usage, and high BNP (eTable 1). This algorithm had an AUC of 0.953 in validation and sensitivity of 0.76 with PPV of 0.8 (Table 2 and Figure 1). In validation using the physician review gold standard, the algorithm had a sensitivity of 0.68 with a PPV of 0.90 (Table 2).
Figure 1.
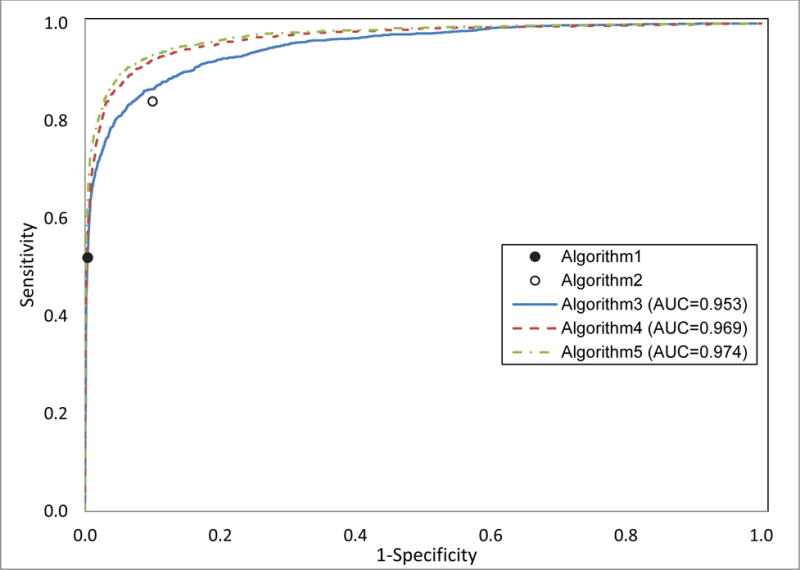
Receiver operating curves (ROCs) for three algorithms to classify patients with heart failure. The three algorithms are: logistic regression of structured data (algorithm 3), machine learning of unstructured data (algorithm 4), and machine learning of a combination of structured and unstructured data (algorithm 5); also included are points for two algorithms that represent binary classification: heart failure on problem list (algorithm 1) and presence of 1 of 3 clinical characteristics (algorithm 2).
The fourth algorithm, which used a machine learning approach on free text, included 1,118 elements in the final model. The top predictors in the algorithm were all clinically relevant and included terms “chf,” “hf,” “nyha,” “failure,” “congestive,” and “Lasix” (eTable 2). This model had an AUC of 0.969 in validation and sensitivity of 0.84 with PPV of 0.80 in validation using the discharge diagnosis gold standard. The fifth algorithm used a machine learning approach to identify 947 unstructured and structured data elements in the final model. The top predictor for this model was heart failure in the problem list, followed by mention of “chf” and “hf” in free text (eTable 3). This algorithm had an AUC of 0.974. The algorithm had a sensitivity of 0.86 with a PPV of 0.80 using the discharge diagnosis and a sensitivity of 0.83 with a PPV of 0.90 using the physician review.
Of 1,631 hospitalizations with a principal or secondary diagnosis of heart failure in the validation set, 195 (12.0%) did not have a prior echocardiogram. Of these hospitalizations, 66 (33.8%) were listed on the problem list (algorithm 1). Algorithm 3 increased the number of these patients identified as heart failure by 34, while algorithms 2,4, and 5 increased the number of patients identified by between 69 and 74 over algorithm 1 (Figure 2). The PPV for identification of heart failure among patients without an echocardiogram was 0.92, 0.30, 0.71, 0.71, and 0.67 for algorithms 1–5, respectively. Among 430 hospitalizations with a diagnosis of heart failure and a known EF≤40%, 109 (25.3%) were not discharged on an ACE inhibitor or ARB while 91 (21.2%) were not discharged on an evidence-based beta-blocker. Using the problem list alone classified heart failure in 76 (69.7%) of heart failure hospitalizations with no ACE inhibitor or ARB and 44 (48.3%) in hospitalizations with no beta-blocker (Figure 2). The second algorithm classified heart failure in 100 (91.7%) of hospitalizations with no ACE inhibitor/ARB and 76 (83.5%) of hospitalizations with no beta-blocker. Algorithm 3, which was developed to have a lower sensitivity but improved PPV, correctly identified heart failure in 97 (88.9%) and 69 (75.8%) of these hospitalizations, respectively. Algorithms 4 and 5 correctly classified 106 (97.2%) and 105 (96.3%) of hospitalizations with no ACE inhibitor or ARB, respectively; both algorithms correctly classified 82 (90.9%) of those with no beta-blocker. (Figure 2)
Figure 2.
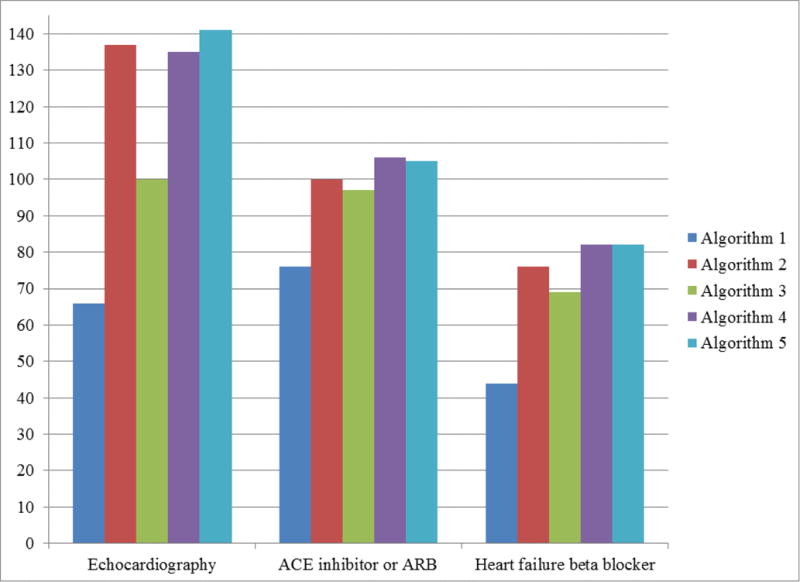
Number of patients identified as having heart failure by each algorithm, among hospitalizations with a discharge diagnosis of heart failure in the validation set and whose patients were not compliant with one of three quality metrics. Quality metrics were assessment of ejection fraction (EF) with echocardiography, discharge medication of an ACE inhibitor or ARB for patients with documented EF≤40%, discharge medication of a heart failure specific beta-blocker for patients with documented EF≤40%. Figure displays true positives and does not account for false positives; for instance, false positives for EF measurement were 6, 318, 41, 56, 71 with a corresponding positive predictive value (PPV) of 0.92, 0.30, 0.71, 0.71, and 0.67 for algorithms 1–5, respectively. Algorithms were: heart failure on problem list (algorithm 1), Presence of 1 of 3 clinical characteristics (algorithm 2), logistic regression of structured data (algorithm 3), machine learning of unstructured data (algorithm 4), and machine learning of a combination of structured and unstructured data (algorithm 5).
Discussion
Patients with heart failure are hospitalized approximately four million times annually and are at high risk of post-discharge readmission and mortality.13,17,20 Given the risk of poor outcomes among these patients, there exists great opportunity to improve the care and outcomes among these patients. To implement interventions to improve outcomes we need rapid identification of heart failure patients early during hospitalization.
While accurate disease cohort identification is generally complex, identification of patients with heart failure in real time can be particularly challenging.23 Unlike other chronic diseases such as diabetes, heart failure is a clinical diagnosis with no biometric gold standard and no medications that are specific to this disease. The challenge in making even a clinical diagnosis of heart failure is evidenced by our gold standard of chart review, which had a high but imperfect level of concordance among two physicians (kappa of 0.86), a finding which is consistent with previous studies.24 Defining heart failure through automated analysis of EHR data adds complexity to the phenotyping task. As a result, increasingly sophisticated approaches to cohort identification are being used.12,25
However, the implementation of complex algorithms into an EHR for real-time identification of heart failure may require special expertise and resources. As a result, there may be a tradeoff of cost of implementation and benefit of improvement in cohort identification with sophisticated approaches. We compared the performance of five algorithms based on increasing complexity to identify a heart failure phenotype among hospitalized patients. Our results suggest that the best approach may depend on clinical and operational needs. We demonstrated that the problem list had a high PPV for hospitalizations of patients with heart failure, which may be useful for initial cohort development. However, this approach was limited in that only about half of all hospitalizations for heart failure had the diagnosis listed on the problem list; similarly, prior studies have shown limitations in problem list use.3–5 An insufficient problem list can significantly limit the benefits of an EHR, which typically rely on problem lists for important functionalities like clinical decision support. A second algorithm, defined by the presence of at least one clinical characteristic commonly observed in a heart failure hospitalization,26 might be useful for an initial screening tool given its high sensitivity. However, the low PPV for this algorithm necessitates a confirmatory test in order to be useful in clinical practice.
The last three algorithms had improved accuracy for identification of heart failure. The third algorithm of clinically relevant structured data performed extremely well in terms of AUC, a measurement of global classification. This third algorithm is relatively easy to implement as its resulting risk score is a linear combination of structured data elements. The fourth and fifth algorithms are likely more difficult to implement as they rely on processing of unstructured data. Nonetheless, this cost may be worth the improved performance depending on clinical needs. Notably, we estimated that using machine learning algorithms with unstructured data doubled the number of early identified heart failure hospitalizations with no echocardiography or no evidenced based beta-blocker at discharge when compared to the problem list alone. Furthermore, as compared to more simple algorithms, the machine learning algorithms improved identification while maintaining high PPV, an important consideration as too many false positive could adversely affect quality improvement initiatives such as decision support.27 Given these benefits, at our institution, we plan to implement a machine learning approach to facilitate interventions targeting hospitalized patients with heart failure. To deploy these algorithms, we will export EHR data to a secure server on which the algorithms will run; the resulting identifier will be put back into the EHR to be used for care delivery. As a result, deployment is independent of EHR vendor and our algorithms can be replicated at other institutions once validated with local data.
Study results should be interpreted in the context of limitations. First, there were limitations in both validation gold standards. We first used discharge diagnosis codes, which are subject to misclassification, including false positives related to upcoding.28 For our second gold standard, physician chart review, we observed an imperfect reliability among physicians and our approach may have been subject to sampling bias. Nonetheless, our sampling approach was based on an established method.6 Second, our study took place at a single institution, so findings may not be generalizable to other hospitals. Third, we may have missed potential contraindications to quality metrics, so some patients may have been appropriately non-compliant to these metrics. Fourth, the algorithms were developed to identify hospitalized patients with heart failure and were not validated on outpatients, although a similar approach could be tailored to outpatients with heart failure.
As the focus of hospitals has shifted from acute care to both the acute and post-acute period, early identification of disease during hospitalization has become paramount to initiate transitional care. Our findings suggest that the problem list, which identified only half of hospitalized patients with heart failure, is insufficient for real time identification of this population. Relying on analysis of free text notes and procedure reports appears to have the best predictive accuracy. As a result, there are opportunities for improvement in real-time identification of disease cohorts, particularly as EHR vendors begin to natively support more sophisticated algorithms.
Supplementary Material
Acknowledgments
This work was supported by the Agency for Healthcare Research and Quality (AHRQ) grant K08HS23683. The funding agency had no role in design and conduct of the study; collection, management, analysis, and interpretation of the data; preparation, review, or approval of the manuscript; and decision to submit the manuscript for publication.
Drs. Sontag and Blecker have a patent pending for a machine learning algorithm to predict diabetes.
We thank Matthew Durstenfeld, MD of NYU School of Medicine, who performed chart review for adjudication of heart failure.
Dr. Blecker had full access to all the data in the study and takes responsibility for the integrity of the data and the accuracy of the data analysis.
References
- 1.Hartung DM, Hunt J, Siemienczuk J, Miller H, Touchette DR. Clinical implications of an accurate problem list on heart failure treatment. Journal of general internal medicine. 2005;20(2):143–147. doi: 10.1111/j.1525-1497.2005.40206.x. [DOI] [PMC free article] [PubMed] [Google Scholar]
- 2.Samal L, Linder JA, Bates DW, Wright A. Electronic problem list documentation of chronic kidney disease and quality of care. BMC nephrology. 2014;15:70. doi: 10.1186/1471-2369-15-70. [DOI] [PMC free article] [PubMed] [Google Scholar]
- 3.Holmes C, Brown M, Hilaire DS, Wright A. Healthcare provider attitudes towards the problem list in an electronic health record: a mixed-methods qualitative study. BMC medical informatics and decision making. 2012;12:127. doi: 10.1186/1472-6947-12-127. [DOI] [PMC free article] [PubMed] [Google Scholar]
- 4.Szeto HC, Coleman RK, Gholami P, Hoffman BB, Goldstein MK. Accuracy of computerized outpatient diagnoses in a Veterans Affairs general medicine clinic. The American journal of managed care. 2002;8(1):37–43. [PubMed] [Google Scholar]
- 5.Wright A, McCoy AB, Hickman TT, et al. Problem list completeness in electronic health records: A multi-site study and assessment of success factors. Int J Med Inform. 2015;84(10):784–790. doi: 10.1016/j.ijmedinf.2015.06.011. [DOI] [PMC free article] [PubMed] [Google Scholar]
- 6.Wright A, Pang J, Feblowitz JC, et al. A method and knowledge base for automated inference of patient problems from structured data in an electronic medical record. Journal of the American Medical Informatics Association: JAMIA. 2011;18(6):859–867. doi: 10.1136/amiajnl-2011-000121. [DOI] [PMC free article] [PubMed] [Google Scholar]
- 7.Newton KM, Peissig PL, Kho AN, et al. Validation of electronic medical record-based phenotyping algorithms: results and lessons learned from the eMERGE network. Journal of the American Medical Informatics Association: JAMIA. 2013;20(e1):e147–154. doi: 10.1136/amiajnl-2012-000896. [DOI] [PMC free article] [PubMed] [Google Scholar]
- 8.Pathak J, Kho AN, Denny JC. Electronic health records-driven phenotyping: challenges, recent advances, and perspectives. Journal of the American Medical Informatics Association: JAMIA. 2013;20(e2):e206–211. doi: 10.1136/amiajnl-2013-002428. [DOI] [PMC free article] [PubMed] [Google Scholar]
- 9.Shivade C, Raghavan P, Fosler-Lussier E, et al. A review of approaches to identifying patient phenotype cohorts using electronic health records. Journal of the American Medical Informatics Association: JAMIA. 2014;21(2):221–230. doi: 10.1136/amiajnl-2013-001935. [DOI] [PMC free article] [PubMed] [Google Scholar]
- 10.Banerjee D, Thompson C, Bingham A, Kell C, Duhon J, Grossman H. An Electronic Medical Record Report Improves Identification of Hospitalized Patients With Heart Failure. J Card Fail. 2015;22(5):402–405. doi: 10.1016/j.cardfail.2015.12.006. [DOI] [PubMed] [Google Scholar]
- 11.Halasyamani LK, Czerwinski J, Clinard R, Cowen ME. An electronic strategy to identify hospitalized heart failure patients. Journal of hospital medicine: an official publication of the Society of Hospital Medicine. 2007;2(6):409–414. doi: 10.1002/jhm.284. [DOI] [PubMed] [Google Scholar]
- 12.Evans RS, Benuzillo J, Horne BD, et al. Automated identification and predictive tools to help identify high-risk heart failure patients: pilot evaluation. Journal of the American Medical Informatics Association: JAMIA. 2016 doi: 10.1093/jamia/ocv197. [DOI] [PMC free article] [PubMed] [Google Scholar]
- 13.Blecker S, Agarwal SK, Chang PP, et al. Quality of care for heart failure patients hospitalized for any cause. J Am Coll Cardiol. 2014;63(2):123–130. doi: 10.1016/j.jacc.2013.08.1628. [DOI] [PMC free article] [PubMed] [Google Scholar]
- 14.Bonow RO, Ganiats TG, Beam CT, et al. ACCF/AHA/AMA-PCPI 2011 Performance Measures for Adults With Heart Failure: a report of the American College of Cardiology Foundation/American Heart Association Task Force on Performance Measures and the American Medical Association-Physician Consortium for Performance Improvement. Circulation. 2012;125(19):2382–2401. doi: 10.1161/CIR.0b013e3182507bec. [DOI] [PubMed] [Google Scholar]
- 15.Rosenman M, He J, Martin J, et al. Database queries for hospitalizations for acute congestive heart failure: flexible methods and validation based on set theory. Journal of the American Medical Informatics Association: JAMIA. 2014;21(2):345–352. doi: 10.1136/amiajnl-2013-001942. [DOI] [PMC free article] [PubMed] [Google Scholar]
- 16.Gold A, Sontag D, Rosenman M, Katz S, Kuperman G, Blecker S. Heart Failure Phenotyping: A Set Theory Based Approach to Identify Patients With Heart Failure. Circ Cardiovasc Qual Outcomes. 2016;9:A162. [Google Scholar]
- 17.Blecker S, Paul M, Taksler G, Ogedegbe G, Katz S. Heart failure-associated hospitalizations in the United States. J Am Coll Cardiol. 2013;61(12):1259–1267. doi: 10.1016/j.jacc.2012.12.038. [DOI] [PMC free article] [PubMed] [Google Scholar]
- 18.Centers for Medicare and Medicaid Services. Fact Sheet: Two-Midnight Rule. Available at: https://www.cms.gov/Newsroom/MediaReleaseDatabase/Fact-sheets/2015-Fact-sheets-items/2015-07-01-2.html Accessed 2/25/16.
- 19.Rosamond WD, Chang PP, Baggett C, et al. Classification of heart failure in the atherosclerosis risk in communities (ARIC) study: a comparison of diagnostic criteria. Circulation Heart failure. 2012;5(2):152–159. doi: 10.1161/CIRCHEARTFAILURE.111.963199. [DOI] [PMC free article] [PubMed] [Google Scholar]
- 20.Yancy CW, Jessup M, Bozkurt B, et al. 2013 ACCF/AHA Guideline for the Management of Heart Failure: A Report of the American College of Cardiology Foundation/American Heart Association Task Force on Practice Guidelines. J Am Coll Cardiol. 2013;62(16):e147–239. doi: 10.1016/j.jacc.2013.05.019. [DOI] [PubMed] [Google Scholar]
- 21.McMurray JJ, Adamopoulos S, Anker SD, et al. ESC Guidelines for the diagnosis and treatment of acute and chronic heart failure 2012: The Task Force for the Diagnosis and Treatment of Acute and Chronic Heart Failure 2012 of the European Society of Cardiology. Developed in collaboration with the Heart Failure Association (HFA) of the ESC. European heart journal. 2012;33(14):1787–1847. doi: 10.1093/eurheartj/ehs104. [DOI] [PubMed] [Google Scholar]
- 22.Ng AY. Feature selection, L 1 vs. L 2 regularization, and rotational invariance. Paper presented at: Proceedings of the twenty-first international conference on Machine learning. 2004 [Google Scholar]
- 23.Robinson EE, Cooley C, Schreuder AB, et al. A strategy for real-time identification of hospitalized patients with heart failure. Joint Commission journal on quality and patient safety/Joint Commission Resources. 2009;35(12):622–628. doi: 10.1016/s1553-7250(09)35088-6. [DOI] [PubMed] [Google Scholar]
- 24.Meystre S, Haug PJ. Automation of a problem list using natural language processing. BMC medical informatics and decision making. 2005;5:30. doi: 10.1186/1472-6947-5-30. [DOI] [PMC free article] [PubMed] [Google Scholar]
- 25.Pakhomov S, Weston SA, Jacobsen SJ, Chute CG, Meverden R, Roger VL. Electronic medical records for clinical research: application to the identification of heart failure. The American journal of managed care. 2007;13(6 Part 1):281–288. [PubMed] [Google Scholar]
- 26.Marti CN, Georgiopoulou VV, Kalogeropoulos AP. Acute heart failure: patient characteristics and pathophysiology. Curr Heart Fail Rep. 2013;10(4):427–433. doi: 10.1007/s11897-013-0151-y. [DOI] [PMC free article] [PubMed] [Google Scholar]
- 27.Kawamoto K, Houlihan CA, Balas EA, Lobach DF. Improving clinical practice using clinical decision support systems: a systematic review of trials to identify features critical to success. BMJ. 2005;330(7494):765. doi: 10.1136/bmj.38398.500764.8F. [DOI] [PMC free article] [PubMed] [Google Scholar]
- 28.Psaty BM, Boineau R, Kuller LH, Luepker RV. The potential costs of upcoding for heart failure in the United States. The American journal of cardiology. 1999;84(1):108–109. A109. doi: 10.1016/s0002-9149(99)00205-2. [DOI] [PubMed] [Google Scholar]
Associated Data
This section collects any data citations, data availability statements, or supplementary materials included in this article.