

Summary
During the last two decades, hyper‐immunoglobulin (Ig)E syndromes have been characterized clinically and molecularly in patients with genetically determined primary immunodeficiencies. However, the detection of low IgE levels, defined here as below detection limit in the routine clinical immunology laboratory, has received little attention. We analysed the association of serum IgA, IgM and IgG levels (including IgG subclasses) with low, normal or high serum IgE levels in patients evaluated in a single‐centre out‐patient immunodeficiency and allergy clinic. The correlation of serum IgE levels with IgG subclasses depended on the clinical phenotype. In patients with immunodeficiencies, IgE correlated with IgG2 and IgG4 but not with IgG3. In contrast, in patients referred for signs of allergy, IgE correlated with IgG3 but not with IgG2. A low IgE result was associated with low IgG3 and IgG4 in allergy referrals, while immunodeficiency referrals with a low IgE result had significantly lower IgG1, IgG2 and IgG4 levels. Hierarchical clustering of non‐IgE immunoglobulin profiles (IgM, IgA, IgG, IgG1–4) validated that non‐IgE immunoglobulin levels predict the clinic referral, i.e. phenotype, of low‐IgE patients. These results suggesto guide the clinical management of patients with low serum IgE levels.
Keywords: allergy, antibody deficiency, IgE, IgG subclass, immunodeficiency
Introduction
Immunoglobulin E (IgE) is best known for its association with allergic disease due to the activation of mast cells via the Fc‐ε receptor 1. In addition, IgE has an important anti‐toxic and anti‐parasite effector function and may exert immunomodulatory effects 1, 2. Depending on the assay used for quantification, the detection limit of serum IgE in clinical routine is between 2 and 4 kU/l. Normal IgE values of healthy individuals depend on age, but not gender 3. The normal range of serum IgE in healthy individuals has changed in the last 20 years with a trend towards higher IgE levels 3, 4. Many laboratories consider IgE levels > 100 kU/l as being elevated.
In primary immunodeficiencies (PID), the IgE antibody isotype is known mainly for its association with syndromes in which serum IgE levels are elevated significantly, the so‐called ‘hyper‐IgE syndromes’. These syndromes consist of clinically and genetically distinct disease entities, including conditions with mutations in signal transducer and activator of transcription (STAT)‐3 (Job's syndrome), dedicator of cytokinesis 8 (DOCK8) or phosphoglucomutase (PGM3) 5, 6. High serum IgE levels may, however, also be found in a variety of other PID 7.
Surprisingly little is known about clinical entities that present with a low IgE result. Low serum IgE has been associated clinically with chronic fatigue and polyarthralgias 8 and a higher prevalence of autoimmune and oncological diseases and asthma, as well as chronic sinusitis and otitis media 9. Recent studies found an association between low serum IgE levels and the levels of one or more classes of immunoglobulins (i.e. IgG, IgA and/or IgM) below the reference range for age 10, 11. In line with these reports, a recent review concluded that low IgE levels should be considered as a clinical laboratory ‘flag’ to screen for antibody deficiency 12. Some of these studies, however, may have been biased, as they correlated only immunoglobulin levels that had been measured for unspecified clinical reasons.
No study to date has analysed whether the patient group with low serum IgE (i) immunologically and (ii) clinically might represent a heterogeneous compilation of well‐defined subgroups. The purpose of the present study was to close this gap by testing the association between low serum IgE levels (here defined as < 4 kU/l) and both (i) non‐IgE immunoglobulin levels and (ii) clinical phenotypes. To achieve this, we performed a retrospective analysis of clinical and immunological parameters in patients from our out‐patient immunodeficiency and out‐patient allergy service, where serum IgE measurements are performed regularly.
Material and methods
Patients
Immunodeficiency referral patients consisted of patients from the adult out‐patient immunodeficiency clinic at the University Hospital Basel, Switzerland, who presented for evaluation of an immunodeficiency between April 2012 and November 2014. Allergy referral patients who were included in the study consisted of gender‐ and aged‐matched patients who presented between March 2011 and December 2013 at the allergy clinic of the same hospital. The patients were divided into three groups based on IgE levels: low IgE: IgE < 4 kU/l, normal IgE: IgE 10–100 kU/l and high IgE: IgE >100 kU/l. The study was approved by the local ethics committee.
Measurement of serum immunoglobulin levels
Total IgG, IgA, IgM, IgE and IgG subclass (IgG1, IgG2, IgG3 and IgG4) concentrations in serum were measured routinely by nephelometry using a BN ProSpec system (Siemens Healthcare Diagnostics, Zürich, Switzerland), according to the manufacturer's instructions. Results were generated using reagent and standard sets obtained from Siemens. Levels of IgG, IgA, IgM and IgG subclasses are expressed in g/l, while IgE levels are in kU/l. Samples with an IgE concentration below the lower limit of detection of the nephelometric IgE assay (i.e. 4 kU/l) were evaluated additionally by the ImmunoCAP total IgE low range fluorescence immunoassay (Thermo Fisher Scientific, Uppsala, Sweden) on a Phadia 250 instrument (Thermo Fisher) to obtain a precise determination. Both methods for IgE measurement are calibrated using standards traceable to the same 2nd World Health Organization International Reference Preparation of Human Serum Immunoglobulin E coded 75/502, and have been demonstrated recently to show excellent interassay agreement 13.
Statistics
Significance tests were performed using the Kruskal–Wallis and Mann–Whitney U‐tests. Differences between samples were regarded as significant if P < 0·05. For correlations, Spearman's r and P‐values were calculated. Data analysis was performed using the GraphPad Prism software (version 6.01) and the r statistical programming environment team (R Development Core. R: A Language and Environment for Statistical Computing, Vienna, Austria, 2015. http://www.R-project.org).
Hierarchical clustering
Heatmaps visualizing the hierarchical clustering of immunoglobulin profiles were established using the hclust‐r function with default parameters and plotted using the heatmap function from the NMF r package 14.
Results
Characterization of the study population
In our single‐centre out‐patient immunodeficiency clinic, IgE levels were measured prospectively in 88 patients (immunodeficiency referrals, patient characteristics Table 1, clinical diagnosis Table 2). IgG, IgA, IgM and IgG subclasses were measured in all patients. None of the patients was on immunoglobulin substitution at the time of measurement.
Table 1.
Patient characteristics.
| Immunodeficiency referrals | Allergy referrals | |
|---|---|---|
| (n = 88) | (n = 89) | |
| Women, n (%) | 56 (64%) | 62 (70%) |
| Age | ||
| Mean (s.d.) | 46.8 (17) | 46.6 (17) |
| 25th–75th percentile) | 34–59 | 29–61 |
| Minimum–maximum | 17–87 | 19–77 |
Table 2.
Clinical characteristics from patients from immunodeficiency referral patients with immunoglobulin E < 4 kU/l.
| Patient code | Clinical diagnosis |
|---|---|
| Patient 1 | IgG subclass deficiency |
| Patient 2 | IgG deficiency of unknown aetiology |
| Patient 3 | CVID |
| Patient 4 | Mannose binding lectin‐complement deficiency and steroid induced immunodeficiency, giant‐cell arteritis |
| Patient 5 | Selective IgA deficiency |
| Patient 6 | Polyclonally elevated IgM of unknown cause |
| Patient 7 | CVID |
| Patient 8 | Chronic lymphatic leukaemia |
| Patient 9 | CVID |
| Patient 10 | CVID and mannose binding lectin deficiency |
| Patient 11 | CVID |
| Patient 12 | Selective IgG3 deficiency |
| Patient 13 | CVID |
| Patient 14 | CVID |
| Patient 15 | CVID |
CVID = common variable immunodeficiency; s.d. = standard deviation.
Fifteen patients (17%) displayed an IgE concentration of < 4 kU/l, i.e. had a low‐IgE result. In 51 (58%) immunodeficiency referral patients, serum IgE was normal (between 4 and 100 kU/l) and in 22 (25%) patients serum IgE was high (> 100 kU/l). From the 15 patients with a low IgE result, all except one (93%) were diagnosed as having primary or secondary antibody deficiency. Only one patient (7%) with a serum IgE level of < 4 kU/l had all immunoglobulin levels (including IgG subclasses) in a physiological range, and thus antibody deficiency was excluded (clinical diagnosis, Table 2). In the subset of immunodeficiency referral patients that presented with an IgE level > 4 kU/l, 47% received a clinical diagnosis of primary or secondary antibody deficiency, and in 53% an antibody deficiency was excluded.
Using the hospital internal laboratory database we identified 28 patients evaluated in the out‐patient allergy clinic (allergy referrals) presenting with serum IgE levels < 4 kU/l (low IgE result) that were age‐ and gender‐matched to the immunodeficiency referral patients with a low IgE result (patient characteristics Table 1, clinical diagnosis Table 3). As controls, we included 29 age‐ and gender‐matched allergy referral patients with normal (IgE between 4 and 100 kU/l) and 32 patients with high serum IgE (IgE > 100 kU/l). IgG, IgM, IgA and IgG subclasses were measured in the sera of all these patients.
Table 3.
Clinical characteristics from patients from allergy referral patients with immunoglobulin E < 4 kU/l.
| Patient code | Clinical diagnosis |
|---|---|
| Patient 16 | Dust mite‐induced rhinoconjunctivitis |
| Patient 17 | Angioedema |
| Patient 18 | Perennial rhinitis |
| Patient 19 | Hand eczema |
| Patient 20 | Angioedema associated with antibiotic intake |
| Patient 21 | Hypersensitivity reaction to endomethasone |
| Patient 22 | Non‐allergic asthma |
| Patient 23 | Chronic rhinitis |
| Patient 24 | Angioedema during surgery |
| Patient 25 | Asthma |
| Patient 26 | Intrinsic asthma, pneumonia |
| Patient 27 | Allergic rhinoconjunctivitis |
| Patient 28 | Perennial cough |
| Patient 29 | Diarrhoea; psoriasis |
| Patient 30 | Chronic cough, Lichen ruber |
| Patient 31 | Asthma |
| Patient 32 | Dyspnoea |
| Patient 33 | Allergic rhinoconjunctivitis, bee‐venom allergy |
| Patient 34 | Recurrent angioedema |
| Patient 35 | Anaphylaxis |
| Patient 36 | Anaphylaxis |
| Patient 37 | Non‐allergic asthma |
| Patient 38 | Chronic allergic rhinitis |
| Patient 39 | Skin contact allergy (eczema) |
| Patient 40 | Chronic urticaria, pneumonia |
| Patient 41 | Drug allergy |
| Patient 42 | Chronic urticaria and angioedema |
| Patient 43 | Chronic rhinitis |
The correlation of IgE and IgG subclasses depends on the clinical phenotype
Using the data from the 177 patients (88 immunodeficiency referrals and 89 allergy referrals) we plotted correlations of IgE with IgG subclasses (Fig. 1). Significant positive correlations were found for IgG2, IgG3 and IgG4, while the correlation of IgG1 with IgE was not significant. The Spearman's r value was highest for IgG2 (0·39) and IgG4 (0·47) (Fig. 1). We then plotted correlations of IgG subclasses with IgE separately for patients referred to the immunodeficiency clinic (blue) versus patients referred to the allergy clinic (red). Within the group of immunodeficiency referrals, IgE correlated significantly with all IgG subclasses, with the exception of IgG3 (Fig. 1). The strongest positive correlations were found for IgG2 (Spearman's r = 0·6) and IgG4 (Spearman's r = 0·46). In contrast, within the group of allergy referrals, IgE correlated significantly with IgG2, IgG3 and IgG4, but not with IgG1 (Fig. 1). The Spearman's r was highest for IgG3 (0·36) and IgG4 (0·40) in this patient group.
Figure 1.
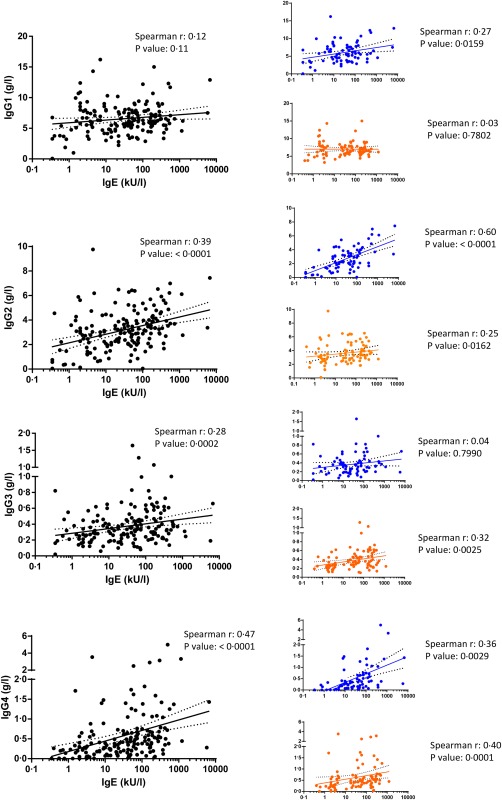
Correlations of immunoglobulin (Ig)E against all IgG subclasses are shown for all patients analysed (black dots) or separated based on the referral clinic (immunodeficiency clinic: blue dots; allergy clinic: red dots). Spearman's r and P‐values are shown).
Thus, the correlation of IgE with IgG subclasses depended on the clinical phenotype, which dictated the clinic to which the patients were referred.
A low IgE result is associated with specific low IgG subclasses depending on the clinical phenotype
Next we focused on patients who had an IgE level that was below detection limit (low IgE result). When immunodeficiency referral patients were grouped based on their serum IgE levels (low‐IgE versus normal IgE versus high IgE), a low IgE result was associated significantly with low serum IgG and IgA, while serum IgM levels were not different (Fig. 2a). While IgG1, IgG2 and IgG4 were all significantly lower in the low‐IgE result group compared to the groups with normal and high IgE levels, respectively, IgG3 levels were not significantly different in immunodeficiency referral patients with a low IgE result (Fig. 2a).
Figure 2.
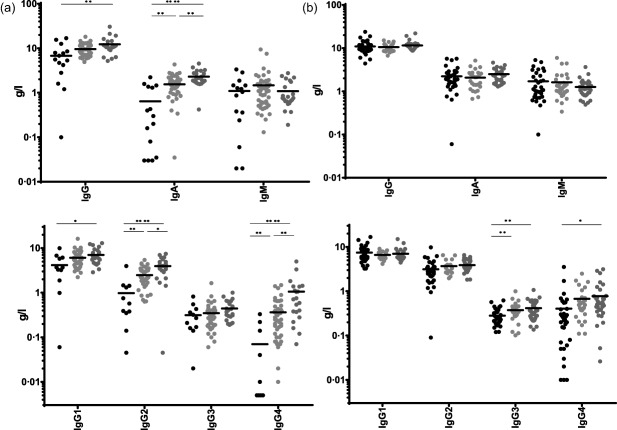
Analysis of immunoglobulin (Ig) serum levels from immunodeficiency referrals (Fig. 2a) or allergy referrals (Fig. 2b). Patients were classified based on IgE levels: low IgE = IgE < 4 kU/l, black circles normal IgE = 4 kU/l < IgE < 100 kU/l, light grey circles and high IgE = IgE > 100 kU/l, dark grey circles. For statistical significance a Kruskal–Wallis test was performed. Significant differences are indicated: *P‐value < 0·05; **P < 0·01; ***P < 0·001; ****P < 0·0001.
In contrast to what was found in immunodeficiency referral patients, a low IgE result was not associated significantly with low total serum IgG and IgA in allergy referral patients (Fig. 2b). IgM levels were similar to what was observed in immunodeficiency referrals (Fig. 2b). In contrast to what was observed for immunodeficiency referrals with low serum IgE, a low IgE result in allergy referrals was associated with low IgG3 levels, while IgG1 and IgG2 subclass levels were normal (Fig. 2b). Clinical chart review revealed that the main symptoms of allergy referral patients with a low IgE result were rhinitis/rhinoconjunctivitis and asthma (Table 3).
Importantly, when the sera from patients with IgE > 4 kU/l from immunodeficiency referrals (excluding patients with the clinical diagnosis of antibody deficiency) were compared to allergy referrals, we did not find any statistical significance in IgG (including all IgG subclasses), IgA or IgM, indicating that the differences we observed within the two low‐IgE groups were specific and not due to a systemic bias in immunoglobulin quantification (Supporting information, Fig. S1).
Hierarchical clustering substantiates the existence of two distinct patient groups with low IgE
To test further our hypothesis that patients with a low IgE result comprised two immunologically and clinically distinct groups, we performed unbiased hierarchical clustering of immunoglobulin profiles from patients with a low IgE result (including both immunodeficiency and allergy referrals). Immunodeficiency referrals with a low IgE result phenotype mainly clustered together, while the same was true for allergy referrals with a low IgE result (Fig. 3). It is noteworthy that some patients (e.g. patient codes 36 and 38) evaluated in the allergy clinic showed immunoglobulin profiles matching closely the profile of patients with established diagnosis of antibody deficiency. In contrast, patient code 12 received the diagnosis of selective IgG3 deficiency, but displayed an immunoglobulin profile similar to allergy referral patients. Interestingly, selective IgG3 subclass deficiency has been shown to be associated with both recurrent respiratory tract infection and atopic disease 15, 16.
Figure 3.
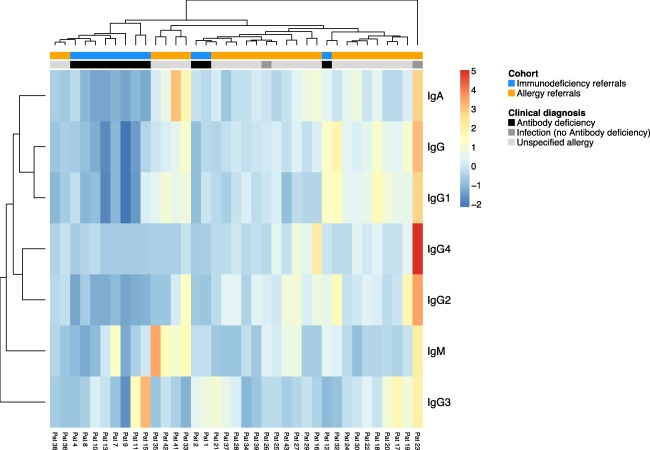
Unbiased hierarchical clustering of immunoglobulin profiles from patients with a hypo immunoglobulin (Ig)E phenotype from immunodeficiency referrals (blue) or allergy referrals (orange).
Significantly lower serum IgE levels in immunodeficiency referral patients
The detection limit of 4 kU/l is not the technical limit of IgE quantification. When using a high sensitivity method that has a detection limit of 0·35 kU/l (10‐fold lower than the detection limit of the routine IgE quantification assay; see Methods) IgE levels were significantly lower in immunodeficiency referrals compared to allergy referral patients with a low IgE result (Fig. 4). Thus, patients with a low IgE result (IgE < 4 kU/l) apparently consisted of patients with very low IgE (<0·35 kU/l) and patients with IgE levels that are close to 4 kU/l.
Figure 4.
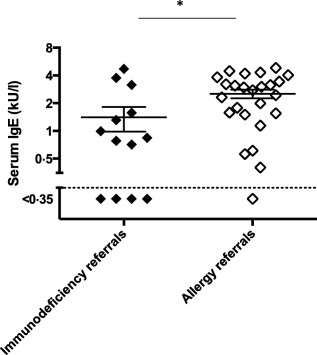
High‐sensitivity quantification of serum immunoglobulin (Ig)E levels in sera from the low‐IgE patients (IgE < 4 kU/l); immunodeficiency referrals = closed symbols; allergy referrals = open symbols). Detection limit is 10‐fold lower than with conventional assays used in clinics (cut‐off < 0·35 kU/l). For statistical significance a Mann–Whitney test was performed *(P‐value < 0·05).
Discussion
Based on this retrospective single‐centre study, the existence of two clinically and immunologically distinct low IgE cohorts can be postulated.
The first, defined here as low IgE type 1, is associated with antibody deficiency (low IgG and IgA) and susceptibility to infection and/or autoimmunity. If a secondary cause of antibody deficiency is unlikely, these patients are often diagnosed as common variable immunodeficiency (CVID). The only IgG subclass that was not altered significantly in low IgE type 1 was IgG3. Serum IgE levels from these patients were significantly lower than those from allergy referral patients when high sensitivity assays are used for quantification.
A low IgE type 2 pattern was characterized by specifically low levels of IgG3 and IgG4, but did not show reductions in other IgG subclasses. Total IgG and IgA levels were normal in patients with low IgE type 2. Serum IgE of these patients were mainly close to the commonly used cut‐off of 4 kU/l. Low IgE type 2 patients were referred clinically to the out‐patient allergy unit. Chart review revealed that the main symptoms were rhinitis and asthma.
Due to the limitations of a retrospective analysis we can only speculate about the type of immune dysregulation underlying a low IgE type 1 versus low IgE type 2 result. One possibility is that patients with a low IgE type 1 pattern have a similar but more advanced immune dysregulation compared to patients with a low IgE type 2 pattern. However, IgG3 being normal in low IgE type 1 but low in low IgE type 2 argues against this. IgG3 has distinct roles from other IgG subclasses. It has a much higher turnover than the other subclasses with a half‐life of 7 versus 21 days, it is the best activator of complement and, together with IgE, is the first of the subclasses to appear in an immune response 17. Thus, IgG3 joins the IgM‐dependent early defence to bind and clear foreign antigens. It may thus not be surprising that IgG3 is the only subclass to remain normal in immunodeficient patients who usually suffer from chronic or repeated infections, while this plays a lesser role in allergy patients. Conversely, IgG2 as well as IgG1 are important for elicitation of anaphylaxis 18 and perhaps a lower‐level, clinically undetectable state of allergen‐dependent immune activation. This could explain why these subclasses show a contrast in low IgE type1 versus type 2.
As B cell subsets were available in immunodeficiency referral patients, we could show that low IgE type 1 was associated with low peripheral blood memory (CD27+IgD– B cells) B cells when assessed by flow cytometry (data not shown). However, due to the retrospective type of analysis, no B cell subset data were available for low IgE type 2 patients.
The formation of IgE in vivo is only partially understood 19. Although IgE is a class‐switched Ig‐isotype requiring CD40L expression by T helper cells 20, total IgE levels are relatively high in mice or humans with T helper cell defects or complex human immunodeficiencies such as Wiskott Aldrich or Omenn syndrome 7, 21. Class‐switching to IgE can happen either directly or in a stepwise fashion via class‐switching first to IgG1 and then to IgE 22. Immature B cells switch preferentially from IgM directly to IgE by passing the intermediate class switch to IgG1 22. Direct or indirect class‐switching to IgE has been shown to have an influence on whether a B cell differentiates into a memory B cell or an IgE‐producing plasma cell 23. Earlier studies have shown a correlation of IgE and IgA as mucosal immunoglobulins 24. In our study, only low IgE type 1 was associated with low serum IgA, while IgA was mainly normal in IgE type 1 (Supporting information, Fig. S2).
Patients with antibody deficiencies are often diagnosed with a significant delay 12, 25. This may be partly because the health‐care professionals involved in evaluating these patients are unaware of this differential diagnosis. Some of these patients, due to shared symptoms such as rhinitis and coughing, will be evaluated in out‐patient allergy units 25. Our data imply that among patients evaluated in allergy clinics with low (< 4 kU/l) serum IgE, high sensitivity assays for serum IgE and/or analysis of IgG subclass levels could serve as a means to stratify these patients further. If IgG3 is normal, but other IgG subclasses (and IgA) are low and/or serum IgE is very low (< 0·35 kU/l) and clinical evaluation does not reveal allergy as a probable cause of the patient symptoms, these individuals should be evaluated further for the diagnosis of antibody deficiency and might profit from immunoglobulin substitution.
Furthermore, patients with a low IgE type 2 pattern (low IgG3 and IgG4 but otherwise normal immunoglobulins) probably do not have classical antibody deficiency, but may represent a yet to be defined subcohort of patients with allergy‐like symptoms.
The detailed clinical and immunological characterization of patients with a low IgE type 1 and low IgE type 2 pattern will be defined further in a prospective cohort study.
Disclosure
The authors have no disclosures regarding this paper.
Author contributions
M. R. and M. E. designed the project, analysed data and wrote the manuscript. V. G. and I. H. analysed data, wrote the manuscript and designed parts of the study. M. B. performed experiments. C. B., A. B., T. D. and A. N. analysed data and wrote the manuscript.
Supporting information
Additional Supporting information may be found in the online version of this article at the publisher's web‐site:
Fig. S1. Comparison of serum immunoglobulin levels [immunoglobulin (Ig)G, IgM, IgA and IgG subclasses as indicated] in sera from patients in immunodeficiency referral (closed symbols) versus allergy referral patients (open symbols) with IgE serum levels > 4 kU/l. Patients with primary or secondary antibody deficiency were excluded. No significant differences were found for any of the immunoglobulin subclasses as determined by Kruskal–Wallis test.
Fig. S2. Comparison of serum immunoglobulin (Ig)A levels in sera from patients in immunodeficiency referral (closed symbols) versus allergy referral patients (open symbols) with IgE serum levels < 4 kU/l. A Mann–Whitney test was performed for statistical significance (****P‐value < 0·0001).
Acknowledgements
M. R. was supported by the Swiss national Science foundation (PP00P3_144863) and the Gebert Rüf foundation (GRS‐058/14).
References
- 1. Burton OT, Oettgen HC. Beyond immediate hypersensitivity: evolving roles for IgE antibodies in immune homeostasis and allergic diseases. Immunol Rev 2011; 242:128–43. [DOI] [PMC free article] [PubMed] [Google Scholar]
- 2. Marichal T, Starkl P, Reber LL et al A beneficial role for immunoglobulin E in host defense against honeybee venom. Immunity 2013; 39:963–75. [DOI] [PMC free article] [PubMed] [Google Scholar]
- 3. Martins TB, Bandhauer ME, Bunker AM, Roberts WL, Hill HR. New childhood and adult reference intervals for total IgE. J Allergy Clin Immunol 2014; 133:589–91. [DOI] [PubMed] [Google Scholar]
- 4. Zetterstrom O, Johansson SG. IgE concentrations measured by PRIST in serum of healthy adults and in patients with respiratory allergy. A diagnostic approach. Allergy 1981; 36:537–47. [DOI] [PubMed] [Google Scholar]
- 5. Yang L, Fliegauf M, Grimbacher B. Hyper‐IgE syndromes: reviewing PGM3 deficiency. Curr Opin Pediatr 2014; 26:697–703. [DOI] [PubMed] [Google Scholar]
- 6. Su HC, Jing H, Zhang Q. DOCK8 deficiency. Ann NY Acad Sci 2011; 1246:26–33. [DOI] [PubMed] [Google Scholar]
- 7. Ozcan E, Notarangelo LD, Geha RS. Primary immune deficiencies with aberrant IgE production. J Allergy Clin Immunol 2008; 122:1054–62; quiz 1063–4. [DOI] [PubMed] [Google Scholar]
- 8. Smith JK, Krishnaswamy GH, Dykes R, Reynolds S, Berk SL. Clinical manifestations of IgE hypogammaglobulinemia. Ann Allergy Asthma Immunol 1997; 78:313–8. [DOI] [PubMed] [Google Scholar]
- 9. Magen E, Schlesinger M, David M, Ben‐Zion I, Vardy D. Selective IgE deficiency, immune dysregulation, and autoimmunity. Allergy Asthma Proc 2014; 35: e27–33. [DOI] [PubMed] [Google Scholar]
- 10. Unsworth DJ, Virgo PF, Lock RJ. Immunoglobulin E deficiency: a forgotten clue pointing to possible immunodeficiency? Ann Clin Biochem 2011; 48(Pt 5):459–61. [DOI] [PubMed] [Google Scholar]
- 11. McVicker S, Karim MY. IgE deficiency may indicate underlying hypogammaglobulinaemia? J Clin Pathol 2014; 67:832–3. [DOI] [PubMed] [Google Scholar]
- 12. Holding S, Jolles S. Current screening approaches for antibody deficiency. Curr Opin Allergy Clin Immunol 2015; 15:547–55. [DOI] [PubMed] [Google Scholar]
- 13. Hamilton RG. Proficiency survey‐based evaluation of clinical total and allergen‐specific IgE assay performance. Arch Pathol Lab Med 2010; 134:975–82. [DOI] [PubMed] [Google Scholar]
- 14. Gaujoux R, Seoighe C. A flexible R package for nonnegative matrix factorization. BMC Bioinformatics 2010; 11:367. [DOI] [PMC free article] [PubMed] [Google Scholar]
- 15. Abrahamian F, Agrawal S, Gupta S. Immunological and clinical profile of adult patients with selective immunoglobulin subclass deficiency: response to intravenous immunoglobulin therapy. Clin Exp Immunol 2010; 159:344–50. [DOI] [PMC free article] [PubMed] [Google Scholar]
- 16. Barton JC, Bertoli LF, Barton JC, Acton RT. Selective subnormal IgG3 in 121 adult index patients with frequent or severe bacterial respiratory tract infections. Cell Immunol 2016; 299:50–7. [DOI] [PubMed] [Google Scholar]
- 17. Collins AM, Jackson KJ. A temporal model of human IgE and IgG antibody function. Front Immunol 2013; 4:235. [DOI] [PMC free article] [PubMed] [Google Scholar]
- 18. Jonsson F, Mancardi DA, Kita Y et al Mouse and human neutrophils induce anaphylaxis. J Clin Invest 2011; 121:1484–96. [DOI] [PMC free article] [PubMed] [Google Scholar]
- 19. Pate MB, Smith JK, Chi DS, Krishnaswamy G. Regulation and dysregulation of immunoglobulin E: a molecular and clinical perspective. Clin Mol Allergy 2010; 8:3. [DOI] [PMC free article] [PubMed] [Google Scholar]
- 20. Bacharier LB, Geha RS. Molecular mechanisms of IgE regulation. J Allergy Clin Immunol 2000; 105(2 Pt 2):S547–58. [DOI] [PubMed] [Google Scholar]
- 21. McCoy KD, Harris NL, Diener P et al Natural IgE production in the absence of MHC Class II cognate help. Immunity 2006; 24:329–39. [DOI] [PubMed] [Google Scholar]
- 22. Wesemann DR, Magee JM, Boboila C et al Immature B cells preferentially switch to IgE with increased direct Smu to Sepsilon recombination. J Exp Med 2011; 208:2733–46. [DOI] [PMC free article] [PubMed] [Google Scholar]
- 23. He JS, Meyer‐Hermann M, Xiangying D et al The distinctive germinal center phase of IgE+ B lymphocytes limits their contribution to the classical memory response. J Exp Med 2013; 210:2755–71. [DOI] [PMC free article] [PubMed] [Google Scholar]
- 24. Kolmannskog S, Haneberg B. Immunoglobulin E in feces from children with allergy. Evidence of local production of IgE in the gut. Int Arch Allergy Appl Immunol 1985; 76:133–7. [DOI] [PubMed] [Google Scholar]
- 25. Hausmann O, Warnatz K. Immunodeficiency in adults a practical guide for the allergist. Allergo J Int 2014; 23:261–8. [DOI] [PMC free article] [PubMed] [Google Scholar]
Associated Data
This section collects any data citations, data availability statements, or supplementary materials included in this article.
Supplementary Materials
Additional Supporting information may be found in the online version of this article at the publisher's web‐site:
Fig. S1. Comparison of serum immunoglobulin levels [immunoglobulin (Ig)G, IgM, IgA and IgG subclasses as indicated] in sera from patients in immunodeficiency referral (closed symbols) versus allergy referral patients (open symbols) with IgE serum levels > 4 kU/l. Patients with primary or secondary antibody deficiency were excluded. No significant differences were found for any of the immunoglobulin subclasses as determined by Kruskal–Wallis test.
Fig. S2. Comparison of serum immunoglobulin (Ig)A levels in sera from patients in immunodeficiency referral (closed symbols) versus allergy referral patients (open symbols) with IgE serum levels < 4 kU/l. A Mann–Whitney test was performed for statistical significance (****P‐value < 0·0001).