

Abstract
The use of sentinel species for population and ecosystem health assessments has been advocated as part of a One Health perspective. The Arctic is experiencing rapid change, including climate and environmental shifts, as well as increased resource development, which will alter exposure of biota to environmental agents of disease. Arctic canid species have wide geographic ranges and feeding ecologies and are often exposed to high concentrations of both terrestrial and marine-based contaminants. The domestic dog (Canis lupus familiaris) has been used in biomedical research for a number of years and has been advocated as a sentinel for human health due to its proximity to humans and, in some instances, similar diet. Exploiting the potential of molecular tools for describing the toxicogenomics of Arctic canids is critical for their development as biomedical models as well as environmental sentinels. Here, we present three approaches analyzing toxicogenomics of Arctic contaminants in both domestic and free-ranging canids (Arctic fox, Vulpes lagopus). We describe a number of confounding variables that must be addressed when conducting toxicogenomics studies in canid and other mammalian models. The ability for canids to act as models for Arctic molecular toxicology research is unique and significant for advancing our understanding and expanding the tool box for assessing the changing landscape of environmental agents of disease in the Arctic.
Graphical abstract

1. Introduction
Sentinel species serve as early warning indicators of ecosystem conditions as part of the “One Health” paradigm that utilizes a holistic approach to disease management in ecosystems, wildlife, and human populations. Some apex mammalian predators and omnivores are commonly utilized as sentinel species because of their relatively long life spans, subcutaneous fat stores that accumulate lipophilic anthropogenic contaminants, and accumulation of some nonlipophilic contaminants in relatively easily accessible matrices such as hair.1 The Arctic Monitoring and Assessment Program (AMAP) region (henceforth “Arctic”; Figure 1; www.amap.no) contains populations of both marine and terrestrial mammals, some of which have value as environmental sentinels.2,3 Although it is difficult to generalize risk assessment of contaminants across species or geographic ranges, several studies have indicated that concentrations of some contaminants (i.e mercury (Hg) and some polychlorinated biphenyl (PCB) congeners) are above thresholds of concern or correlate with potential adverse effects in some Arctic populations or subpopulations (see reviews).4–6 Increasing environmental variability, due in part to climate change and human development, will undoubtedly influence contaminant exposure, body condition, and pathogen exposure.7,8 The health effects of contaminants in this context has not been well explored, thus making it increasingly prudent to develop tools to assess the health of individuals, populations, and ecosystems of northern latitudes.
Figure 1.

Boundary of the Arctic Monitoring and Assessment Program (AMAP) that will be considered as the delineation for the “Arctic” region in this study. Figure from AMAP (2009).
Adverse effects concentrations and thresholds for toxic contaminant exposure are most often derived in controlled laboratory settings as solitary agents. In natural settings, exposure to complex mixtures can make the derivation of thresholds of adverse health effects in wild populations challenging, especially with respect to environmentally relevant mixtures of contaminants. However, using molecular toxicology methods, including assessments of mRNA populations (i.e., all mRNA molecules present in a sample), it is possible to detect biological responses at low exposure concentrations that provide insight on specific biochemical pathways involved.9 Although linking changes in gene expression to higher levels of biological organization (i.e., adverse outcome pathways (AOPs) is often challenging, these data can assist with descriptions of mechanistic pathways of biotransformation and potential injury from novel and emerging contaminants, and they also provide documentation of a biological response. Many Arctic predators (including humans) have relatively high concentrations of some inorganic and organic environmental contaminants (e.g., Hg, PCBs) and are thus suitable for studying the molecular toxicology of environmentally relevant concentrations of chemical mixtures.4,10
The Arctic contains populations of free-ranging canid species such as the Arctic fox (Vulpes lagopus), red fox (Vulpes vulpes), coyotes (Canis latrans), and the gray wolf (Canis lupus). Some populations of Arctic foxes and gray wolves have been shown to have extremely variable diets and, depending on location and season, can reflect components of both marine and terrestrial ecosystems.11–13 The consumption of marine derived nutrients is associated with increased concentrations of mercury (Hg), and elevated concentrations of Hg have been found in both foxes and wolves due to an increase in marine-based foraging.11,13 This enhances their utility as sentinels, especially for coastal human inhabitants with similar mixed utilization of terrestrial and marine resources. Marine- and freshwater-derived diet items, including diadromous salmonids, represent an important component of Arctic human and canid diets and are key components for contaminants pathways across the landscape. Due to their circumpolar distribution and previous use as biomedical models, the Arctic fox represents a valuable sentinel for Northern contaminant monitoring.14–16
In addition to free ranging canids, many northern communities (especially in areas of Alaska and Canada) are home to large teams (kennels) of sled dogs. Operators of these kennels often use locally derived diets that are similar to the resident human populations.17 The sled dog has previously been utilized as a biomedical model in controlled feeding experiments examining the metabolism and physiological effects of exposure to organohalogens via whale blubber, which is an important subsistence item in many Arctic communities.18–20 Sled dogs do not engage in some activities that often complicate epidemiologic toxicology studies (i.e., tobacco and alcohol use), and they represent diverse trophic feeding levels and feeding ecologies (omnivory), which often mirror the cohabiting human populations.17 Moreover, these dogs are housed in immediate vicinity to their handlers and are thus also mirroring nondietary environmental exposures such as airborne particulate matter (i.e., wood smoke). Particulate matter (PM) from vehicle emissions, wood stoves, and other combustions sources can become elevated during cold weather, especially in areas susceptible to temperature inversions such as Fairbanks, Alaska.21 Elevated PM concentrations have been implicated as a causative or exacerbating factor in a number of diseases that involve oxidative stress, alterations in DNA methylation and damage, and cellular injury and have been correlated to a number of clinical disease states.22 Sled dogs serve as excellent models for PM exposure and toxicogenomics studies for a number of reasons: (1) they are housed outdoors, eliminating the indoor and outdoor exposure gradient; (2) most animals are under similar kennel-wide diet and exercise regimens; (3) pedigrees are known for several generations, allowing for posthoc gene-environment interaction analyses; and (4) they can be easily assessed for the interaction between diet and environmental stressors, such as ultraviolet (UV) exposure or air pollution that is similar to humans in the area.
Environmental contaminants from dietary and airborne sources, while often utilizing different exposure and detoxification pathways, can nonetheless lead to similar general mechanisms of cellular injury such as oxidative stress. Inducible molecular mechanisms exist that can protect against or repair oxidative damage,23 and many utilize sulfur (S) or selenium (Se) -based systems. Some S-based antioxidants such as glutathione (GSH), metallothionein, and thioredoxin reductase (TXNRD) are induced or activated by oxidative stress.24,25 Inducible cellular defenses to oxidative stress, such as those coordinated by the Nrf-1 and Nrf-2 binding to antioxidant response elements (ARE), have been shown to respond to a wide array of environmental stressors including cigarette smoke, environmental toxicants, and other inflammatory stressors.26 Many toxicogenomics studies compare differences between pre- and post-treatment expression (i.e., Bouwens et al.);24 however, this study design may not account for stochastic and time-dependent changes in gene expression.28 For instance, Robinson et al. found that in mice, following exposure to 6 mg/kg MeHg+, a number of genes that were up-regulated at 8 h were not up-regulated 12 h post-exposure, and Robinson thus concluded that MeHg+-induced changes in gene expression may occur in a time-dependent manner.29 Indeed, the lag in sampling following contaminant exposure, chronic or acute, may account for some of the variation seen within and between toxicogenomics studies (Figure 2). Long-term studies of changes in gene expression due to diet or contaminant exposure are rare, and studies involving lower exposure concentrations (i.e., environmentally relevant), such as those encountered via dietary and occupational exposure, may benefit from long-time-scale examinations of changes in gene expression.
Figure 2.
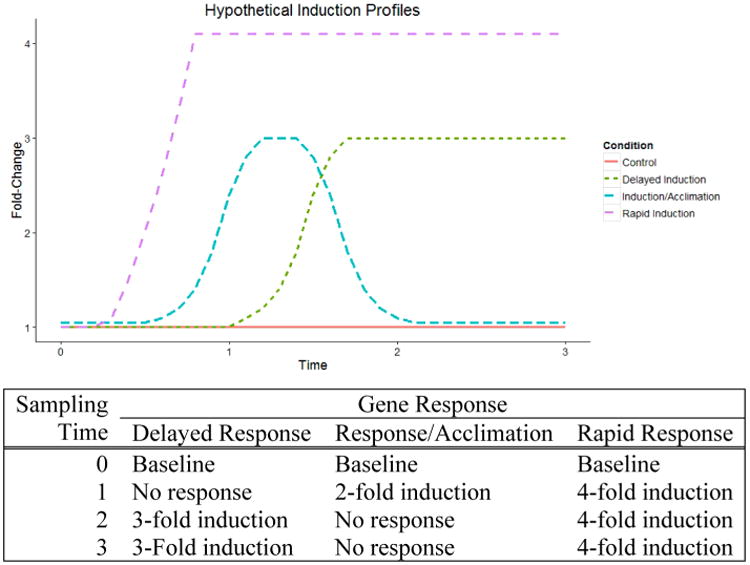
Hypothetical up-regulation (a) and down-regulation (b) profiles for genes expressed over time in response to environmental contaminants. By sampling at time 0 (baseline) and comparing the expression of these genes to post-treatment time points (time 1–3), we determined that it is clear that some gene response and time points will result in variable ability to detect biological response (c).
We present three scenarios evaluating the utility of Arctic canine models to describe gene expression in response to exposure to environmental contaminants. We demonstrate that (1) domestic sled dogs have time-dependent transcriptomic changes as a result of a 50% piscivorous diet (compared to 0% fish diet); (2) gene expression of free-ranging foxes can be reliably analyzed using a domestic canine microarray, and these data can be used to model toxicant interactions of an environmental mixture of PCBs and Hg; and (3) domestic sled dogs can be effective models for transcriptomic changes caused by exposure to air pollution as measured by PM. We investigate the boundaries of the Arctic canid model, including key caveats of study design and limitations of extending this model in a One Health context, and provide evidence that, despite difficulties in sampling associated with free ranging species and cold climates, samples collected in the field are of good quality for high-throughput molecular toxicology analyses. We also examine the potential use of a commercially available canine microarray for use in an Arctic fox model using strict quality-assurance measures (cross-species validation). Furthermore, our study emphasizes the potential uses of transcriptomics analyses in canid sentinel species to evaluate the response to several toxic agents, including airborne particulate matter, mercury via fish consumption, and diets with chemical mixtures containing PCBs and Hg.
2. Experimental Section
2.1. Fish-Fed Sled Dogs
The general study design and Hg findings for this study are described in full in Lieske et al.30 Briefly, eight sled dogs were randomly assigned to two feeding groups: a control group that was fed commercial fish-meal-free dog kibble (n = 4) (Standard Choice 26% Value Meal dog food, Fromm Family Foods, Mequon, WI) and a fish-fed group (n = 4), which was given a 50% fish diet (one meal of chum (keta) salmon (Oncorhynchus keta) and another meal of kibble each day; details of diet composition are described in Lieske et al).30 Each treatment group consisted of two male and two female animals. Blood samples were collected via venipuncture from each dog 2 weeks prior to the controlled feeding, as well as once weekly during weeks 0–4 and once biweekly during weeks 6–12.
To compare gene expression between the two groups over the course of the 13-week experiment, we utilized a repeated-measures ANOVA, in which gene expression was compared between treatment groups with error nested in individual–week interactions. To eliminate differences in expression on the basis of intrinsic differences between individuals (i.e., differences in gene-expression pretreatment), we determined that expression values are reflected as fold-change difference from Week 0.
| (1.1) |
2.2. Mixtures of Hg and PCBs in Arctic Foxes
A total of 12 Arctic foxes were captured during July 2007 using Tomahawk live traps baited with canned tuna in oil placed outside of den sites and fox travel sites in the Deadhorse and Prudhoe Bay area, Alaska. Animals were sampled to study the health of free-ranging Arctic foxes, including an assessment of disease and contaminants (approved by the UAF Animal Care and Use Committee, IACUC 07-20 and 07-30). Animals were placed in a squeeze trap for the injection of immobilants via hand syringe [∼ 6 mg/kg ketamine and 3 mg/kg xylazine (20 mg of ketamine and 10 mg of xylazine for 2.3 to 3.6 kg] intramuscularly in the hind leg. Mass, sex, and body morphometry were recorded. A cursory physical examination (description of pelage, teeth wear, scars, injuries, etc.) was performed by a veterinarian to identify any health issues. Blood (approximately 10–14 mL) was directly collected from the jugular vein (cephalic vein and femoral artery as backup) using a 21 g ¾ in. needle blood collection set (“butterfly”). Blood volume draw did not exceed 1% of total body weight. After recovery from immobilants, animals were released back to the wild at their site of capture.
Of the animals captured, 11 Arctic foxes were selected for this study, and the Hg and PCB levels had been determined for each animal (Table 1). We used two different strategies to analyze the microarray data. Our first approach divided the animals in groups on the basis of the levels of Hg or PCB measured in tissue. This resulted in two discrete groups each of “low” (blood 5.5 ppb −22.1 ppb) and “high” (blood = 26.6–55 ppb) THg and low (below detection −0.77 ppb) and high (2.47–4.69) Σ(40)PCBs. Genes with statistically significant differential expression in the low- versus high-Hg or -PCB groups were identified using the Bioconductor limma package. The p values were calculated with a modified t test in conjunction with an empirical Bayes method to moderate the standard errors of the estimated log-fold changes. The p values were adjusted for multiplicity with the Bioconductor package “qvalue”, which allows for selecting statistically significant genes while controlling the estimated false discovery rate. A limitation of dividing animals into groups of low and high Hg or PCB levels is that there is a considerable range of Hg or PCB concentrations, and it is somewhat arbitrary to define which animals are designated “low” or “high”. Furthermore, some animals with low Hg have relatively high levels of PCB and vice versa. Given that the samples were derived from Arctic foxes living in the wild, it was not possible to control Hg and PCB levels. Therefore, we employed a second analysis strategy that did not require assignment of animals to discrete groups of low and high Hg and PCB levels but, rather, treated Hg and PCB levels as continuous variables in the linear model for gene expression.
Table 1. [THg] in Hair and Blood and [ΣPCBS] in Blood for 11 Arctic Foxes Caught in 2007a.
| animal ID | sex | blood THg (ppb) | hair THg (ppm) | blood Σ(40)PCBs (ppb) |
|---|---|---|---|---|
| AFX07–001 | M | 12.3 | 0.55 | 2.47 |
| AFX07–002 | F | 20.6 | 0.81 | 2.97 |
| AFX07–003 | M | 17.9 | 1.02 | 0.18 |
| AFX07–004 | M | 5.5 | 0.39 | 0 |
| AFX07–005 | F | 27.9 | 1.46 | 0 |
| AFX07–006 | M | 22.1 | 0.59 | 0.51 |
| AFX07–007 | F | 12.2 | 0.44 | 0 |
| AFX07–008 | F | 26.6 | 0.74 | 0.77 |
| AFX07–009 | F | 55.5 | 5.1 | 3.17 |
| AFX07–010 | M | 18.3 | 0.75 | 0.07 |
| AFX07–011 | F | 31.4 | 1.73 | 4.67 |
Blood [THg] values are shown as wet weight in parts per billion, and hair [THg] values are given as dry weight in parts per million. [ΣPCBS] values in blood are shown for 40 PCB congeners and expressed in (ng/g) wet weight.
2.3. PM Air Pollution Study
A detailed description of PM25 (particulate matter with diameter less than 2.5 μm) characterization and sampling design is presented in Montrose et al.31 Briefly, three mushing kennels were selected, with two kennels located within the Environmental Protection Agency's (EPA) PM25 nonattainment boundary established for the Fairbanks North Star Borough (FNSB) in 2009. The third kennel was located ∼30 km outside of the Environmental Protection Agency (EPA) nonattainment area for PM25. The three kennels had varying concentrations of PM25 throughout the course of the study period (November 2012–March 2013).31 The 3 week period immediately preceding the blood sampling effort (January 26–February 15, 2014) was used to determine that the subjects in Kennel C had significantly lower PM25 concentrations than those in both kennel A and kennel B. For each kennel, 28–30 dogs were sampled. Dogs from kennel C were assigned to the “low exposure” group (n = 28), and dogs from kennel A and kennel B were combined into the “high exposure” group (n = 59). Blood samples were collected via jugular or cephalic venipuncture. Hematological variables were measured by the UAF Animal Resource Center using DriChem 4000 Chemistry Analyzer (Heska, Colorado) and CBC-Diff Veterinary Analyzer (Heska, Colorado).
Normality of quantitative hematological variables (presented in Montrose et al.)31 and gene expression data were analyzed using Shapiro-Wilk test. Variables that were non-normally distributed were log2-transformed. Some variables were non-normally distributed after log2 transformation; these variables were excluded from ANOVA analysis and instead assessed by nonparametric analysis using the Mann–Whitney rank sum test. A one-way ANOVA was used to assess differences between exposure groups (high versus low), and significant differences between response variables were assessed using Tukey's HSD. To investigate potential associations between gene expression and hematological variables, we conducted simple linear regressions, with quantitative hematological variables serving as the independent variable and gene expression as the dependent variable. Outliers were examined using the Bonferroni inequality for computing p values for studentized residuals. Observations with adjusted p-values of p < 0.01 were determined to be outliers and removed from regression analysis. Normality of residuals was examined for all regressions using Q–Q plots.
2.4. General Methods
2.4.1. RNA Preservation and Extraction
All blood samples destined for molecular analyses were collected in PAXgene (Qiagen) RNA tubes and stored on ice in the field until they were placed in −20 °C or −80 °C freezers. RNA was extracted using PaxGene Blood miRNA Kit (Qiagen) and quantity and integrity determined using an Agilent 2100 Bioanalyzer (Agilent Technologies) or a Nano-Drop ND-1000 Spectrophotometer (Thermo Fisher Scientific).
2.4.2. RNA Quality Assurance
RNA integrity within the cell is dependent on a complex series of responses that are set in motion in response to insult (prior to or concurrent with sampling), including the critical interval between the time of collection and time of tissue preservation (e.g., stabilization of mRNA). Mechanisms of RNA degradation are complex and varied and not necessarily consistent across the population of mRNAs. Thus, multiple measures of RNA and assay quality are required, especially under conditions in which novel applications are being attempted, such as sampling in extreme field conditions (captured Arctic fox on the coast of the Arctic Ocean; remote dog kennels).
RNA samples were quantified by measuring OD260 using a Nanodrop spectrophotometer (Thermo Scientific, Wilmington, DE). RNA purity was assessed by measuring OD260/280 (protein contamination) and OD260/230 (contamination with organics) ratios. All samples had OD260/280 between 1.8 and 2.2. RNA integrity was assessed with a Bioanalyzer 2100 (Agilent Technologies, Palo Alto, California) using the RNA Pico kit. RNA integrity numbers (RIN) were calculated for each sample. The High Pure miRNA Isolation Kit (Roche) was used to clean samples with low RIN values. Additional measures of RNA quality are presented for the Arctic fox study because cross-species hybridization of cDNA microarrays requires stringent RNA quality standards (see the Supporting Information).
2.4.3. Targeted Gene Analysis by TaqMan-Based Quantitative RT-PCR Analysis
Genes selected for q-RT-PCR analysis (n = 18) were chosen on the basis of involvement with sulfur-and selenium-based antioxidant systems and are presented in Table S1. Synthesis of cDNA was done using SuperScript III Reverse Transcriptase and Random Hexamers according to the manufacturer's protocol. Primers utilized were selected on the basis of canine primers available from Applied Biosystems (TaqMan Gene Expression Assays), and context sequences are available in Table S1. q-RT-PCR was conducted using the Biomark HD System by Fluidigm (Fluidigm, San Francisco, CA) and Applied Biosystems Sequence Detection System (ABI 7900, Life Technologies, Grand Island, NY).
2.4.4. Microarray Processing and Data Analysis
The Functional Genomics and Proteomics Facility Core of the Center for Ecogenetics and Environmental Health at the University of Washington followed the manufacturer's protocols for processing Affymetrix GeneChip Canine Genome 2.0 arrays (Santa Clara, CA). Hybridized arrays were scanned with an Affymetrix GeneChip 3000 scanner. Raw microarray data were preprocessed and analyzed with Bioconductor (http://www.bioconductor.org/).32 Several quality-control steps were carried out to ensure data was of high quality: (1) the visual inspection of the GCOS DAT chip images, (2) the visual inspection of the chip pseudoimages generated by the Bioconductor affyPLM package, (3) the generation of percent present calls and average background signals with the Bioconductor simpleaffy package, (4) the generation and inspection histograms of raw signal intensities, and (5) the generation and comparison of the relative Log expression and normalized unscaled standard errors using the Bioconductor affyPLM package. All microarray data derived from Affymetrix GeneChip Canine Genome 2.0 arrays used in this study have been deposited in the Gene Expression Omnibus Database under accession number GSE71407 (http://www.ncbi.nlm.nih.gov/geo/).
2.1.5. Hg Analysis
Total Hg was measured as in Lieske et al.30 Briefly, total mercury concentrations ([THg]) were measured in whole blood from sled dogs and Arctic foxes using a DMA-80 analyzer (Milestone, Sorisole, BG, Italy) in at least two repeated samples. Blanks were below 0.1 ng THg, and standards including DORM-3 (National Research Council Canada), Lake Superior 1946 frozen fish homogenate (National Institute of Standards and Technology), and IAEA-086 human hair (International Atomic Energy Agency Analytical Quality Control Services) were all within 10% of their expected values. For further details of THg analysis in canids see refs 13 and 30.
2.1.6. PCB Analysis
PCB concentrations were determined in fox whole blood following modified procedures of Sloan et al. and Knott et al.33,34 Individual PCB congeners were analyzed using low-resolution quadruple gas chromatograph–mass spectroscopy (GC–MS) at the NOAA and NMFS Montlake laboratory in Seattle, WA. Each sample batch (n = 14) included a series of external standards and were based on a five-point calibration curve. Percent recoveries for these batches of samples were 98.7 ± 1.7%, 102.1 ± 1.9%, and 100.0 ± 15.9% for internal spike (PCB103) in blood–standard reference material (SRM)–method blank, certified congeners from SRM, and congeners of duplicates, respectively. All method blanks analyzed were below the limit of detection (no blank correction used).
Details regarding solvent extraction, filtration, cleanup, calibration, individual congeners analyzed, and QA/QC is available in the Supporting Information.
2.1.7. Statistical Analyses
All statistics and figures were generated using R programming language and ggplot2 package35,36 as well as the Bioconductor packages limma, qvalue, affy, and affyPLM.37–40
3. Results/Discussion
3.1. q-RT-PCR-Based Gene Expression Analysis in Fish-Fed Sled Dogs Sampled over 13 Weeks
We used q-RT-PCR to assess expression of genes associated with heavy-metal metabolism and oxidative stress including CARM1, GCLC, GCLM, GPX1, GSTA3, GSTA4, GSTM3, GSTP1, GSTT1, MPST, MT1F, MT2A, MT4, MTR, SLC1A4, SLC1A5, SLC3A1, and TST (see Table S1). By examining the toxicodynamics of THg in WB (Figure 3), we concluded that the concentration of THg plateaued starting at approximately Week 11. Using a repeated-measures ANOVA with the error nested in individual variation per treatment group across all weeks of the treatment, no genes were determined to be expressed differently between treatment groups, although the power of these models was hindered by large variability in individual gene expression levels and low sample size. By comparing the fold-change difference in expression from Week 0 expression to that of Week 11 using posthoc paired t-tests, we determined one gene (metal-lothionein 2A (MT2A)) to be differentially expressed between the two treatment groups following Holm multiple test correction (Figure 4a, p < 0.01). However, upon examination of individual dog expression profiles over the course of the feeding trial, it is clear that some animals displayed 2–10 fold up-regulation and down-regulation over the course of the experimental period (e.g., expression of MT2A shown in Figure 4b). If we simply assessed Week 11 alone, and not the time course variation in MT2A, we could have erroneously concluded a biologically and statistically significant difference in expression. We illustrate here that evaluating sulfur-dependent antioxidant systems using a standard pre- versus post-diet analysis of gene expression does not adequately capture the variability and stochasticity of domestic animal models over the temporal scale utilized in this experiment.
Figure 3.

Concentrations of THg in WB measured in sled dogs fed 50% fish and 50% kibble (fish group, n = 4) and 100% kibble (kibble group, n = 4). THg values for the kibble group were below detection limit for all weeks sampled. Data from Lieske et al.30
Figure 4.

(a) MT2A expression at Week 11 (fold-change from Week 0) was determined to be significantly different between treatment groups. Error bars represent standard error (b). However, some dogs showed large variability in MT2A expression (log2 fold-change) for Week n compared to Week 0 over the course of the feeding trial. Here, the gray lines represent the mean for each treatment group per week. Each colored line represents an individual animal. We emphasize that single-time point analysis of gene response might not reflect variability found in in vivo studies.
Although Lieske et al.30 estimated dietary THg intake, the nutritional content and contaminant concentrations of fish are very different than kibble alone. Bouwens et al. demonstrated gene expression changes in response to dietary supplementation of fish oil in human peripheral blood monocytes (PBMCs).27 Although the animals were of similar age, sex, and body condition, individual variation likely plays a large role in both baseline expressions of inducible genes as well as individual response to environmental stimuli.41 Indeed, our data seem to support both observations because although the mean expressions values of some genes were consistently different between the two groups, the variability within groups (i.e., individual variation) as well as small sample size prevented differences in expression from being rigorously elucidated. We emphasize that we are not attempting to describe a dose–response relationship as a different study design would be needed. Although it is conceivable that there may be changes in transcriptional profiles at low doses of mercury, Radonjic et al.42 only found altered gene expression in the cerebellums of developing rats at MeHg+ doses that were 1 order of magnitude higher than the estimated dose in this study (0.100 mg/kg body weight versus 0.013 mg/kg body weight this study). The current study design featured continuous dietary exposure to Hg [THg], thus time (week) and [THg] in WB were highly correlated (r = 0.91). Thus, it would be not feasible to try and tease out the actual effects of Hg on gene expression using this study design as the use of fish as the vehicle for delivering Hg is not an inert method. It is interesting to consider that, although it would be difficult to assign changes in gene expression to Hg in fish rather than other nutrients and contaminants, it may be worthwhile to compare the results from a fish-based feeding study to laboratory experiments of Hg exposure. In other words, it is important to consider that changes in physiology associated with Hg exposure in a laboratory setting might be absent in a fish-based diet exposure due to protective nutrients collocated in fish (i.e., selenium and polyunsaturated fatty acids).43
Many toxicological, pharmacological, and nutritional studies have been designed to describe changes in gene expression associated with a treatment, yet there is a paucity of data concerning “normal” or “baseline” expression levels to which to compare treatment groups (e.g., fish-fed and no-fish-in-diet groups). Whitney et al. found effects of sex, age, and time-dependence (what time of day blood was drawn) and considered 2-fold differences in expression levels as over- or under-expressed.41 Although there have been a few studies that have examined environmental toxicant-induced changes in gene expression over small time scales (i.e., 8–12 h,29), very few have examined the transcriptomic response of a model organism over extended time periods. In the present study, we found that some individuals, even those maintained on the kibble diet, demonstrated 2-fold increases and decreases in gene expression on numerous time-points over the course of the study (see Figure 4). Although it is conceivable that observed changes in gene expression could be related to other environmental factors that were not controlled for in the present study, we argue that establishing values for variation in baseline (i.e., normal) expression is critical for assessing canine toxicogenomics and should be used to develop and validate potential biomarkers.
3.2. Mixtures of Hg and PCBs in Arctic foxes
A full description of methods for assessing RNA quality and probe hybridization in this cross-species assessment is presented in the Supporting Information. The RNA quality from the 11 Arctic fox samples here fell within the benchmark levels used to assess performance on this array (Table 2).
Table 2. UAF and UW CEEH Assessments and RIN Valuesa.
| UAF assessment | UW CEEH assessment | ||||
|---|---|---|---|---|---|
|
|
|
||||
| sample ID | animal ID | RNA yield | RIN | RNA yield | RIN |
| 121 | AF008 | 74.3 | 8.1 | 63 | 8.8 |
| 122 | AF002 | 255.7 | 6.1 | 215 | 8.9 |
| 123 | AF010 | 81.7 | 7.5 | 72 | 8.6 |
| 124 | AF011 | 89.0 | 8.6 | 79 | 9.2 |
| 125 | AF005 | 155.8 | 8.1 | 134 | 8.7 |
| 132 | AF006 | 113.0 | 6.7 | 96 | 7.9 |
| 133 | AF004 | 173.6 | 8.3 | 158 | 8.9 |
| 134 | AF001 | 100.4 | 8.2 | 95 | 8.8 |
| 143 | AF007 | 54.0 | 8.2 | 49 | 8.4 |
| 144 | AF003 | 74.4 | 8.6 | 66 | 8.4 |
| 1B | AF009 | 33.2 | 7.8 | 33 | 7.7 |
| Mean | 109.6 | 7.8 | 96.4 | 8.6 | |
| SD | 63.47 | 0.79 | 53.37 | 0.45 | |
| Range | 33.2–255.7 | 6.1–8.6 | 33.0–215.0 | 7.7–9.2 | |
RIN values greater than the Microarray Quality Control Consortium RNA Integrity Number 667 (RIN) > 8.0 are highlighted in bold text.
The PCB and Hg concentrations measured are well within the range of concentrations previously reported and expected (see Table 1). Analysis of microarray gene expression resulted in relationships with sex and concentrations of Hg or PCB for numerous genes known to be associated with these measures from previously published research, although small sample size and strict false-discovery control reduced the power of our models. For the model comparing gene expression by sex, a significant difference was noted for eukaryotic translation initiation factor 2, subunit 3 γ (EIF2S3) that has been documented to be more highly expressed in male dogs.44 The expression in the Arctic fox model was at least 2-fold higher in males (adjusted p value = 0.003). The significance of this finding is outlined by Nicolson et al. for the domestic dog and would apply to other canine models in that gender dimorphic toxicity should be considered an important factor to address.44 They investigated gene expression in the heart (ventricle and atrium), ileum, liver, and kidney (medulla and cortex) and showed that EIF2S3 is consistently highlighted across all six tissues examined (nearly three times over-expressed in male dogs).44 We document a similar finding in peripheral blood samples of the Arctic fox, and this provides another piece of evidence that this domestic dog microarray has utility for our model addressed here (conserved elements related to sex differences).
We found some evidence that thyroid hormone receptor interacting proteins (TRIP6 and TRIP10) have an altered expression related to sex and concentrations of toxicants in Arctic foxes, although following p value adjustment, the results were not statistically significant. Gauger et al. indicated that PCBs may interfere with thyroid hormone (TH) signaling by reducing TH levels in blood and exerting direct effects on TH receptors (TRs).45 Miyazaki et al. showed that hydroxylated PCB at doses as low as 10−10 M suppresses TH-induced transcriptional activation of TR.46 Similarly, Kirkegaard et al.18 found lower concentrations of T3 and T4 in plasma from sled dogs fed contaminated minke whale blubber compared to that from animals fed a control diet. In our models some evidence of interactions with PCBs was noted, but it was not conclusive. Although low sample size prevented a robust analyses of mixture effects on gene expression, we note that in light of the Arctic foxes' diverse foraging ecologies and the ability to retrieve high-quality RNA from remote field sites, the Artic fox represents a unique model for understanding toxicity of contaminant mixtures in Arctic ecosystems that can be enhanced using domestic-canine-based molecular tools.
3.3. Sled Dogs and Particulate Matter Pollution
Weldy et al. reported the glutathione (GSH) synthesis genes (GCLC and GCLM) were induced by exposure of endothelial cells and macrophages to collected diesel particulates in vitro.47 In our study, there was no difference in GCLC expression between the two exposure groups, although this may reflect exposure route of the particulates between our study and Weldy et al. (in vitro cell culture versus respiratory exposure and circulating leukocytes).47 No differences were observed in clinical examination variables (i.e., weight or temperature) or hematological variables (i.e., complete blood count; full list presented in Montrose et al.31) between the two exposure groups. Although mean values were often unequal, large intraexposure group variability prevented comparisons from being statistically significant. Similarly, gene expression did not vary between exposure levels, indicating that if there is indeed a measurable physiologic or transcriptomic response to observed levels of PM2.5 exposure, it could not be detected using these metrics or analytics.
The pathway of PM2.5 injury remains unclear, and it is important to identify potential confounding variables associated with gene expression levels if transcriptomic approaches are to be effective. Because of the relatively large sample size (n = 28–30 animals per kennel) and the exploratory nature of this study, we investigated potential confounding variables related to gene expression and physical and hematological variables.
PM2.5 has been observed to induce oxidative stress in peripheral blood.48 Glutathione peroxidase (GPx) activity is a common biomarker of oxidative stress. In this study, we did not detect any link between PM2.5 “dose” and GPX1 (coding for glutathione peroxidase (GPx)-1 isozyme) expression, although we did note a significant relationship between GPX1 expression and canine body mass (Figure 5a; n = 70; min= 17.7 kg; max =32.2 kg; median = 23.8 kg; p < 0.01, r = 0.30). GPx activity has previously been associated with measures of body condition. Espinoza et al. found that body mass index (BMI) was significantly positively associated with Gpx-1 expression at <30 kg/m2, and Ozata et al. found significantly greater GPx levels in obese individuals (BMI > 39 kg/m2) versus “healthy” individuals (BMI 21.75 ± 1.87 kg/m2).49,50 None of our study animals were determined to be obese, no doubt due largely to the incredible fitness of Alaskan sled dogs; however, we did note that heavier animals tended to have higher levels of GPX1 expression compared to smaller animals.
Figure 5.

(a) Log2 expression of GSTP1 was positively associated with the percent lymphocytes in the whole blood sample, and (b) log2 GPX1 expression was positively correlated with weight of the animal (kg) (p < 0.01).
Another biomarker of oxidative stress, 4-hydroxynonenal (4-HNE), is produced as a byproduct of lipid peroxidation and is biotransformed via GSH-dependent detoxification systems. GSTA4, coding for glutathione-s-transferase (GST) isozyme 4, has been shown to have catalytic efficiency toward conjugating 4-HNE to GSH and thus is an important enzyme in the 4-HNE induced apoptotic pathway.51 We found that expression of GSTA4 in dogs was significantly affected by the proportion of specific leukocyte populations (in this case, percent granulocytes, % GRA) in the blood. Similarly, GSTP1 (GST-π 1), which has been shown to be induced by oxidative stress in cultured human cells, showed a significant positive relationship with lymphocyte percentage (Figure 5b).52 Gene expression profiles have been shown to differ across leukocyte populations in humans, and it could explain the observations presented here.53 An alternative explanation is that both gene expression and leukocyte profiles are co-varying with another physiological variable that was not recorded in this study. Regardless, we emphasize the benefit of accompanying hematological data with assessments of gene expression in PBMCs in canid models.
The biological significance of these correlative findings is uncertain but does serve as a cautionary caveat (e.g., confounding variables) to interpreting transciptomic data especially in natural systems (i.e., uncontrolled settings). In toxicogenomics studies in which the pathway of cellular injury is not well described (i.e., PM exposure), it may be highly valuable to collect hematological and physical examination data on the study animals.
The use of Arctic canid species as models for investigating molecular toxicology of environmental contaminants presents a number of intriguing possibilities. Wild canids represent a number of ecosystems and feeding ecologies, while large kennels of domestic dogs (sled dogs) share a similar diet and air pollution exposure with humans.17 While we note that our initial studies revealed few significant differences in gene expression between exposure groups, we demonstrated that (1) successful hybridization of Arctic fox cDNA to a domestic dog array support the use of Arctic fox in molecular toxicology, and (2) sled dogs can be used as environmental sentinels to monitor changes in gene expression brought on by varying exposure to contaminants via diet or air pollution. We interpret our initial correlative findings with caution; however, we feel that with improved study design and control Arctic canid models have the potential to elucidate changes, if any, in gene responses to environmental contaminants. The results of these findings would have implications for not only describing biological responses to contaminants but also the health and status of Arctic wildlife populations and human inhabitants.
We have shown here that collecting gene expression data, in particular data collected from PBMCs, is feasible for field-based studies of free ranging and domestic populations. Using stabilization techniques, high-quality total RNA can be extracted from whole-blood samples collected in remote field conditions, widening the scope of molecular toxicology investigations. Although PBMCs represent an interesting tissue to examine for gene expression and can elucidate questions involving potential immunotoxicity and immune function, there are a number of questions that remain concerning baseline variability in gene expression and temporal response of gene transcription to toxic insult. Future investigations should establish methods for assessing sources of variation and stochasticity in PBMC gene expression to advance the field of molecular toxicology in wildlife and domestic animal populations.
Supplementary Material
Acknowledgments
The authors thank J. Castellini and C. Lieske for their assistance with field sampling and data collection and Daryle Boyd, Ron Pearce, and Jennie Bolton from the NMFS's Northwest Fisheries Science Center for assistance in PCB analyses of blood. We also thank Karsten Hueffer for his assistance with carrying out experiments as well as critical review of this manuscript. Funding for these studies was provided by grant number 5P20RR016466 from the National Center for Research Resources (NCRR) and in part by the NIEHS funded UW Center for Ecogenetics and Environmental Health (P30ES007033).
Footnotes
Supporting Information: The Supporting Information is available free of charge on the ACS Publications website at DOI: 10.1021/acs.est.5b04396.
Additional details on PCB analysis, Arctic fox and domestic dog homogeneity assessment, and microarray performance. Figures showing relative log expression (RLE) values and normalized unscaled standard errors (NUSE). Tables showing genes targeted for expression analysis and a description of particulate matter (PM) fractions and selected health effects. (PDF).
Notes: The authors declare no competing financial interest.
References
- 1.Bossart GD. Marine mammals as sentinel species for oceans and human health. Vet Pathol. 2011;48(3):676–690. doi: 10.1177/0300985810388525. [DOI] [PubMed] [Google Scholar]
- 2.Sonne C. Health effects from long-range transported contaminants in Arctic top predators: An integrated review based on studies of polar bears and relevant model species. Environ Int. 2010;36(5):461–491. doi: 10.1016/j.envint.2010.03.002. [DOI] [PubMed] [Google Scholar]
- 3.Sonne C, Bechshøft TØ, Rigét FF, Baagøe HJ, Hedayat A, Andersen M, Bech-Jensen JE, Hyldstrup L, Letcher RJ, Dietz R. Size and density of East Greenland polar bear (Ursus maritimus) skulls: Valuable bio-indicators of environmental changes? Ecol Indic. 2013;34:290–295. [Google Scholar]
- 4.Dietz R, Sonne C, Basu N, Braune B, O'Hara T, Letcher RJ, Scheuhammer T, Andersen M, Andreasen C, Andriashek D, et al. What are the toxicological effects of mercury in Arctic biota? Sci Total Environ. 2013;(443):775–790. doi: 10.1016/j.scitotenv.2012.11.046. [DOI] [PubMed] [Google Scholar]
- 5.Gamberg M, Braune B, Davey E, Elkin B, Hoekstra PF, Kennedy D, Macdonald C, Muir D, Nirwal A, Wayland M, et al. Spatial and temporal trends of contaminants in terrestrial biota from the Canadian Arctic. Sci Total Environ. 2005;351-352:148–164. doi: 10.1016/j.scitotenv.2004.10.032. [DOI] [PubMed] [Google Scholar]
- 6.Letcher RJ, Bustnes JO, Dietz R, Jenssen BM, Jørgensen EH, Sonne C, Verreault J, Vijayan MM, Gabrielsen GW. Exposure and effects assessment of persistent organohalogen contaminants in arctic wildlife and fish. Sci Total Environ. 2010;408(15):2995–3043. doi: 10.1016/j.scitotenv.2009.10.038. [DOI] [PubMed] [Google Scholar]
- 7.Burek KA, Gulland FMD, O'Hara TM. Effects of climate change on Arctic marine mammal health. Ecol Appl. 2008;18(2):126–134. doi: 10.1890/06-0553.1. [DOI] [PubMed] [Google Scholar]
- 8.Hueffer K, O'Hara TM, Follmann EH. Adaptation of mammalian host-pathogen interactions in a changing arctic environment. Acta Vet Scand. 2011;53(1):17. doi: 10.1186/1751-0147-53-17. [DOI] [PMC free article] [PubMed] [Google Scholar]
- 9.Altenburger R, Scholz S, Schmitt-Jansen M, Busch W, Escher BI. Mixture toxicity revisited from a toxicogenomic perspective. Environ Sci Technol. 2012;46(5):2508–2522. doi: 10.1021/es2038036. [DOI] [PubMed] [Google Scholar]
- 10.Laird BD, Goncharov AB, Chan HM. Body burden of metals and persistent organic pollutants among Inuit in the Canadian Arctic. Environ Int. 2013;59:33–40. doi: 10.1016/j.envint.2013.05.010. [DOI] [PubMed] [Google Scholar]
- 11.Fay FH, Stephenson RO. Annual, seasonal, and habitat-related variation in feeding habits of the arctic fox (Alopex lagopus) on St. Lawrence Island, Bering Sea. Can J Zool. 1989;67(8):1986–1994. [Google Scholar]
- 12.Kapel CMO. Diet of Arctic Foxes (Alopex lagopus) in Greenland. Arctic. 1999;52(3):289–293. [Google Scholar]
- 13.McGrew AK, Ballweber LR, Moses SK, Stricker Ca, Beckmen KB, Salman MD, O'Hara TM. Mercury in gray wolves (Canis lupus) in Alaska: Increased exposure through consumption of marine prey. Sci Total Environ. 2014;468-469:609–613. doi: 10.1016/j.scitotenv.2013.08.045. [DOI] [PMC free article] [PubMed] [Google Scholar]
- 14.Hoekstra PF, Braune BM, O'Hara TM, Elkin B, Solomon KR, Muir DCG. Organochlorine contaminant and stable isotope profiles in Arctic fox (Alopex lagopus) from the Alaskan and Canadian Arctic. Environ Pollut. 2003;122(3):423–433. doi: 10.1016/s0269-7491(02)00310-x. [DOI] [PubMed] [Google Scholar]
- 15.Follmann EH, Ritter DG, Hartbauer DW. Oral vaccination of captive arctic foxes with lyophilized SAG2 rabies vaccine. J Wildl Dis. 2004;40(2):328–334. doi: 10.7589/0090-3558-40.2.328. [DOI] [PubMed] [Google Scholar]
- 16.Sonne C, Wolkers H, Rigét FF, Jensen JEB, Teilmann J, Jenssen BM, Fuglei E, Ahlstrøm Ø, Dietz R, Muir DCG, et al. Mineral density and biomechanical properties of bone tissue from male Arctic foxes (Vulpes lagopus) exposed to organochlorine contaminants and emaciation. Comp Biochem Physiol, Part C: Toxicol Pharmacol. 2009;149(1):97–103. doi: 10.1016/j.cbpc.2008.07.015. [DOI] [PubMed] [Google Scholar]
- 17.Dunlap KL, Reynolds AJ, Bowers PM, Duffy LK. Hair analysis in sled dogs (Canis lupus familiaris) illustrates a linkage of mercury exposure along the Yukon River with human subsistence food systems. Sci Total Environ. 2007;385(1-3):80–85. doi: 10.1016/j.scitotenv.2007.07.002. [DOI] [PubMed] [Google Scholar]
- 18.Kirkegaard M, Sonne C, Dietz R, Letcher RJ, Jensen AL, Hansen SS, Jenssen BM, Grandjean P. Alterations in thyroid hormone status in Greenland sledge dogs exposed to whale blubber contaminated with organohalogen compounds. Ecotoxicol Environ Saf. 2011;74(1):157–163. doi: 10.1016/j.ecoenv.2010.08.040. [DOI] [PubMed] [Google Scholar]
- 19.Verreault J, Dietz R, Sonne C, Gebbink WA, Shahmiri S, Letcher RJ. Comparative fate of organohalogen contaminants in two top carnivores in Greenland: Captive sledge dogs and wild polar bears. Comp Biochem Physiol, Part C: Toxicol Pharmacol. 2008;147(3):306–315. doi: 10.1016/j.cbpc.2007.11.009. [DOI] [PubMed] [Google Scholar]
- 20.Verreault J, Letcher RJ, Sonne C, Dietz R. Dietary, age and trans-generational effects on the fate of organohalogen contaminants in captive sledge dogs in Greenland. Environ Int. 2009;35(1):56–62. doi: 10.1016/j.envint.2008.07.022. [DOI] [PubMed] [Google Scholar]
- 21.Tran HNQ, Mölders N. Investigations on meteorological conditions for elevated PM2.5 in Fairbanks, Alaska. Atmos Res. 2011;99(1):39–49. [Google Scholar]
- 22.Englert N. Fine particles and human health—a review of epidemiological studies. Toxicol Lett. 2004;149(1-3):235–242. doi: 10.1016/j.toxlet.2003.12.035. [DOI] [PubMed] [Google Scholar]
- 23.Kunsch C, Medford RM. Oxidative Stress as a Regulator of Gene Expression in the Vasculature. Circ Res. 1999;85(8):753–766. doi: 10.1161/01.res.85.8.753. [DOI] [PubMed] [Google Scholar]
- 24.Krejsa CM, Franklin CC, White CC, Ledbetter JA, Schieven GL, Kavanagh TJ. Rapid activation of glutamate cysteine ligase following oxidative stress. J Biol Chem. 2010;285(21):16116–16124. doi: 10.1074/jbc.M110.116210. [DOI] [PMC free article] [PubMed] [Google Scholar]
- 25.Ishii T, Itoh K, Takahashi S, Sato H, Yanagawa T, Katoh Y, Bannai S, Yamamoto M. Transcription Factor Nrf2 Coordinately Regulates a Group of Oxidative Stress-inducible Genes in Macrophages. J Biol Chem. 2000;275(21):16023–16029. doi: 10.1074/jbc.275.21.16023. [DOI] [PubMed] [Google Scholar]
- 26.Kensler TW, Wakabayashi N, Biswal S. Cell survival responses to environmental stresses via the Keap1-Nrf2-ARE pathway. Annu Rev Pharmacol Toxicol. 2007;47:89–116. doi: 10.1146/annurev.pharmtox.46.120604.141046. [DOI] [PubMed] [Google Scholar]
- 27.Bouwens M, van de Rest O, Dellschaft N, Bromhaar MG, de Groot LC, Geleijnse JM, Muller M, Afman LA. Fish-oil supplementation induces antiinflammatory gene expression profiles in human blood mononuclear cells. Am J Clin Nutr. 2009;90(2):415–424. doi: 10.3945/ajcn.2009.27680. [DOI] [PubMed] [Google Scholar]
- 28.Raser JM, O'Shea EK. Noise in gene expression: origins, consequences, and control. Science. 2005;309(5743):2010–2013. doi: 10.1126/science.1105891. [DOI] [PMC free article] [PubMed] [Google Scholar]
- 29.Robinson JF, Guerrette Z, Yu X, Hong S, Faustman EM. A systems-based approach to investigate dose- and time-dependent methylmercury-induced gene expression response in C57BL/6 mouse embryos undergoing neurulation. Birth Defects Res, Part B. 2010;89(3):188–200. doi: 10.1002/bdrb.20241. [DOI] [PMC free article] [PubMed] [Google Scholar]
- 30.Lieske CL, Moses SK, Castellini JM, Klejka J, Hueffer K, O'Hara TM. Toxicokinetics of mercury in blood compartments and hair of fish-fed sled dogs. Acta Vet Scand. 2011;53(1):66. doi: 10.1186/1751-0147-53-66. [DOI] [PMC free article] [PubMed] [Google Scholar]
- 31.Montrose L, Noonan CW, Cho YH, Lee J, Harley J, O'Hara T, Cahill C, Ward TJ. Evaluating the effect of ambient particulate pollution on DNA methylation in Alaskan sled dogs: Potential applications for a sentinel model of human health. Sci Total Environ. 2015;512-513:489–494. doi: 10.1016/j.scitotenv.2014.12.046. [DOI] [PMC free article] [PubMed] [Google Scholar]
- 32.Gentleman RC, Carey VJ, Bates DM, Bolstad B, Dettling M, Dudoit S, Ellis B, Gautier L, Ge Y, Gentry J, et al. Bioconductor: open software development for computational biology and bioinformatics. Genome Biol. 2004;5(10):R80. doi: 10.1186/gb-2004-5-10-r80. [DOI] [PMC free article] [PubMed] [Google Scholar]
- 33.Sloan CA, Brown DW, Pearce RW, Boyer RH, Bolton JL, Burrows DG, Herman DP, Krahn MM. Techniques in Aquatic Toxicology. Vol. 2 CRC Press; Boca Raton, FL: 2005. Determining aromatic hydrocarbons and chlorinated hydrocarbons in sediments and tissues using accelerated solvent extraction and gas chromatography/mass spectrometry. [Google Scholar]
- 34.Knott KK, Schenk P, Beyerlein S, Boyd D, Ylitalo GM, O'Hara TM. Blood-based biomarkers of selenium and thyroid status indicate possible adverse biological effects of mercury and polychlorinated biphenyls in Southern Beaufort Sea polar bears. Environ Res. 2011;111(8):1124–1136. doi: 10.1016/j.envres.2011.08.009. [DOI] [PMC free article] [PubMed] [Google Scholar]
- 35.Wickham H. ggplot2: elegant graphics for data analysis. Springer New York; New York: 2009. [Google Scholar]
- 36.R Core Team. R: A language and environment for statistical computing. R Foundation for Statistical Computing; Vienna, Austria: 2014. [Google Scholar]
- 37.Ritchie ME, Phipson B, Wu D, Hu Y, Law CW, Shi W, Smyth GK. limma powers differential expression analyses for RNA-sequencing and microarray studies. Nucleic Acids Res. 2015;43(7):e47–e47. doi: 10.1093/nar/gkv007. [DOI] [PMC free article] [PubMed] [Google Scholar]
- 38.Storey JD. qvalue: Q-value Estimation for False Discovery Rate Control. Bioconductor; Seattle, WA: 2015. [Google Scholar]
- 39.Smith CA. anaffy: Annotation tools for Affymetrix biological metadata. Bioconductor; Seattle, WA: 2010. [Google Scholar]
- 40.Bolstad BM, Collin F, Brettschneider J, Simpson K, Cope L, Irizarry RA, Speed TP. Quality Assessment of Affymetrix GeneChip Data. In: Gentleman R, Carey VJ, Huber W, Irizarry RA, Dudoit S, editors. Bioinformatics and Computational Biology Solutions Using R and Bioconductor. Statistics for Biology and Health; Springer; New York: 2005. pp. 33–47. [Google Scholar]
- 41.Whitney AR, Diehn M, Popper SJ, Alizadeh Aa, Boldrick JC, Relman Da, Brown PO. Individuality and variation in gene expression patterns in human blood. Proc Natl Acad Sci U S A. 2003;100(4):1896–1901. doi: 10.1073/pnas.252784499. [DOI] [PMC free article] [PubMed] [Google Scholar]
- 42.Radonjic M, Cappaert NLM, de Vries EFJ, de Esch CEF, Kuper FC, van Waarde A, Dierckx RAJO, Wadman WJ, Wolterbeek APM, Stierum RH, et al. Delay and Impairment in Brain Development and Function in Rat Offspring After Maternal Exposure to Methylmercury. Toxicol Sci. 2013;133(1):112–124. doi: 10.1093/toxsci/kft024. [DOI] [PubMed] [Google Scholar]
- 43.Gribble MO, Karimi R, Feingold BJ, Nyland JF, O'Hara TM, Gladyshev MI, Chen CY. Mercury, selenium and fish oils in marine food webs and implications for human health. J Mar Biol Assoc U K. 2015:1–17. doi: 10.1017/S0025315415001356. [DOI] [PMC free article] [PubMed] [Google Scholar]
- 44.Nicolson TJ, Glaves PD, Roberts RR. The Post-Transcriptional Regulator EIF2S3 and Gender Differences in the Dog:Implications for Drug Development, Drug Efficacy and Safety Profiles. J Drug Metab Toxicol. 2010;01(01):1–4. [Google Scholar]
- 45.Gauger KJ, Giera S, Sharlin DS, Bansal R, Iannacone E, Zoeller RT. Polychlorinated biphenyls 105 and 118 form thyroid hormone receptor agonists after cytochrome P4501A1 activation in rat pituitary GH3 cells. Environ Health Perspect. 2007;115(11):1623–1630. doi: 10.1289/ehp.10328. [DOI] [PMC free article] [PubMed] [Google Scholar]
- 46.Miyazaki W, Iwasaki T, Takeshita A, Kuroda Y, Koibuchi N. Polychlorinated biphenyls suppress thyroid hormone receptor-mediated transcription through a novel mechanism. J Biol Chem. 2004;279(18):18195–18202. doi: 10.1074/jbc.M310531200. [DOI] [PubMed] [Google Scholar]
- 47.Weldy CS, Wilkerson HW, Larson TV, Stewart Ja, Kavanagh TJ. DIESEL particulate exposed macrophages alter endothelial cell expression of eNOS, iNOS, MCP1, and glutathione synthesis genes. Toxicol In Vitro. 2011;25(8):2064–2073. doi: 10.1016/j.tiv.2011.08.008. [DOI] [PMC free article] [PubMed] [Google Scholar]
- 48.Sørensen M, Daneshvar B, Hansen M, Dragsted LO, Hertel O, Knudsen L, Loft S. Personal PM2.5 Exposure and Markers of Oxidative Stress in Blood. Environ Health Perspect. 2002;111(2):161–165. doi: 10.1289/ehp.111-1241344. [DOI] [PMC free article] [PubMed] [Google Scholar]
- 49.Espinoza SE, Guo H, Fedarko N, DeZern A, Fried LP, Xue QL, Leng S, Beamer B, Walston JD. Glutathione peroxidase enzyme activity in aging. J Gerontol Ser A. 2008;63(5):505–509. doi: 10.1093/gerona/63.5.505. [DOI] [PMC free article] [PubMed] [Google Scholar]
- 50.Ozata M, Mergen M, Oktenli C, Aydin A, Sanisoglu SY, Bolu E, Yilmaz MI, Sayal A, Isimer A, Ozdemir IC. Increased oxidative stress and hypozincemia in male obesity. Clin Biochem. 2002;35(8):627–631. doi: 10.1016/s0009-9120(02)00363-6. [DOI] [PubMed] [Google Scholar]
- 51.Balogh LM, Le Trong I, Kripps Ka, Shireman LM, Stenkamp RE, Zhang W, Mannervik B, Atkins WM. Substrate specificity combined with stereopromiscuity in glutathione transferase A4–4-dependent metabolism of 4-hydroxynonenal. Biochemistry. 2010;49(7):1541–1548. doi: 10.1021/bi902038u. [DOI] [PMC free article] [PubMed] [Google Scholar]
- 52.Nagai F, Kato E, Tamura H. Oxidative stress induces GSTP1 and CYP3A4 expression in the human erythroleukemia cell line, K562. Biol Pharm Bull. 2004;27(4):492–495. doi: 10.1248/bpb.27.492. [DOI] [PubMed] [Google Scholar]
- 53.Palmer C, Diehn M, Alizadeh AA, Brown PO. Cell-type specific gene expression profiles of leukocytes in human peripheral blood. BMC Genomics. 2006;7:115. doi: 10.1186/1471-2164-7-115. [DOI] [PMC free article] [PubMed] [Google Scholar]
Associated Data
This section collects any data citations, data availability statements, or supplementary materials included in this article.