

Abstract
Mutant p53 proteins are present in more than half of human cancers. Yes‐associated protein (YAP) is a key transcriptional regulator controlling organ growth, tissue homeostasis, and cancer. Here, we report that these two determinants of human malignancy share common transcriptional signatures. YAP physically interacts with mutant p53 proteins in breast cancer cells and potentiates their pro‐proliferative transcriptional activity. We found YAP as well as mutant p53 and the transcription factor NF‐Y onto the regulatory regions of cyclin A, cyclin B, and CDK1 genes. Either mutant p53 or YAP depletion down‐regulates cyclin A, cyclin B, and CDK1 gene expression and markedly slows the growth of diverse breast cancer cell lines. Pharmacologically induced cytoplasmic re‐localization of YAP reduces the expression levels of cyclin A, cyclin B, and CDK1 genes both in vitro and in vivo. Interestingly, primary breast cancers carrying p53 mutations and displaying high YAP activity exhibit higher expression levels of cyclin A, cyclin B, and CDK1 genes when compared to wt‐p53 tumors.
Keywords: gene expression, metabolism, mutant p53 and YAP, proliferation, statin
Subject Categories: Cancer, Transcription
Introduction
The p53 protein is functionally inactivated in most of the human malignancies due to both alterations in its regulatory pathways and mutations that directly affect the TP53 gene 1, 2. Unlike the majority of tumor suppressor genes that are commonly affected by deletions or frame‐shift mutations, TP53 is frequently affected by alterations that result in the production of full‐length proteins accumulating in cancer cells and showing single amino acid changes, usually in the DNA binding domain. Understanding the biological meaning of this phenomenon is still an open and challenging field of research. It is clear that many mutated forms of p53 can exert a dominant negative effect over the wild‐type protein; however, it is also well established that several cancers take a selective advantage from retaining only the mutant form of the protein that displays new neomorphic oncogenic functions (gain of function, GOF) 3. In vitro tumor‐derived mutant p53 proteins have been implicated in increased cell proliferation, increased chemoresistance, disruption of tissue architecture, promotion of migration, invasion and metastasis, and several other pro‐oncogenic properties 4, 5, 6, 7, 8. In vivo, mutant p53 “knock‐in” mice display an altered tumor spectrum as well as more metastatic tumors when compared to p53 null mice 9, 10, 11. Moreover, certain mutations in the TP53 gene have been associated with poor clinical outcome in several human tumors 2, 12, 13. In line with this, in patients affected by the Li‐Fraumeni (LF) syndrome, germline missense p53 mutations have been associated with earlier age of tumor onset when compared to germline TP53 loss 14. Gaining novel insights into the mechanisms underlying mutant p53 gain of function may help the design of targeted therapeutic strategies based on the pharmacological inhibition of these mutant p53 variants 15.
Critical for its function is the ability of mutant p53 to be engaged in aberrant molecular interactions with nuclear partners that lead to dramatic alterations in gene expression. Aberrant transcriptional regulation is a major event in human cancers, and this may occur through unscheduled activity of specific transcription factors, and/or aberrant recruitment of transcriptional co‐activators, thus resulting in either uncontrolled gene activation or repression. Interestingly, mutant p53 has been shown to interact with several transcription factors such as NF‐Y, SREBPs, Sp1, vitamin D receptor, and Ets‐1, controlling their transcriptional activation 4, 16, 17, 18, 19. In this context, mutant p53 operates as a co‐factor able to sustain the expression of several pro‐oncogenic genes 6. It is conceivable that mutant p53 proteins can be engaged with additional, yet unknown, transcription factors through which they regulate the expression of specific gene signatures underpinning novel gain‐of‐function activities. In search for co‐factors sharing mutant p53‐induced transcriptomic alterations in breast cancer cells, we identified the transcriptional co‐factor YAP1 (Yes‐associated protein) as a new partner of mutant p53 proteins in diverse types of tumors. YAP1 is an oncogene, amplified or hyperactivated in a number of human solid tumors. It is considered the main effector of the Hippo tumor suppressor pathway 20, 21, 22, 23. Notably, YAP and mutant p53 proteins physically interact and can be concomitantly found on the consensus sequences recognized and bound to the heterotrimeric transcription factor NF‐Y. This factor was previously shown to associate with mutant p53 and aberrantly regulate the transcriptional activation of cell cycle‐regulated genes such as cyclin A, cyclin B, CDC25C, and CDK1 4. Here, we document that the effects of the cross‐talk between NF‐YB and mutant p53 are maximized by YAP transcriptional co‐activation, with profound impact on cell proliferation. Our results unveil a new pro‐oncogenic mechanism of action of YAP in cancers harboring mutations in the TP53 gene.
Results
Mutant p53 and YAP share a common transcriptional program
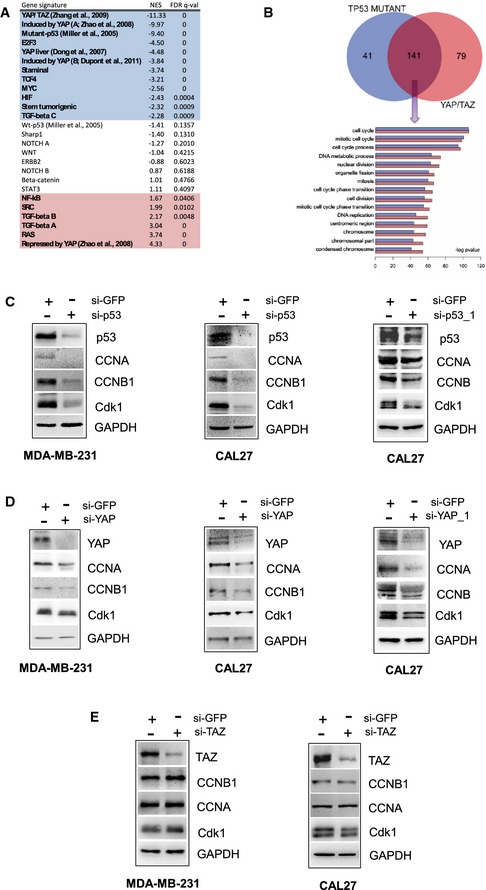
To gain novel insights into the transcriptional activity of gain‐of‐function mutant p53 proteins, we investigated the relevance of known signaling pathway to mutant p53 proteins functions. To this aim, we compared the molecular profiles of the breast metastatic cancer cell line MDA‐MB‐231 silenced for p53 with the profiles of the same cells transfected with control siRNA 24. Then, we performed a gene set enrichment analysis (GSEA), searching for statistical associations between the genes regulated by mutant p53 proteins and those contained in a collection of gene signatures denoting activation of transcription factors and signaling pathways derived from mammary cell lines and tissues (Dataset EV1, see Materials and Methods for details). Several signatures overlapped with genes regulated by mutant p53. In particular, the genes induced by YAP and YAP/TAZ were significantly enriched among the genes inhibited by mutant p53 silencing, whereas the genes repressed by YAP were enriched among the genes activated by mutant p53 silencing (Fig 1A and Dataset EV2), thereby suggesting a possible link between mutant p53 and YAP in transcriptional regulation.
Figure 1. Mutant p53 and YAP share a common transcriptional program.
-
AOver‐representation analysis was performed with Gene Signatures highlighting activation of specific pathways using Gene Set Enrichment Analysis (GSEA) on microarray data obtained from control and mutant p53‐silenced MDA‐MB‐231 mammary cells. A negative normalized enrichment score (NES; highlighted in blue) indicates signatures that are more active in control cells, that is, that have been repressed upon the silencing of mutant p53 proteins; a positive NES (highlighted in red) indicates signatures that have been activated by mutant p53 silencing (i.e., signature normally not active in MDA‐MB‐231). The false discovery rate (FDR) is the estimated probability that a gene set with a given NES represents a false positive; we considered signatures to be significantly enriched at FDR < 0.05. Gene expression data has been obtained from n = 3 biological replicates for each condition. See Dataset EV2 for a GSEA analysis including also Biocarta gene sets.
-
BUpper panel: Venn diagram showing the overlap of functional analyses. Starting from the TP53 mutant genes list or YAP/TAZ genes list, the biological process (BP) and molecular functions (MF) were obtained using the ClusterProfiler tool. An overlap of the functional annotations was performed to obtain the list of the common ones. Lower panel: common functional annotations. For the common functional annotations, we represent the enriched score (that is the minus log of the P‐value) for both gene lists. In particular, color horizontal bars represent the functional themes that are overrepresented in TP53 mutant genes (blue bars) or YAP/TAZ genes list (red bars).
-
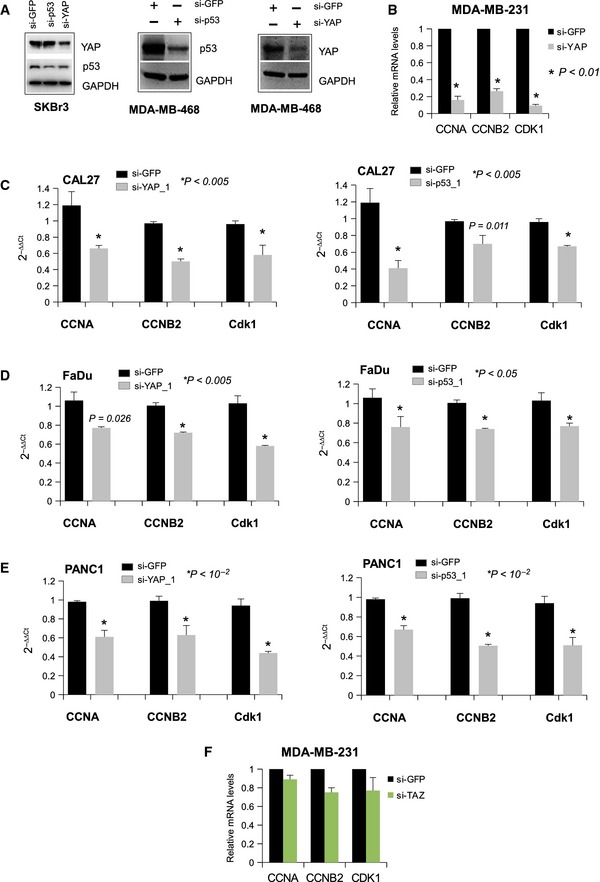
C–EWestern blot analysis of CCNA, CCNB, CDK1, and GAPDH (loading control) protein expression in lysates from control (si‐GFP) and p53‐depleted (si‐p53; si‐p53_1) (C), YAP‐depleted (si‐YAP; si‐YAP_1) (D), and TAZ‐depleted (si‐TAZ) (E) MDA‐MB‐231 and CAL27 cell lines. Representative images are shown.
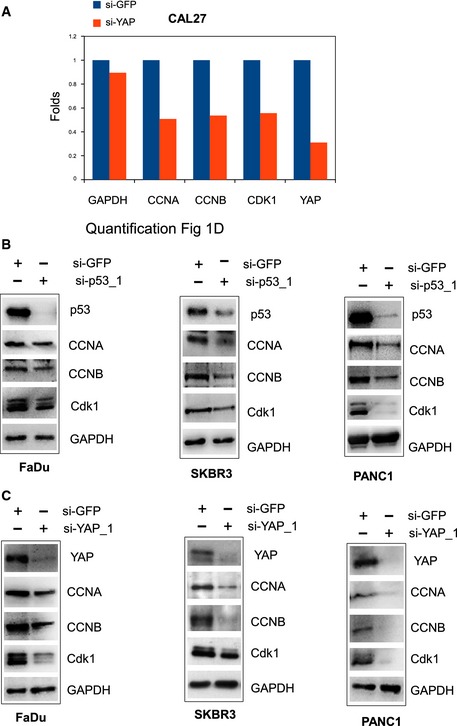
To investigate the possible biological link between mutant p53 and YAP, we first derived a gene expression signature experimentally associated with mutant p53 proteins in MDA‐MB‐231 cells (mutant p53 signature) by selecting the genes that were down‐regulated by mutant p53 silencing in MDA‐MB‐231 microarrays (see Materials and Methods and Dataset EV3) 24. We then compared the common Gene Ontology functional annotations of the mutant p53 and YAP/TAZ signatures 25. As shown by the Venn diagram in Fig 1B, a significant (P < 10−10) overlap of functional themes characterizes the two signatures and includes the categories of cell cycle process, DNA metabolic process, nuclear division and microtubule cytoskeleton organization. This suggests that mutant p53 and YAP share a common transcriptional program devoted to the control of cell cycle progression. Mutant p53 proteins have been shown to aberrantly regulate the expression of cell cycle‐regulated genes such as cyclin A, cyclin B, CDC25C, and CDK1 (Fig 1C; “cyclin signature”) 4. Interestingly, we found that siRNA‐mediated knock‐down of YAP, in the breast cancer cell lines MDA‐MB‐231 (bearing mutp53R280K) and SKBr3 (bearing mutp53R175), the head and neck cancer cell lines CAL27 (bearing mutp53A193T), and FADU (bearing mutp53R248L) and the pancreatic cancer cell line PANC1 (bearing mutp53R273H), led to a decrease in cyclin A, cyclin B, and CDK1 protein levels (Figs 1D and EV1A–C). Of note, silencing of TAZ (the YAP homologous in mammals) did not result in any modulation of cyclin A, cyclin B, and CDK1 protein expression (Fig 1E). These data suggest that YAP, similar to mutant p53, controls the expression of proteins involved in cell cycle progression.
Figure EV1. Mutant p53 and YAP affect the protein expression of cell cycle‐related genes.
-
AQuantification by Alliance Uvitec software (Eppendorf) of the Western blotting shown in the Fig 1D (CAL27 cells).
-
B, CWestern blot analysis of CCNA, CCNB, CDK1, and GAPDH (loading control) protein expression in lysates from control (si‐GFP) and p53‐depleted (si‐p53_1) (B) and YAP‐depleted (si‐YAP_1) (C) FaDu, SKBr3, and Panc1 cell lines. Representative images are shown.
Strikingly, the survey of the METABRIC cohort revealed that patients with breast cancer carrying missense p53 mutations and expressing a highly active YAP signature exhibited increased expression of cyclin A, cyclin B, CDC25C, and CDK1 genes (“cyclin signature”; Fig 2A and B). This was evident when comparing the “cyclin signature” expression level of mutant p53/low YAP activity patients with that of wt‐p53 patients with high or low YAP activity (Fig 2A and B). In this context, patients carrying p53 mutations had a shorter survival than those with p53 protein (Fig 2C) 26. Interestingly, however, mutant p53 breast cancer patients with a lower level of the YAP/TAZ signature exhibited a better survival than those with a higher YAP/TAZ activity (Fig 2C). Wt‐p53 breast cancer patients exhibited a better survival either with high or with low expression of YAP signature when compared to patients carrying p53 mutations (Fig 2C). Altogether these findings strongly indicate that mutant p53 and YAP share common transcriptional programs with endowed oncogenic potential.
Figure 2. Cycline signature analysis in METABRIC dataset.
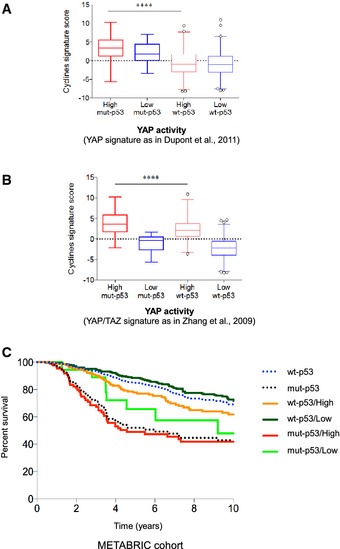
- Primary human breast cancers of the METABRIC dataset were stratified according to high or low YAP activity signature 47 and by TP53 mutational status, and then, the levels of the cycline signature score were determined in the four groups. Cyclin activity is significantly higher in mut‐p53 tumors with high levels of the YAP signature, as visualized by the box plot. Signature scores have been obtained, summarizing the standardized expression levels of signature genes into a combined score with zero mean 7. The values shown in graphs are thus adimensional. The bottom and top of the box are the first and third quartiles, and the band inside the box is the median; whiskers represent 1st and 99th percentiles; values that are lower and greater are shown as circles (****P < 0.0001, two‐tailed Student's t‐test, n = 701).
- Same as in (A) using the YAP/TAZ activity signature of Zhang et al 25 (P < 0.0001, n = 701).
- Kaplan–Meier analysis representing the probability of disease‐specific survival in mutant and wild‐type p53 breast cancer patients from the METABRIC dataset stratified according to high or low YAP/TAZ signature score. The log‐rank test P‐value reflects the significance of the association between high levels of the YAP/TAZ signature score and shorter survival in mutant p53 as compared to wild‐type p53 patients (P < 0.0001, n = 251).
YAP modulates the expression of the cell cycle genes regulated by NF‐Y and mutant p53
Cell cycle regulatory genes share common structural features: a low frequency of TATA boxes, and the presence of CCAAT boxes, recognized by the transcription factor NF‐Y 27. NF‐Y is a heterotrimeric transcription factor with a high binding affinity for the CCAAT consensus and consisting of three subunits, NF‐YA, NF‐YB, and NF‐YC, all required for binding the CCAAT motif that is present in 30% of all eukaryotic promoters 28. It has been demonstrated that human p53 mutants physically interact with NF‐Y and that this interaction specifically occurs on the CCAAT boxes of several cell cycle gene promoters. The biological outcome of this interaction is an increased transcription of cell cycle‐regulated genes, and indeed, it has been clearly demonstrated that mutant p53 proteins are responsible for the high expression of cell cycle genes such as cyclin A, cyclin B, CDC25C, and CDK1 in tumor cells 4, 28, 29, 30. Based on this, we decided to evaluate the involvement of YAP in mutant p53‐dependent regulation of NF‐Y transactivation activity by using a transcriptional reporter: the murine Ccnb2 promoter (pCCAAT‐B2LUC), which contains three CCAAT boxes. In SKBr3 and MDA‐MB 468 (bearing mutp53R273H) mutant p53 breast cancer cell lines, we found that down‐regulation of YAP by siRNA transfection caused a significant loss of the NF‐Y transactivation capacity over the cyclin B2 promoter (Figs 3A and EV2A). The same results have been obtained upon mutant p53 depletion (Figs 3A and EV2A). As a control, down‐regulation of either YAP or mutant p53 did not produce any modulation of luciferase activity when the Ccnb2 promoter carries three mutated CCAAT boxes (pmutCCAAT‐B2LUC) that are not bound by NF‐Y (Fig 3A).
Figure 3. YAP modulates the expression of the cell cycle genes regulated by NF‐Y and induced by mutant p53.
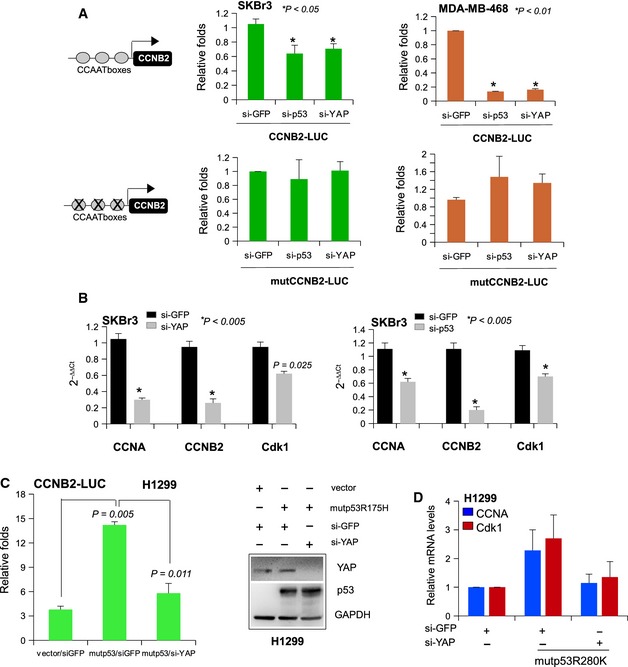
- SKBr3 and MDA‐MB‐468 cells knocked‐down as indicated were transiently transfected with pCCAAT‐B2LUC (100 ng) or pmutCCAAT‐B2LUC (100 ng) luciferase reporter vectors.
- RT–qPCR of CCNA, CCNB2, and CDK1 mRNA levels in SKBr3 cells upon transduction with si‐GFP and si‐YAP (left graph) or si‐p53 (right graph).
- H1299 cells transfected with the indicated siRNAs were transiently transfected with pCCAAT‐B2LUC (100 ng) luciferase reporter vector together with empty pcDNA3 or mutant p53R175H. Representative Western blotting to control the transfections presented in the right panel.
- RT–qPCR of CCNA and CDK1 mRNA levels in H1299 cells upon transfection with si‐GFP or si‐YAP oligos and empty pCDNA3 or mutp53R280H expression vectors as indicated in the figure. Values represent mean ± s.d. from three biological replicates.
Figure EV2. Mutant p53 and YAP affect the mRNA expression of cell cycle‐related genes.
-
AWestern blot analysis of YAP, p53, and GAPDH (loading control) protein expression in lysates from control (si‐GFP), p53‐depleted (si‐p53), and YAP‐depleted (si‐YAP) SKBr3 and MDA‐MB‐468 cell lines. Representative images are shown. A part of these samples are used for the LUC assay described in Fig 3A.
-
BCCNA, CCNB2, and CDK1 transcripts were analyzed by RT–qPCR in cDNA derived from MDA‐MB‐231 cells transfected with siGFP and siYAP oligonucleotides. Bars represent mean ± s.d. from three biological replicates. P‐values were calculated with two‐tailed t‐test. Significant P‐values are indicated in the figures.
-
C–ECCNA, CCNB2, and CDK1 transcripts were analyzed by RT–qPCR in cDNA derived from CAL27 (D), FaDu (E), and Panc1 (F) cells transfected with si‐GFP and si‐YAP_1 or si‐p53_1 oligonucleotides. Bars represent mean ± s.d. from three biological replicates. P‐values were calculated with two‐tailed t‐test.
-
FCCNA, CCNB2, and CDK1 transcripts were analyzed by RT–qPCR in cDNA derived from MDA‐MB‐231 cells transfected with siGFP and siTAZ oligonucleotides. Bars represent mean ± s.d. from three biological replicates. P‐values were calculated with two‐tailed t‐test.
To verify whether YAP modulates the expression of NF‐Y endogenous target genes in cells harboring mutant p53, we assessed the mRNA levels of CCNA, CCNB, and CDK1 genes after YAP down‐regulation in diverse cancer cell lines such as SKBr3, MDA‐MB‐231, CAL27, FADU, and PANC1 (Figs 3B and EV2B–E). As shown in Figs 3B and EV2B–E, expression of these cell cycle genes was strongly reduced in cells depleted of YAP but not upon silencing of TAZ (Fig EV2F).
To test if the positive role of YAP on NF‐Y transcriptional activity was dependent on mutant p53, we transfected the Ccnb2 promoter (pCCAAT‐B2LUC) in the p53‐null human lung cancer cell line H1299. As previously described, mutp53R175H overexpression was able to transactivate the Ccnb2 promoter (Fig 3C) 4, 29. Under these conditions, concomitant YAP down‐regulation almost completely prevented the mutant p53‐induced increase in Ccnb2 promoter transactivation (Fig 3C), meaning that, downstream of mutant p53, YAP is functionally required to foster NF‐Y transactivation activity in tumor cells. According to these findings, YAP knock‐down in H1299 cells completely abrogated the up‐regulation of CCNA and CDK1 transcripts induced by the overexpression of another mutant p53 form, R280K (Fig 3D). This evidence suggests that YAP crucially contributes to the aberrant NF‐Y transcriptional activation driven by mutant p53.
YAP interacts with mutant p53 to regulate NF‐Y target genes
Given that mutant p53 requires a physical interaction with NF‐Y on CCAAT boxes to promote cell cycle progression 4, we hypothesized that YAP could be engaged in this molecular complex acting as a docking factor for the efficient localization of NF‐Y and mutp53 on the promoters of cell cycle genes.
Firstly, we verified the existence of a YAP/mutp53 protein complex. Co‐immunoprecipitation experiments in the H1299 cell line showed that, upon ectopic expression, different mutant p53 variants were able to interact with endogenous YAP protein (Fig 4A and B; Appendix Fig S1A). Confirming the existence of a YAP/mutp53 protein complex, endogenous YAP has been immunoprecipitated from whole protein extracts of human cancer cell lines from different tissues and bearing different mutations in the TP53 gene (Fig 4C; Appendix Fig S1C and D). In all tested cell lines, mutp53 was able to interact with YAP (Fig 4C; Appendix Fig S1C and D). Reciprocal co‐immunoprecipitations performed in different cancer cell lines further confirmed the presence of YAP/mutp53 protein complex (Appendix Fig S1E). Since p53 protein (53 kDa) and the antibody heavy chain are comparable in size, the migration of the antigen can be affected by the mass of the heavy chain, particularly when IgG are not crosslinked to the beads, leading to apparent increase in p53 size. To further confirm the specificity of the protein complex mutantp53 band, we performed co‐precipitation assay in different cell lines depleted for mutant p53 expression (Appendix Fig S1D). Conversely, as previously reported 31, we were not able to detect any interaction between YAP and wt p53, either in endogenous conditions or upon over‐expression of wild‐type p53 (in H1299 cell line) (Fig 4A and D; Appendix Fig S1B). The deletion of a region (between residues 338 and 355) which resides within the oligomerization domain of mutant p53 protein reduced the binding to YAP (Fig 4E). This might suggest that either conformational alteration or posttranslational modifications within this region could impact on the formation of the mutp53/YAP protein complex.
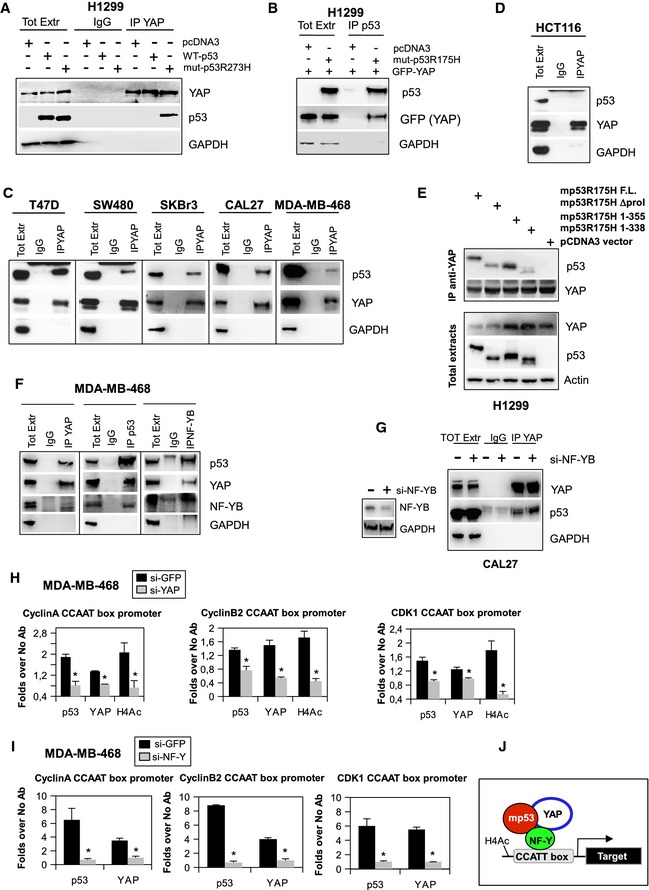
Figure 4. YAP interacts with mutant p53 to regulate NF‐Y target genes.
-
A, BCo‐immunoprecipitation and Western blot analysis from H1299 cell lysates showing endogenous YAP (A) and over‐expressed GFP‐YAP (B) bound to mutp53R273H (A) or to mutp53R175H (B). In (A), YAP protein was immunoprecipitated with a rabbit polyclonal antibody and rabbit IgG was used as a negative control of IP. In (B), p53 protein was immunoprecipitated with a sheep polyclonal antibody and the total lysate from H1299 cells transfected with empty pCDNA3 vector was used as a negative control of IP.
-
C, DImmunoprecipitations of YAP protein and Western blot analysis of p53 binding performed with lysates from cancer cell lines expressing different mutant p53 proteins (described in Materials and Methods) (C) and from HCT116 cells expressing wild‐type p53 protein (D). YAP protein was immunoprecipitated with a rabbit polyclonal antibody, and the same amount of rabbit IgG was used as a negative control of IP.
-
ECellular extracts from H1299 cells transiently transfected with 2 μg of each indicated plasmid was immunoprecipitated with rabbit polyclonal YAP antibody. Cell lysates derived from cells transfected with the empty vector were used as a negative control of IP.
-
FCellular extracts from MDA‐MB‐468 were immunoprecipitated with rabbit polyclonal YAP, sheep polyclonal p53, and rabbit polyclonal NF‐YB antibodies. Rabbit (for YAP and NF‐YB IPs) and sheep (for p53 IP) IgGs were used as negative controls of IPs.
-
GCell lysates from CAL27 cells transfected with si‐GFP and si‐NF‐YB oligonucleotides were immunoprecipitated with rabbit polyclonal YAP. As specificity control, immunoprecipitations were performed with rabbit IgG.
-
H, IChIP analysis of mutant p53, YAP, and H4 acetylated histone‐bound chromatin from MDA‐MB‐468 cells on transduction with siRNAs oligos targeting endogenous YAP (siYAP) (H), NF‐Y (siNF‐YB) (I), or siGFP as a negative control (H and I). The experiment was performed in biological triplicates. The CCNA, CCNB2, and CDK1 promoter occupancy were analyzed by RT–qPCR. Normalization was performed to the amount of input chromatin. The ChIP results were further normalized on the RT–qPCR of a region that was negative for the recruitment of mutant p53 (Appendix Table S2). *P‐values were calculated with two‐tailed Student's t‐test. Statistically significant results were referred with P‐value < 0.05.
-
JSchematic representation of the trimeric transcriptional complex mutant p53/YAP/NF‐Y bound to the specific CCAAT‐box sequences onto the target promoters.
Next, we investigated whether NF‐Y was part of the mutp53/YAP complex. Since the subunit NF‐YB is critical for the transcriptional activity of the trimeric transcription factor, we focused on it as representative of the NF‐Y complex 27. Of note, as shown in Fig 4F, YAP was able to interact with both mutant p53 and NF‐YB in MDA‐MB‐468 and CAL27 cells, suggesting the existence of an endogenous protein complex (Fig 4F and Appendix Fig S1F). Interestingly, the floating protein complex between YAP and mutant p53 was also present in CAL27 cell depleted for NF‐Y expression, suggesting that NF‐Y is not necessary for the formation of mutp53/YAP protein complex (Fig 4G).
To investigate whether this interaction was occurring on target gene promoters, we performed chromatin immunoprecipitation experiments (ChIP) in MDA‐MB‐468 cells, in which these genes are actively transcribed in dependence of mutant p53 and YAP. Indeed, we found that mutant p53 and YAP were bound to CCNA, CCNB1, and CDK1 promoter sequences containing CCAAT boxes and that their recruitment was correlated with histone 4 acetylation, a marker of transcriptionally active chromatin (Fig 4H).
Moreover, to investigate whether YAP was required for mutant p53 binding to CCAAT boxes on the promoters of cell cycle genes, we carried out a ChIP of mutant p53 upon silencing of endogenous YAP or TAZ as a control, as TAZ did not have a role in the modulation of cyclin A, cyclin B1, and CDK1 protein expression (Fig 1D). Interestingly, when YAP expression was knocked‐down by RNA interference (Appendix Fig S2A), we observed a significant decrease in mutant p53 occupancy of the CCAAT promoter sequences (Fig 4H), suggesting that YAP favors the binding of mutant p53 to NF‐Y‐recognized DNA sequences. Conversely, in the absence of TAZ, mutant p53 and YAP continue to bind the CCAAT boxes onto the CCNA, CCNB1, and CDK1 promoters (Appendix Fig S2B), confirming that TAZ is not required for the transcription of cell cycle‐related genes.
We further investigated whether YAP and mutp53 recruitment on target gene promoters was dependent on NF‐Y. Indeed, down‐regulation of NF‐Y by siRNA transfection (Appendix Fig S2C) caused a dramatic reduction in both mutant p53 and YAP occupancy of CAAT boxes (Fig 4I). Overall, these results confirmed that YAP is required for the efficient binding of mutant p53 to the promoter of cell cycle genes (Fig 4J).
YAP promotes cell proliferation in cancer cells harboring mutant p53
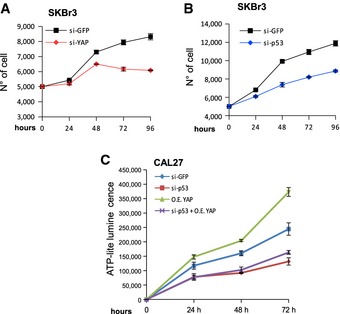
To explore the potential oncogenic functions of YAP in tumor cell lines expressing p53 mutations, we examined the effect of YAP silencing on cell proliferation. Three different breast cancer cell lines expressing mutant p53 were depleted of YAP by siRNAs transfection and after 18 h were plated for measuring cell proliferation. As expected, the proliferation rate of all the cell lines silenced for YAP was significantly lower than that of the siGFP control cells (Fig 5A; Appendix Fig S3A–C) and similar to that observed in tumor cells where mutp53 expression was knocked‐down (Fig 5B). Conversely, the absence of TAZ did not affect the proliferation rate of MDA‐MB‐231 and CAL27 cell lines, confirming that TAZ is not required for the proliferation of cancer cells expressing mutant p53 proteins (Appendix Fig S3D and E).
Figure 5. YAP promotes cell proliferation in cancer cells harboring mutant p53.
-
A, BProliferation curves of SKBr3 cell line knocked‐down for YAP (A) or p53 (B). si‐GFP oligos are used as negative control.
-
CViability of CAL27 cell line transfected with si‐GFP or si‐p53 oligos and empty vector or GFP‐YAP construct, as indicated in the legend to the graph.
To formally demonstrate that YAP acts in concert with mutant p53 to induce cell proliferation, we overexpressed YAP in CAL27 cell line (Appendix Fig S3F). As shown in Fig 5C, the overexpression of YAP resulted in an increase in cellular growth during time. Strikingly, down‐regulation of mutant p53 levels significantly impaired the proliferation rate induced by YAP over‐expression (Fig 5C), demonstrating that YAP and mutp53 proteins are required along the same functional axis to sustain proliferation in tumor cells.
Pharmacological inhibition of YAP impairs mutant p53‐driven proliferation
We and others have recently demonstrated that YAP nuclear localization is strongly regulated by the metabolic mevalonate pathway and that mevalonate pathway inhibitors potently inhibit YAP nuclear activities by forcing its cytoplasmic retention 32, 33. In particular, we have shown that YAP transcriptional activity was impaired by statins and zoledronic acid (ZA) treatment in vitro, in a wide panel of cancer cells and in vivo in xenograft assay 32, 33.
To test the in vivo effect of YAP inhibition on mutant p53 transcriptional activity, we monitored the expression of cell cycle genes in mice harboring orthotopic tumors arising from MDA‐MB‐231 cells, upon inhibition of the mevalonate pathway by injection of zoledronic acid (ZA) (Fig 6A). Notably, the ZA‐treated mice had a decrease of CCNA and CCNB mRNA expression in their tumors with respect to the untreated mice (Fig 6A). Consistently, ZA‐treated mice also showed a significant reduction in tumor growth 32.
Figure 6. Pharmacological inhibition of YAP impairs mutant p53‐driven proliferation.
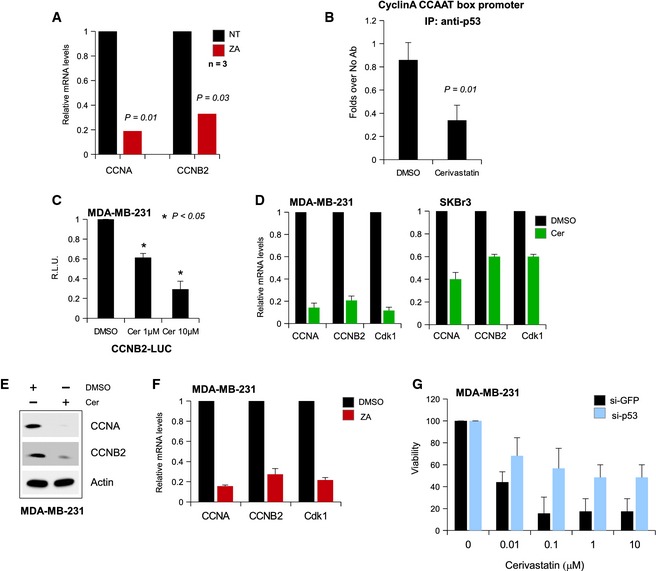
- CCNA and CCNB2 transcripts were analyzed by RT–qPCR in cDNA derived from tumors of control (saline) or zoledronic acid (ZA)‐treated mice 31. N = 3 mice per group. P‐values were calculated with two‐tailed t‐test.
- ChIP analysis of mutant p53‐bound chromatin from MDA‐MB‐231 cells treated or not with 1 μM cerivastatin (Cer) for 24 h. The CCNB2 promoter occupancy was analyzed by RT–qPCR. Normalization was performed to the amount of input chromatin. The experiment was performed in biological triplicates. P‐values were calculated with two‐tailed t‐test.
- MDA‐MB‐231 cells treated with the indicated concentrations of Cer for 24 h were transfected with pCCAAT‐B2LUC (100 ng) luciferase reporter vector. Bars represent mean ± s.d. from three biological replicates. P‐values were calculated with two‐tailed t‐test.
- CCNA, CCNB2, and CDK1 transcripts were analyzed by RT–qPCR in cDNA derived from MDA‐MB‐231 (left panel) and SKBr3 (right panel) cell lines treated or not with 1 μM Cer for 48 h. Bars represent mean ± s.d. from three biological replicates. P‐values were calculated with two‐tailed t‐test. The green columns (Cer) have a P‐value < 0.01 with respect to their DMSO negative controls.
- Western blot analysis of CCNA, CCNB, and actin (loading control) expression in lysates from MDA‐MB‐231 cells treated or not with 1 μM Cer.
- CCNA, CCNB2, and CDK1 transcripts were analyzed by RT–qPCR in cDNA derived from MDA‐MB‐231cell line treated or not with 30 μM ZA for 48 h. Bars represent mean ± s.d. from three biological replicates. P‐values were calculated with two‐tailed t‐test. The red columns (ZA) have a P‐value < 0.01 with respect to their DMSO negative controls.
- Viability assay of siGFP‐ and sip53‐treated MDA‐MB‐231 cells after treatment with increasing amounts of cerivastatin (0, 0.01, 0.1, 1, and 10 μM) for 48 h. Data are normalized to the respective untreated samples. Bars represent mean ± s.d. from three biological replicates.
Since YAP nuclear localization is required for its interaction with mutant p53 and NF‐Y on the promoters of cell cycle target genes, we tested in MDA‐MB‐231 cell line the effect of the pharmacological inhibition of YAP nuclear localization on the pro‐oncogenic transcriptional activity of mutant p53. We observed that inhibition of YAP nuclear localization by cerivastatin (Fig EV3A), an inhibitor of the mevalonate pathway rate‐limiting enzyme HMG‐CoA reductase, resulted in a reduced ability of mutant p53 to bind the cyclin A promoter (Fig 6B). Then, we assayed the effect of mevalonate pathway inhibition on the transactivation of an exogenously expressed luciferase gene driven by cyclin B promoter. As shown in Fig 6C, cerivastatin efficiently blunted the luciferase signal in a dose‐dependent manner. Next, we monitored the expression of endogenous cell cycle genes after cerivastatin treatment. As shown in Fig 6D and E, statin treatment of MDA‐MB‐231 and SKBr3 cell lines (but not of wild‐type p53‐expressing MCF7 cells) strongly reduced the expression of all the tested cell cycle genes, in a YAP‐dependent manner (Fig EV3B, D and F), to an extent comparable to that obtained with the transfection of YAP siRNA (see Figs 1E and 3A). As expected, similar results were obtained by inhibiting the mevalonate pathway with ZA (Fig 6F). As the inhibition of YAP nuclear localization by statins or ZA can efficiently blunt the pro‐proliferative potential of mutant p53 in cancer cell, our results suggest that YAP is a key effector of the pro‐oncogenic function of mutant p53. Importantly, the antiproliferative effect of statins was partially lost when mutant p53 was depleted or when a non‐phosphorylatable YAP mutant was reintroduced in MDA‐MB‐231 cells (Figs 6G and EV3C and D), suggesting that the pro‐oncogenic mutant p53‐YAP axis is required for the anticancer effect of statins in these cells. In line, the effect of cerivastatin on MCF7 cell proliferation was significantly lower compared to MDA‐MB‐231 cells and, in this cellular context, p53 knock‐down had any effect on cell proliferation (Fig EV3E).
Figure EV3. Pharmacological inhibition of YAP impairs mutant p53‐driven proliferation.
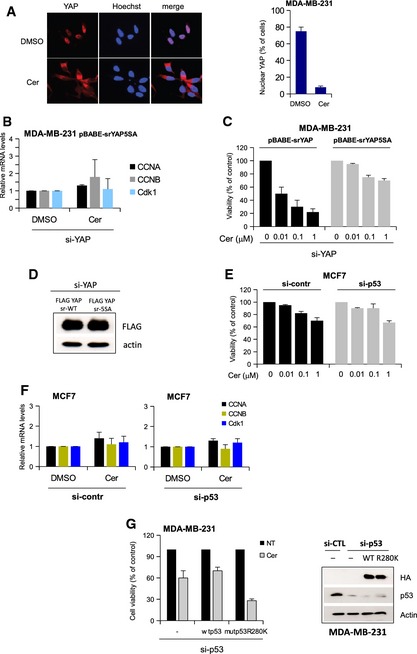
- Representative images (left) and quantification (right) of MDA‐MB‐231 cells with nuclear localized YAP after treatment with dimethylsulfoxide (DMSO) or cerivastatin (Cer) for 24 h. At least 300 cells were scored. Bars represent mean ± s.d.
- Quantitative PCR (qPCR) analysis of MDA‐MB‐231 stably expressing the siRNA‐resistant (sr) YAP‐5SA. Cells were transfected with YAP siRNA. After 24 h, cells were treated with dimethylsulfoxide (NT) or 1 μM cerivastatin (CER) for additional 48 h. Bars represent mean ± s.d.
- Viability assay of MDA‐MB‐231 cells stably expressing srYAP‐WT and srYAP‐5SA. Cells were transfected with YAP siRNA, and after 24 h, cells were treated with increasing amounts of cerivastatin (0, 0.01, 0.1, 1 μM) for additional 48 h. Data are normalized to the respective untreated samples. Bars represent mean ± s.d.
- Western blot analysis of the cells previously used (B and C).
- Viability assay of MCF7 cells. Cells were transfected with control siRNA (siCTL) or p53 siRNA (sip53), and after 24 h, cells were treated with increasing amounts of cerivastatin (0, 0.01, 0.1, 1 μM) for additional 48 h. Data are normalized to the respective untreated samples. Bars represent mean ± s.d.
- Quantitative PCR (qPCR) analysis of MCF7 cells. Cells were transfected with control siRNA (si‐CTL) or p53 siRNA (si‐p53), and after 24 h, cells were treated with dimethylsulfoxide (DMSO) or 1 μM cerivastatin (CER) for additional 48 h. Bars represent mean ± s.d.
- Viability assay of MDA‐MB‐231 cells stably expressing control pMSCV (–), pMSCV‐srp53WT, and pMSCV‐srp53R280K. Cells were transfected with p53 siRNA, and after 24 h, cells were treated with cerivastatin 1 μM for additional 48 h. The endogenous and exogenous (HA antibody) expression of p53 proteins are evaluated by Western blot analysis using actin staining as loading control. Data are normalized to the respective untreated samples. Bars represent mean ± s.d.
To address the specificity of cerivastatin effect on mutp53‐YAP axis, we considered the same genetic background. MDA‐MB‐231 (mutp53R280K) cells silenced for endogenous mutant p53 were reconstituted with siRNA‐resistant constructs for wt p53 or mutant p53 (p53K280) and incubated with Cer (Fig EV3G). As shown in Fig EV3G, the effect of statin was stronger in mutant p53‐expressing cells.
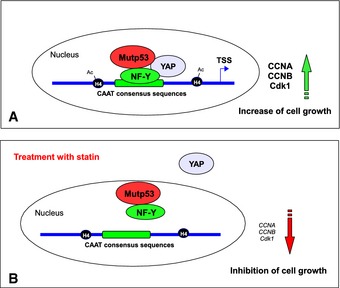
Based on this notion, we hypothesize that statins could be employed as anticancer therapeutics by inhibiting cell cycle progression in mutant p53–YAP expressing tumors (Fig 7).
Figure 7. Schematic representation summarizing the proposed mechanism of the cell cycle gene regulation by YAP and mutant p53.
Discussion
The Yes‐associated protein (YAP) is a WW domain containing protein that has been originally identified as Yes (and Src) kinase‐interacting protein 34. Mainly characterized as critical transducers of the Hippo tumor suppressor pathway, YAP and its paralog TAZ act in the nucleus as transcriptional co‐activators with key role in development, tissue homeostasis, and cancer 35, 36. TEADs proteins have been firstly identified as key interacting transcription factors of YAP and TAZ that mediate a number of YAP/TAZ functions in mammalian cells 35. Despite the intense scrutiny of the biology and regulation of YAP/TAZ, the mechanism(s) of YAP and TAZ transcriptional activity remains still largely unknown 37.
In the last few years, the repertoire of YAP and TAZ transcriptional partners has become broad, but it is still incomplete 38, 39, 40, 41. Moreover, while YAP and TAZ are structurally related and share similar upstream regulators and downstream effectors, emerging evidence indicates that these two proteins have also specific biological outcomes, underlying the importance to clarify to which extent the transcriptional activity as well as the repertoire of transcriptional interactors of YAP and TAZ overlap. Indeed, it has been shown that TAZ behaves as a key factor for stem and reprogramming 42, while YAP exerts mainly pro‐proliferative activities to control organ growth 36.
In this work, we have identified mutant but not wild‐type p53 as a tumor‐specific, YAP‐specific transcriptional partner. YAP and mutant p53 proteins share a common transcriptional program to control cell cycle progression in cancer cells, and their interaction is essential for mutant p53 pro‐proliferative functions. This is one of the first evidences showing the mechanism by which YAP and TAZ exert distinct functions depending on the cell context and the engaged oncogenic pathway.
We have demonstrated that YAP interacts with mutant p53, together form a complex with NF‐Y, a master cell cycle regulator, and aberrantly promotes the expression of cell cycle‐related genes. Since the oligomerization domain of mutant p53 appears to play a role in the binding to YAP, we might suggest that structural alterations or post‐translational modifications within this domain impact on the formation of mutp53/YAP protein complex. Indeed, YAP but not TAZ depletion remarkably reduced the expression of cyclin A, cyclin B, and CDK1 genes and consequently the proliferation rate of breast cancer cells. Importantly, the effect of YAP on cell cycle progression is dependent upon the presence of missense mutant p53 proteins, which are essential to redirect YAP onto NF‐Y‐bound promoters to foster cell cycle progression. Supporting these results, we found a direct correlation between the expression levels of the above‐mentioned cell cycle genes and a YAP‐dependent gene signature in diverse breast cancer datasets. This correlation was more significant in tumors expressing mutant p53 proteins when compared with those carrying wt‐p53. Moreover, in patients with mutant p53, a low level of YAP signature correlated with better prognosis, suggesting that the mutant p53‐YAP axis may instigate an oncogenic transcriptional network that has a profound impact on tumor progression.
Recently its has been shown that YAP and TAZ are under the metabolic control of the mevalonate pathway, whose pharmacological inhibition efficiently blocked proliferation by forcing their cytoplasmic retention 33. Of note, mutant p53 proteins have been shown to activate the mevalonate pathway in breast cancer cells 18. Our evidences suggest that inhibition of this metabolic pathway can blunt the pro‐oncogenic potential of mutant p53 proteins impeding YAP/TAZ nuclear activities. Indeed, we have shown that cytoplasmic re‐localization of YAP/TAZ, by using mevalonate pathway inhibitors, caused a marked reduction in the expression of the mutant p53 transcriptional targets cyclin A, cyclin B, and CDK1 genes both in vitro and in vivo. According to our results, this effect can be specifically ascribed to the impairment of the YAP/mutant p53/NF‐Y complex. Based on this, it can be envisaged that either pharmacological approaches aimed at dissociating mutantp53/YAP transcriptional network (by both restoring wt‐p53 activity and modifying YAP subcellular localization) or the use of molecules acting directly on mutp53/YAP complex to disrupt their interaction could be very effective in the treatment of tumors bearing mutant p53.
Our results underlie the centrality of the mevalonate pathway not only as a key downstream effector of mutant p53 oncogenic functions but also as an important input to sustain mutant p53 pro‐proliferative nuclear functions by forcing YAP nuclear localization 18. This study thus suggests a new connection between cancer metabolism and cell proliferation and opens the possibility that other known regulators of the mevalonate pathway (e.g. SREBP, mTOR, AMPK, LKB) or upstream inputs could impact on mutant p53‐dependent proliferative action through YAP activation.
As TP53 mutations occur in many human tumors, the molecular scenario hereby documented for breast cancer could be even more general. This might also account for the very low frequency of YAP gene mutations in human cancers and provide further evidence that YAP amount and subcellular localization are critical for its oncogenic activity.
Materials and Methods
Over‐representation GSEA analysis
Over‐representation analysis was performed using Gene Set Enrichment Analysis and gene sets derived from previously published gene signatures (Dataset EV1). In particular, we investigated whether the expression levels of MDA‐MB‐231 cells silenced for mutant p53 proteins were associated with elevated expression of staminal 43, stem tumorigenic 44, Myc 45, YAP/TAZ 25, induced by YAP (A) 46, induced by YAP (B) 47, repressed by YAP 46, NOTCH A (Notch signature) 48, Notch B (NICD signature) 48, RAS 45, ERBB2 49, beta‐catenin 45, WNT 50, TGF‐beta A 51, TGF‐beta B 7, TGF‐beta C 52, NF‐κB 53, STAT3 54, SRC 45, E2F3 45, mutant p53 55, wt‐p53 55, TCF4 56, HIF 52, Sharp1 52, and of 217 Biocarta gene sets derived from the Molecular Signatures Database (http://www.broadinstitute.org/gsea/msigdb/index.jsp).
GSEA software (http://www.broadinstitute.org/gsea/index.jsp) was applied on log2 expression data of si‐p53 and si‐control MDA‐MB‐231 cells as in GSE53153. Gene sets were considered significantly enriched at FDR < 5% when using Signal2Noise as metric and 1,000 permutations of gene sets.
Mutant p53 signature
We calculate the “p53‐mutant gene signature” from a publicly available gene expression dataset (GSE53153) using a standard protocol. The processing of the raw gene expression data was performed in the R computing environment version 3.1 (http://www.r-project.org/), with BioConductor packages (http://www.bioconductor.org/). Statistical analysis for differentially expressed genes was performed with limma 57. P‐values were adjusted for multiple testing using Benjamini and Hochberg's method to control the false discovery rate and set less than 0.05; fold change threshold was set greater than two.
We compared the Gene Ontology of the p53 mutant gene list and the Gene Ontology of YAP/TAZ gene list of 25. In particular, ClusterProfiler R package was used to perform the gene lists enrichment analysis for biological process (BP) and molecular functions (MF) 58. The threshold was set at P ≤ 0.000001.
Breast cancer dataset
We downloaded the METABRIC collection, comprising microarray data and clinical annotations for 997 breast cancer samples, from the European Genome‐Phenome Archive (EGA, http://www.ebi.ac.uk/ega/) under accession number EGAD00010000210 58. Original Illumina probe identifiers have been mapped to Entrez gene IDs using the Bioconductor illuminaHumanv3.db annotation package for Illumina HT‐12 v3 arrays obtaining log2 intensity values for a total of 19,761 genes. We derived the TP53 status from Dataset EV1 of Silwal‐Pandit and collegues 26 where 117 samples of the METABRIC collection are annotated as “missense” mutant p53 and 584 as wt‐p53.
Signatures and signature scores
YAP/TAZ signature is as in Zhang et al 25, while YAP activity signatures are as in Dupont et al 47 and Zhao et al 46. To identify two groups of tumor samples with either high or low levels of a given gene signature, we used the classifier described in Adorno et al 7. Briefly, we defined a classification rule based on summarizing the standardized expression levels of each gene in a signature into a combined score with zero mean. Tumors were then classified as signature Low if the combined score was negative and as signature High if the combined score was positive.
Kaplan–Meier survival analysis
To evaluate the prognostic value of the YAP/TAZ signature, we estimated, using the Kaplan–Meier method, the probabilities of disease‐specific survival in mutant and wild‐type p53 samples (n = 701). To confirm these findings, the Kaplan–Meier curves were compared using the log‐rank (Mantel–Cox) test. P‐value was calculated according to the standard normal asymptotic distribution. Survival analysis was performed in GraphPad Prism.
Cell lines, culture conditions, and treatments
Lung cancer H1299 (p53 null), breast cancer SKBr3 (mutp53R175H), MDA‐MB‐468 (mutp53R273H), MDA‐MB‐231 (mutp53R280K), T47D (mutp53C194D), colon cancer SW480 (mutp53R273H/P309S), colon cancer HCT116 (wild‐type p53) and head and neck cancer CAL27 (mutp53H193L), head and neck cancer FaDu (mutp53R248L), pancreatic cancer Panc1 (mutp53R273H), and breast cancer MCF7 (wild‐type p53) cell lines were cultured in RPMI medium (Life Technologies, Carlsbad, CA, USA), all media supplemented with 10% (v/v) FBS, penicillin, and streptomycin (Life Technologies, Carlsbad, CA, USA)4, 32, 59. Cerivastatin (SML0005) and zoledronic acid (SML0223) were purchased from Sigma‐Aldrich.
Plasmids and RNA transfection
Wild‐type and mutant p53 exogenous expression was obtained by over‐expression of pcDNA3‐wtp53, pcDNA3‐p53‐R175H, pcDNA3‐p53‐R273H, and pcDNA3HA‐p53‐R280K vectors in H1299 cells. Empty pcDNA3 vector was used as a control. GFP‐YAP vector was previously described 60, and empty pGL4 vector was used as a control. The p53R175H deletion mutants, including p53R175H Δprol (lacking the amino acids 61–94 proline rich region), p53R175H 1–355, and p53R175H 1–338 (lacking a part of COOH‐terminal, including the oligomerization domain), were previously described 61.
The pBABE‐srYAP and pBABE‐srYAP5SA vectors are a kind gift from Prof. Stefano Piccolo, Università di Padova.
Cells were transfected with Lipofectamine 2000 by following the manufacturer's instructions (Invitrogen, Carlsbad, CA, USA).
The following sequences were employed for siRNA oligonucleotides transfection: siYAP 5′‐GACAUCUUCUGGUCAGAGA‐3′ 62; siYAP_1 previously described 32, 47; sip53 previously described 63; sip53_1 smart pool of three target‐specific oligos (sc‐29435 Santa Cruz Biotechnology); 64 siTAZ previously described; 59 siNF‐YB smart pool of three target‐specific oligos (sc‐29945 Santa Cruz Biotechnology); and siGFP as non‐silencing control 5′‐GGCTACGTCCAGGAGCGCACC‐3′ 4.
All siRNA were purchased from PRIMM Biotech company. Cells were transfected with RNAiMax reagent by following the manufacturer's instructions (Life Technologies, Carlsbad, CA, USA).
Cell viability assay and proliferation assay
Cells (104 per well) were plated in 96‐well plates and treated as indicated. Cell viability was assayed with ATPlite (Perkin Elmer) or WST‐1 (Promega) according to the manufacturer's instructions using the EnSpireMultilabel Reader (Perkin Elmer).
A 0.5‐ml aliquot of cell suspension was mixed with 0.5 ml of 0.4% trypan blue dye and left for 5 min at room temperature. Cells were counted using the Thoma cell counting chamber, and the number of viable cells was determined. Data are derived from three independent experiments where at least 300 cells were scored.
Cell extracts, immunoprecipitations, and Western blotting
Cell extracts were prepared as previously described 4. To homogenize the cells destinated to the the co‐immunoprecipitation of endogenous mutant p53, YAP, and NF‐YB proteins, we have modified the lysis buffer with 150 mM Hepes pH 7.5, 300 mM NaCl, 1% Triton X‐100, phosphatase, and protease inhibitors. Cells were harvested and lysed by sonication in lysis buffer and cleared by centrifugation. Protein concentrations were determined by colorimetric assay (Bio‐Rad, Hercules, CA, USA).
For each immunoprecipitation, 1 μg of antibody and 1 μg of the relative IgG (Santa Cruz Biotech.) as control were used. To immunoprecipitate YAP protein, we used YAP rabbit polyclonal antibody H‐125 (sc‐15407, Santa Cruz Biotech) and YAP goat polyclonal antibody S‐20 (SC‐17140, Santa Cruz Biotech). To immunoprecipitate p53 protein, we used p53 Ab7 sheep polyclonal antibody (Millipore), and to immunoprecipitate NF‐YB, we used NF‐YB rabbit polyclonal antibody (RL100‐401‐101; Rockland Immunochemical).
40 μg of protein total cell extract (4% of the protein total cell extract used for the IP) was loaded for the Western blot analysis. 1 μg of protein total cell extract was either immunoprecipitated with 1 μg of anti‐p53, or with 1 μg of anti‐YAP antibodies or 1 μg of purified IgG. Since anti‐p53 Ab is a sheep polyclonal antibody (Ab7, Millipore), we used the related purified sheep IgG, while for anti‐YAP antibody (H‐125, Santa Cruz) which is rabbit polyclonal antibody, we used the related purified rabbit IgG. We washed the IPs three times in lysis buffer and eluted them in 50 μl of SDS sample buffer. Then, 25 μl (50% of the total IP, 500 μg of protein total cell extract) out of 50 μl of total IP was loaded on running gel. This experimental procedure was applied for all the co‐IP within the manuscript.
Western blotting was performed using the following primary antibodies: mouse monoclonal p53 (DO1), GAPDH (Santa Cruz Biotech.), actin (Sigma), YAP (no. 56701, Abcam), FLAG (clone M2, Sigma), HA (Abcam) antibodies; rabbit polyclonal NF‐YB (Rockland), CCNA (Santa Cruz Biotech.), CCNB1 (Santa Cruz Biotech.), CDK1 (Santa Cruz Biotech.), and TAZ (anti‐WWTR1, HPA007415; Sigma). Western blot analysis was performed with the aid of the enhanced chemiluminescence system (Thermo Fisher Scientific, Rockford, IL, USA).
The acquisition of the chemiluminescence has performed by using Alliance 4.7 by UVITEC (Eppendorf).
RNA isolation and quantitative real‐time PCR analysis
Total RNA was extracted from cells by using TRI‐Reagent (Invitrogen, Carlsbad, CA, USA) in accordance with manufacturer's instructions.
PCR analyses were carried out using oligonucleotides specific for the genes listed in Appendix Table S1. Transcripts were measured by real‐time PCR using the SYBR Green assay (Applied Biosystems, Carlsbad, CA, USA) with a StepOne instrument and 7500 Fast Real‐Time PCR System (Applied Biosystems). All primer sets worked under identical quantitative PCR cycling conditions with similar efficiencies to obtain simultaneous amplification in the same run. The 2−ΔΔCT method for relative quantitation of gene expression was used to determine mRNA expression levels. GAPDH and beta‐actin gene expression were used as endogenous controls to standardize mRNA expression. All reactions were performed in triplicate. P‐values were calculated with two‐tailed Student's t‐test. Statistically significant results were referred with a P‐value < 0.05.
Chromatin immunoprecipitation experiments (ChIP)
1% formaldehyde cross‐linking and chromatin immunoprecipitations were performed as described 65. The chromatin solution was immunoprecipitated with mouse monoclonal anti‐p53 DO1 (Santa Cruz Biotech.), rabbit polyclonal anti‐YAP (Santa Cruz Biotech.), and rabbit polyclonal H4Ac (Cell Signaling Tech., Inc.) or without antibody as negative control. The immunoprecipitations were performed using Pierce ChIP‐grade Protein A/G magnetic beads (Thermo Fisher Scientific, Rockford, IL, USA). The immunoprecipitated and purified chromatin was subjected to quantitative PCR analysis (qPCR). The promoter occupancy was analyzed by qPCR using the SYBR Green assay (Applied Biosystems, Carlsbad, CA, USA) and the 7500 Fast Real‐Time PCR System (Applied Biosystems). Primers used for the amplification of the different regulatory regions are listed in the Appendix Table S2. Normalization was performed to the amount of input chromatin. The ChIP results were further normalized by subtracting the amount resulted from the qPCR of a region resulted negative for the recruitment of mutant p53 (Appendix Table S2) 4. P‐values were calculated with two‐tailed t‐test. Statistically significant results were referred with P‐value < 0.05.
Luciferase reporter gene assays
Cells (2 × 10⁵) were seeded into 6‐ or 12‐well culture plates and transiently transfected with 100 ng of pCCAAT‐B2LUC or pmutCCAAT‐B2LUC reporter constructs 4, and 1/10 of CMV‐Renilla plasmid as an internal control for transfection efficiency.
For luciferase assays in siRNA‐transfected cells, siRNA transfection was achieved first and, after 48 h, transfection of plasmid DNA was performed. Cells were collected 24 h after DNA transfection. Firefly luciferase activity was measured using a Luciferase Reporter Assay System kit (Promega) according to the manufacturer's instructions. Luciferase activity was assayed with the GloMax 96 Microplate Luminometer (Promega) and normalized for Renilla expression and for protein amount. Each sample was transfected in duplicate, and each experiment was repeated at least three times independently.
Statistical analysis
Data are presented as mean ± s.d. or SEM, derived from at least 3 independent experiments. Statistical significance between means was assessed by Student's t‐test. P < 0.05 was considered significant.
Author contributions
SDA and GS conceived, designed, and performed experiments and analyzed the data. SB and SP performed the bioinformatics analysis. EI, FV, and MF performed experiments and analyzed the data. SS, GDS, and GB conceived the project, analyzed the data, and wrote the manuscript.
Conflict of interest
The authors declare that they have no conflict of interest.
Supporting information
Appendix
Expanded View Figures PDF
Dataset EV1
Dataset EV2
Dataset EV3
Source Data for Appendix
Review Process File
Source Data for Figure 4
Acknowledgements
We thank A. Testa for reading and editing the manuscript. This work was supported from the Italian Association for Cancer Research (AIRC) Special Program Molecular Clinical Oncology “5 per mille” (Grant n. 10016) and Italian Ministry of Health to G.D.S. This work was supported from the Italian Association for Cancer Research (AIRC) (Grant n.14455) and from Epigenomics Flagship Project (EPIGEN; sub‐project 7.6) to G.B. This study makes use of data generated by the Molecular Taxonomy of Breast Cancer International Consortium. Funding for the project was provided by Cancer Research UK and the British Columbia Cancer Agency Branch.
EMBO Reports (2016) 17: 188–201
References
- 1. Walerych D, Napoli M, Collavin L, Del Sal G (2012) The rebel angel: mutant p53 as the driving oncogene in breast cancer. Carcinogenesis 33: 2007–2017 [DOI] [PMC free article] [PubMed] [Google Scholar]
- 2. Muller PA, Vousden KH (2013) p53 mutations in cancer. Nat Cell Biol 15: 2–8 [DOI] [PubMed] [Google Scholar]
- 3. Brosh R, Rotter V (2009) When mutants gain new powers: news from the mutant p53 field. Nat Rev Cancer 9: 701–713 [DOI] [PubMed] [Google Scholar]
- 4. Di Agostino S, Strano S, Emiliozzi V, Zerbini V, Mottolese M, Sacchi A, Blandino G, Piaggio G (2006) Gain of function of mutant p53: the mutant p53/NF‐Y protein complex reveals an aberrant transcriptional mechanism of cell cycle regulation. Cancer Cell 10: 191–202 [DOI] [PubMed] [Google Scholar]
- 5. Blandino G, Levine AJ, Oren M (1999) Mutant p53 gain of function: differential effects of different p53 mutants on resistance of cultured cells to chemotherapy. Oncogene 18: 477–485 [DOI] [PubMed] [Google Scholar]
- 6. Freed‐Pastor WA, Prives C (2012) Mutant p53: one name, many proteins. Genes Dev 26: 1268–1286 [DOI] [PMC free article] [PubMed] [Google Scholar]
- 7. Adorno M, Cordenonsi M, Montagner M, Dupont S, Wong C, Hann B, Solari A, Bobisse S, Rondina MB, Guzzardo V et al (2009) A Mutant‐p53/Smad complex opposes p63 to empower TGFbeta‐induced metastasis. Cell 137: 87–98 [DOI] [PubMed] [Google Scholar]
- 8. Girardini JE, Napoli M, Piazza S, Rustighi A, Marotta C, Radaelli E, Capaci V, Jordan L, Quinlan P, Thompson A et al (2011) A Pin1/mutant p53 axis promotes aggressiveness in breast cancer. Cancer Cell 20: 79–91 [DOI] [PubMed] [Google Scholar]
- 9. Lang GA, Iwakuma T, Suh YA, Liu G, Rao VA, Parant JM, Valentin‐Vega YA, Terzian T, Caldwell LC, Strong LC et al (2004) Gain of function of a p53 hot spot mutation in a mouse model of Li‐Fraumeni syndrome. Cell 119: 861–872 [DOI] [PubMed] [Google Scholar]
- 10. Olive KP, Tuveson DA, Ruhe ZC, Yin B, Willis NA, Bronson RT, Crowley D, Jacks T (2004) Mutant p53 gain of function in two mouse models of Li‐Fraumeni syndrome. Cell 119: 847–860 [DOI] [PubMed] [Google Scholar]
- 11. Donehower LA, Lozano G (2009) 20 years studying p53 functions in genetically engineered mice. Nat Rev Cancer 9: 831–841 [DOI] [PubMed] [Google Scholar]
- 12. Olivier M, Langerød A, Carrieri P, Bergh J, Klaar S, Eyfjord J, Theillet C, Rodriguez C, Lidereau R, Bièche I et al (2006) The clinical value of somatic TP53 gene mutations in 1,794 patients with breast cancer. Clin Cancer Res 12: 1157–1167 [DOI] [PubMed] [Google Scholar]
- 13. Goh AM, Coffill CR, Lane DP (2011) The role of mutant p53 in human cancer. J Pathol 223: 116–126 [DOI] [PubMed] [Google Scholar]
- 14. Bougeard G, Sesboüé R, Baert‐Desurmont S, Vasseur S, Martin C, Tinat J, Brugières L, Chompret A, de Paillerets BB, Stoppa‐Lyonnet D et al (2008) Molecular basis of the Li‐Fraumeni syndrome: an update from the French LFS families. J Med Genet 45: 535–538 [DOI] [PubMed] [Google Scholar]
- 15. Girardini JE, Marotta C, Del Sal G (2014) Disarming mutant p53 oncogenic function. Pharmacol Res 79: 75–87 [DOI] [PubMed] [Google Scholar]
- 16. Sampath J, Sun D, Kidd VJ, Grenet J, Gandhi A, Shapiro LH, Wang Q, Zambetti GP, Schuetz JD (2001) Mutant p53 cooperates with ETS and selectively up‐regulates human MDR1 not MRP1. J Biol Chem 276: 39359–39367 [DOI] [PubMed] [Google Scholar]
- 17. Stambolsky P, Tabach Y, Fontemaggi G, Weisz L, Maor‐Aloni R, Siegfried Z, Shiff I, Kogan I, Shay M, Kalo E et al (2010) Modulation of the vitamin D3 response by cancer‐associated mutant p53. Cancer Cell 17: 273–285 [DOI] [PMC free article] [PubMed] [Google Scholar]
- 18. Freed‐Pastor WA, Mizuno H, Zhao X, Langerød A, Moon SH, Rodriguez‐Barrueco R, Barsotti A, Chicas A, Li W, Polotskaia A et al (2012) Mutant p53 disrupts mammary tissue architecture via the mevalonate pathway. Cell 148: 244–258 [DOI] [PMC free article] [PubMed] [Google Scholar]
- 19. Sorrentino G, Comel A, Mantovani F, Del Sal G (2014) Regulation of mitochondrial apoptosis by Pin1 in cancer and neurodegeneration. Mitochondrion 19(Pt A): 88–96 [DOI] [PubMed] [Google Scholar]
- 20. Bertini E, Oka T, Sudol M, Strano S, Blandino G (2009) YAP: at the crossroad between transformation and tumor suppression. Cell Cycle 8: 49–57 [DOI] [PubMed] [Google Scholar]
- 21. Pan D (2010) The hippo signaling pathway in development and cancer. Dev Cell 19: 491–505 [DOI] [PMC free article] [PubMed] [Google Scholar]
- 22. Johnson R, Halder G (2014) The two faces of Hippo: targeting the Hippo pathway for regenerative medicine and cancer treatment. Nat Rev Drug Discov 13: 63–79 [DOI] [PMC free article] [PubMed] [Google Scholar]
- 23. Pegoraro S, Ros G, Ciani Y, Sgarra R, Piazza S, Manfioletti G (2015) A novel HMGA1‐CCNE2‐YAP axis regulates breast cancer aggressiveness. Oncotarget 6: 19087–19101 [DOI] [PMC free article] [PubMed] [Google Scholar]
- 24. Di Minin G, Bellazzo A, Dal Ferro M, Chiaruttini G, Nuzzo S, Bicciato S, Rami D, Bulla R, Sommaggio R, Rosato A et al (2014) Mutant p53 reprograms TNF signaling in cancer cells through interaction with the tumor suppressor DAB2IP. Mol Cell 56: 617–629 [DOI] [PubMed] [Google Scholar]
- 25. Zhang H, Liu C‐Y, Zha Z‐Y, Zhao B, Yao J, Zhao S, Xiong Y, Lei QY, Guan KL (2009) TEAD transcription factors mediate the function of TAZ in cell growth and epithelial‐ mesenchymal transition. J Biol Chem 284: 13355–13362 [DOI] [PMC free article] [PubMed] [Google Scholar]
- 26. Silwal‐Pandit L, Vollan HK, Chin SF, Rueda OM, McKinney S, Osako T, Quigley DA, Kristensen VN, Aparicio S, Børresen‐Dale AL et al (2014) TP53 mutation spectrum in breast cancer is subtype specific and has distinct prognostic relevance. Clin Cancer Res 20: 3569–3580 [DOI] [PubMed] [Google Scholar]
- 27. Mantovani R (1998) A survey of 178 NF‐Y binding CCAAT boxes. Nucleic Acids Res 26: 1135–1143 [DOI] [PMC free article] [PubMed] [Google Scholar]
- 28. Gurtner A, Starace G, Norelli G, Piaggio G, Sacchi A, Bossi G (2010) Mutant p53‐induced up‐regulation of mitogen‐activated protein kinase kinase 3 contributes to gain of function. J Biol Chem 285: 14160–14169 [DOI] [PMC free article] [PubMed] [Google Scholar]
- 29. Liu K, Ling S, Lin WC (2011) TopBP1 mediates mutant p53 gain of function through NF‐Y and p63/p73. Mol Cell Biol 31: 4464–4481 [DOI] [PMC free article] [PubMed] [Google Scholar]
- 30. Acin S, Li Z, Mejia O, Roop DR, El‐Naggar AK, Caulin C (2011) Gain‐of‐function mutant p53 but not p53 deletion promotes head and neck cancer progression in response to oncogenic K‐ras. J Pathol 225: 479–489 [DOI] [PMC free article] [PubMed] [Google Scholar]
- 31. Strano S, Munarriz E, Rossi M, Castagnoli L, Shaul Y, Sacchi A, Oren M, Sudol M, Cesareni G, Blandino G (2001) Physical interaction with Yes‐associated protein enhances p73 transcriptional activity. J Biol Chem 276: 15164–15173 [DOI] [PubMed] [Google Scholar]
- 32. Sorrentino G, Ruggeri N, Specchia V, Cordenonsi M, Mano M, Dupont S, Manfrin A, Ingallina E, Sommaggio R, Piazza S et al (2014) Metabolic control of YAP and TAZ by the mevalonate pathway. Nat Cell Biol 16: 357–366 [DOI] [PubMed] [Google Scholar]
- 33. Wang Z, Wu Y, Wang H, Zhang Y, Mei L, Fang X, Zhang X, Zhang F, Chen H, Liu Y et al (2014) Interplay of mevalonate and Hippo pathways regulates RHAMM transcription via YAP to modulate breast cancer cell motility. Proc Natl Acad Sci USA 111: E89–E98 [DOI] [PMC free article] [PubMed] [Google Scholar]
- 34. Sudol M (1994) Yes‐associated protein (YAP65) is a proline‐rich phosphoprotein that binds to the SH3 domain of the Yes proto‐oncogene product. Oncogene 9: 2145–2152 [PubMed] [Google Scholar]
- 35. Li Z, Zhao B, Wang P, Chen F, Dong Z, Yang H, Guan KL, Xu Y (2010) Structural insights into the YAP and TEAD complex. Genes Dev 24: 235–240 [DOI] [PMC free article] [PubMed] [Google Scholar]
- 36. Zhao B, Li L, Lei Q, Guan KL (2010) The Hippo‐YAP pathway in organ size control and tumorigenesis: an updated version. Genes Dev 24: 862–874 [DOI] [PMC free article] [PubMed] [Google Scholar]
- 37. Piccolo S, Dupont S, Cordenonsi M (2014) The biology of YAP/TAZ: hippo signaling and beyond. Physiol Rev 94: 1287–1312 [DOI] [PubMed] [Google Scholar]
- 38. Strano S, Monti O, Pediconi N, Baccarini A, Fontemaggi G, Lapi E, Mantovani F, Damalas A, Citro G, Sacchi A et al (2005) The transcriptional coactivator Yes‐associated protein drives p73 gene‐target specificity in response to DNA Damage. Mol Cell 18: 447–459 [DOI] [PubMed] [Google Scholar]
- 39. Hong W, Guan KL (2012) The YAP and TAZ transcription co‐activators: key downstream effectors of the mammalian Hippo pathway. Semin Cell Dev Biol 23: 785–793 [DOI] [PMC free article] [PubMed] [Google Scholar]
- 40. Varelas X (2014) The Hippo pathway effectors TAZ and YAP in development, homeostasis and disease. Development 141: 1614–1626 [DOI] [PubMed] [Google Scholar]
- 41. Comel A, Sorrentino G, Capaci V, Del Sal G (2014) The cytoplasmic side of p53's oncosuppressive activities. FEBS Lett 588: 2600–2609 [DOI] [PubMed] [Google Scholar]
- 42. Cordenonsi M, Zanconato F, Azzolin L, Forcato M, Rosato A, Frasson C, Inui M, Montagner M, Parenti AR, Poletti A et al (2011) The Hippo transducer TAZ confers cancer stem cell‐related traits on breast cancer cells. Cell 147: 759–772 [DOI] [PubMed] [Google Scholar]
- 43. Pece S, Tosoni D, Confalonieri S, Mazzarol G, Vecchi M, Ronzoni S, Bernard L, Viale G, Pelicci PG, Di Fiore PP (2010) Biological and molecular heterogeneity of breast cancers correlates with their cancer stem cell content. Cell 140: 62–73 [DOI] [PubMed] [Google Scholar]
- 44. Liu R, Wang X, Chen GY, Dalerba P, Gurney A, Hoey T, Sherlock G, Lewicki J, Shedden K, Clarke MF (2007) The prognostic role of a gene signature from tumorigenic breast‐cancer cells. N Engl J Med 356: 217–226 [DOI] [PubMed] [Google Scholar]
- 45. Bild AH, Yao G, Chang JT, Wang Q, Potti A, Chasse D, Joshi MB, Harpole D, Lancaster JM, Berchuck A et al (2006) Oncogenic pathway signatures in human cancers as a guide to targeted therapies. Nature 439: 353–357 [DOI] [PubMed] [Google Scholar]
- 46. Zhao B, Ye X, Yu J, Li L, Li W, Li S, Yu J, Lin JD, Wang CY, Chinnaiyan AM et al (2008) TEAD mediates YAP‐dependent gene induction and growth control. Genes Dev 22: 1962–1971 [DOI] [PMC free article] [PubMed] [Google Scholar]
- 47. Dupont S, Morsut L, Aragona M, Enzo E, Giulitti S, Cordenonsi M, Zanconato F, Le Digabel J, Forcato M, Bicciato S et al (2011) Role of YAP/TAZ in mechanotransduction. Nature 474: 179–183 [DOI] [PubMed] [Google Scholar]
- 48. Mazzone M, Selfors LM, Albeck J, Overholtzer M, Sale S, Carroll DL, Pandya D, Lu Y, Mills GB, Aster JC et al (2010) Dose‐dependent induction of distinct phenotypic responses to Notch pathway activation in mammary epithelial cells. Proc Natl Acad Sci USA 107: 5012–5017 [DOI] [PMC free article] [PubMed] [Google Scholar]
- 49. Mackay A, Jones C, Dexter T, Silva RLA, Bulmer K, Jones A, Simpson P, Harris RA, Jat PS, Neville AM et al (2003) cDNA microarray analysis of genes associated with ERBB2 (HER2/neu) overexpression in human mammary luminal epithelial cells. Oncogene 22: 2680–2688 [DOI] [PubMed] [Google Scholar]
- 50. DiMeo TA, Anderson K, Phadke P, Fan C, Feng C, Perou CM, Naber S, Kuperwasser C (2009) A novel lung metastasis signature links Wnt signaling with cancer cell self‐renewal and epithelial‐mesenchymal transition in basal‐like breast cancer. Cancer Res 69: 5364–5373 [DOI] [PMC free article] [PubMed] [Google Scholar]
- 51. Padua D, Zhang XH‐F, Wang Q, Nadal C, Gerald WL, Gomis RR, Massagué J (2008) TGFbeta primes breast tumors for lung metastasis seeding through angiopoietin‐like 4. Cell 133: 66–77 [DOI] [PMC free article] [PubMed] [Google Scholar]
- 52. Montagner M, Enzo E, Forcato M, Zanconato F, Parenti A, Rampazzo E, Basso G, Leo G, Rosato A, Bicciato S et al (2012) SHARP1 suppresses breast cancer metastasis by promoting degradation of hypoxia‐inducible factors. Nature 487: 380–384 [DOI] [PubMed] [Google Scholar]
- 53. Park BK, Zhang H, Zeng Q, Dai J, Keller ET, Giordano T, Gu K, Shah V, Pei L, Zarbo RJ et al (2007) NF‐kappaB in breast cancer cells promotes osteolytic bone metastasis by inducing osteoclastogenesis via GM‐CSF. Nat Med 13: 62–69 [DOI] [PubMed] [Google Scholar]
- 54. Alvarez JV, Febbo PG, Ramaswamy S, Loda M, Richardson A, Frank DA (2005) Identification of a genetic signature of activated signal transducer and activator of transcription 3 in human tumors. Cancer Res 65: 5054–5062 [DOI] [PubMed] [Google Scholar]
- 55. Miller LD, Smeds J, George J, Vega VB, Vergara L, Ploner A, Pawitan Y, Hall P, Klaar S, Liu ET et al (2005) An expression signature for p53 status in human breast cancer predicts mutation status, transcriptional effects, and patient survival. Proc Natl Acad Sci USA 102: 13550–13555 [DOI] [PMC free article] [PubMed] [Google Scholar]
- 56. van de Wetering M, Sancho E, Verweij C, de Lau W, Oving I, Hurlstone A, van der Horn K, Batlle E, Coudreuse D, Haramis AP et al (2002) The beta‐catenin/TCF‐4 complex imposes a crypt progenitor phenotype on colorectal cancer cells. Cell 111: 241–250 [DOI] [PubMed] [Google Scholar]
- 57. Smyth GK (2005) Limma: linear models for microarray data In Statistics for Biology and Health, Gentleman R, Carey V, Dudoit S, Irizarry R, Huber W. (eds), pp 397–420. New York: Springer; [Google Scholar]
- 58. Yu G, Wang LG, Han Y, He QY (2012) ClusterProfiler: an R package for comparing biological themes among gene clusters. OMICS 16: 284–287 [DOI] [PMC free article] [PubMed] [Google Scholar]
- 59. Azzolin L, Zanconato F, Bresolin S, Forcato M, Basso G, Bicciato S, Cordenonsi M, Piccolo S (2012) Role of TAZ as mediator of Wnt signaling. Cell 151: 1443–1456 [DOI] [PubMed] [Google Scholar]
- 60. Curtis C, Shah SP, Chin SF, Turashvili G, Rueda OM, Dunning MJ, Speed D, Lynch AG, Samarajiwa S, Yuan Y et al The genomic and transcriptomic architecture of 2,000 breast tumours reveals novel subgroups. Nature 486: 346–352. [DOI] [PMC free article] [PubMed] [Google Scholar]
- 61. Valenti F, Fausti F, Biagioni F, Shay T, Fontemaggi G, Domany E, Yaffe MB, Strano S, Blandino G, Di Agostino S (2011) Mutant p53 oncogenic functions are sustained by Plk2 kinase through an autoregulatory feedback loop. Cell Cycle 10: 4330–4340 [DOI] [PubMed] [Google Scholar]
- 62. Fausti F, Di Agostino S, Cioce M, Bielli P, Sette C, Pandolfi PP, Oren M, Sudol M, Strano S, Blandino G (2013) ATM kinase enables the functional axis of YAP, PML and p53 to ameliorate loss of Werner protein‐mediated oncogenic senescence. Cell Death Differ 20: 1498–1509 [DOI] [PMC free article] [PubMed] [Google Scholar]
- 63. Brummelkamp TR, Bernards R, Agami R (2002) Stable suppression of tumorigenicity by virus‐mediated RNA interference. Cancer Cell 2: 243–247 [DOI] [PubMed] [Google Scholar]
- 64. Shetty S, Velusamy T, Idell S, Shetty P, Mazar AP, Bhandary YP, Shetty RS (2007) Regulation of urokinase receptor expression by p53: novel role in stabilization of uPAR mRNA. Mol Cell Biol 27: 5607–5618 [DOI] [PMC free article] [PubMed] [Google Scholar]
- 65. Valenti F, Ganci F, Fontemaggi G, Sacconi A, Strano S, Blandino G, Di Agostino S (2014) Gain of function mutant p53 proteins cooperate with E2F4 to transcriptionally downregulate RAD17 and BRCA1 gene expression. Oncotarget 6: 5547–5566 [DOI] [PMC free article] [PubMed] [Google Scholar]
Associated Data
This section collects any data citations, data availability statements, or supplementary materials included in this article.
Supplementary Materials
Appendix
Expanded View Figures PDF
Dataset EV1
Dataset EV2
Dataset EV3
Source Data for Appendix
Review Process File
Source Data for Figure 4