

Abstract
Mutations in TRPML1 cause the lysosomal storage disease mucolipidosis type IV (MLIV). The role of TRPML1 in cell function and how the mutations cause the disease are not well understood. Most studies focus on the role of TRPML1 in constitutive membrane trafficking to and from the lysosomes. However, this cannot explain impaired neuromuscular and secretory cells’ functions that mediate regulated exocytosis. Here, we analyzed several forms of regulated exocytosis in a mouse model of MLIV and, opposite to expectations, we found enhanced exocytosis in secretory glands due to enlargement of secretory granules in part due to fusion with lysosomes. Preliminary exploration of synaptic vesicle size, spontaneous mEPSCs, and glutamate secretion in neurons provided further evidence for enhanced exocytosis that was rescued by re‐expression of TRPML1 in neurons. These features were not observed in Niemann–Pick type C1. These findings suggest that TRPML1 may guard against pathological fusion of lysosomes with secretory organelles and suggest a new approach toward developing treatment for MLIV.
Keywords: exocytosis, lysosomes, secretory organelles, TRPML1 channel
Subject Categories: Membrane & Intracellular Transport, Neuroscience
Introduction
Mucolipidosis type IV (MLIV, MIM 252650) is an inherited lysosomal storage disease (LSD) characterized by neurodegenerative disorders with corneal opacity, achlorhydia, and impaired neuromuscular junctions 1. MLIV is caused by mutations in the lysosomal TRP channel TRPML1 2, rather than loss of specific lysosomal hydrolytic activity and altered lysosomal metabolism, typical of other LSDs. TRPML1 is a member of the superfamily of TRP channels and functions as a nonselective Ca2+‐permeable cation channel 3. TRPML1 is activated by the endolysosomal lipid PI(3,5)P2 4 and participates in the regulation of lysosomal pH 5, 6 and in Ca2+ release from lysosomes 7. However, how mutations or deletion of TRPML1 in patients cause the disease is not well understood.
Morphological and biochemical studies of various tissues obtained from patients with MLIV showed cytoplasmic accumulation of inclusion bodies with multiple lamellar membranes 8, 9, and storage of lipids and proteins 10, 11. These observations led to examining the role of TRPML1 in membrane trafficking into and from the lysosomes. Knockdown or deletion of TRPML1 were suggested to cause delayed exit of stored material from the lysosomes 12, perhaps by altering lysosomal exocytosis 13. Recent interesting studies demonstrated a role of TRPML1 in phagocytosis of large particles, whereby activation of TRPML1 by PI(3,5)P2 resulted in lysosomal Ca2+ release, delivering the lysosomes to sites of nascent phagosomes to promote phagocytic ingestion of large extracellular particles such as apoptotic cells 14. Similarly, TRPML1 is required for lysosomal‐dependent membrane repair 15. Deletion of TRPML1 results in accumulated damage and skeletal muscle wasting and weakness due to impaired membrane repair 15. These functions of TRPML1 are attributed mostly to altered constitutive membrane trafficking that involves the lysosomes and occur on a time scale of many minutes to hours.
Another important cellular membrane trafficking is regulated exocytosis that occurs on a time scale of milliseconds. Whether and how altered lysosomal function due to deletion of TRPML1 affects regulated exocytosis to affect neuromuscular junctions and the function of secretory glands is unknown. Remarkably, in spite of the prevalent neurodegeneration in all LSDs and the importance of regulated exocytosis in neuronal function, how regulated exocytosis is altered in any LSD has not been investigated. A priory, because of the impaired constitutive membrane trafficking, it is generally expected that all cellular activities involving membrane traffic are inhibited in LSDs. The exact opposite is found here, revealing an unexpected function of TRPML1 in lysosomal function. In the present studies, we examined how impaired lysosomal functions in MLIV and in Niemann–Pick type C1 (NPC1) affect multiple forms of regulated exocytosis in several tissues. We discovered that deletion of Trpml1 results in a marked augmentation of all forms of regulated exocytosis likely due to fusion of lysosomes with secretory organelles to enlarge their size. Excessive exocytosis of digestive enzymes by the pancreas results in chronic pancreatitis. In addition, increased spontaneous mEPSCs and exocytosis of glutamate by Trpml1 −/− neurons were observed. Excessive unregulated exocytosis was unique to MLIV and was not observed in NPC1. These findings indicate that a major role of TRPML1 is to guard against unintended, pathological fusion of the lysosomes with other intracellular organelles that in secretory cells include the secretory organelles. These finding have significant implication to understanding and treating MLIV.
Results
Slow progress of neuromuscular deficiency is unique to MLIV 1. It is generally assumed that impaired neuromuscular function is due to impaired membrane trafficking that more severely affects neurons 16, 17. Moreover, it was shown recently that skeletal muscle repair is defective in Trpml1 −/− mice due to impaired trafficking of lysosomes to the area of membrane damage 15. However, excessive regulated exocytosis and rapid exhaustion of neurotransmitters can impair neuromuscular function and be a major cause of the neurodegeneration in MLIV. Remarkably, in spite of its importance in every physiological function and of its association with rapid membrane trafficking and fusion/fission events, regulated exocytosis has not been evaluated in MLIV or any other LSD. Here, we examined several forms of regulated exocytosis in mouse models of the lysosomal storage diseases MLIV and Niemann–Pick type C1.
Uncontrolled Ca2+‐dependent exocytosis in Trpml1 −/− mice
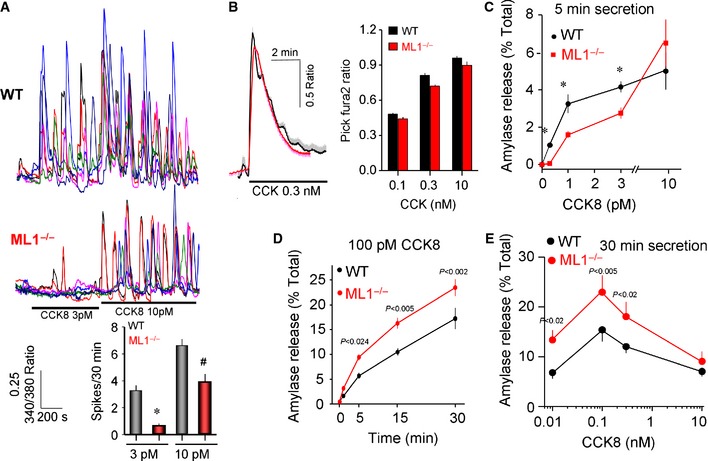
Regulated exocytosis by pancreatic acini is the classical model used to study Ca2+‐stimulated exocytosis of secretory granules in non‐excitable cells 18. First, we examined the effect of deleting Trpml1 on receptor‐evoked Ca2+ signaling in pancreatic acinar cells. Figure 1A shows that deletion of Trpml1 reduced the response of acini to stimulation by low concentrations of the secretagogue cholecystokinin (CCK), as reflected in reduced Ca2+ oscillations frequency. The response to low CCK concentration involves generation of NAADP and activation of TPC2, which resides at the lysosomes together with TRPML1 19 and mediates the NAADP response in pancreatic acini 20. It is likely that the CCK response releases Ca2+ from the lysosomal compartment that requires the function of TRPML1. At higher CCK concentrations (0.1–10 nM) when IP3 generation dominates the response, cell stimulation resulted in a biphasic peak‐plateau response, at which no difference between wild‐type and Trpml1 −/− acini could be resolved (Fig 1B). Regulated exocytosis by pancreatic acini occurs in two phases, a rapid Ca2+‐dependent phase that is completed in < 5 min and is followed by a PKC‐stimulated phase that is augmented by Ca2+ 21. Impaired Ca2+ signaling in Trpml1 −/− cells was expected to result in impaired exocytosis. Figure 1C shows that this was the case for the first phase at CCK concentrations between 0.3 and 3 pM measured during 5 min of stimulation. However, no difference was observed at 10 pM CCK in acini stimulated only for 5 min and, unexpectedly, an enhanced exocytosis was observed at the optimal physiological concentrations of 10–100 pM CCK measured during 30‐min stimulation (Fig 1D and E).
Figure 1. Impaired Ca2+‐regulated exocytosis in Trpml1 −/− pancreatic acini.
-
A, BIsolated acini from wild‐type (WT) and Trpml1 −/− mice (ML1−/−) were used to determine the frequency of Ca2+ oscillations in response to stimulation with 3 and 10 pM CCK (A) and the response to high concentrations of CCK (B). The average frequency from multiple experiments is given in the graph in (A). The traces and columns in (B) show the mean ± s.e.m. of three experiments each including 4–6 acini composed of 6–10 cells.
-
C–EPancreatic acini were used to measure exocytosis in response to stimulation with the indicated CCK concentrations. (C) Exocytosis during the first 5 min of stimulation. (D) The two phases, first rapid and second sustained phase, of exocytosis. (E) Exocytosis at the indicated CCK concentrations measured during 30 min of stimulation.
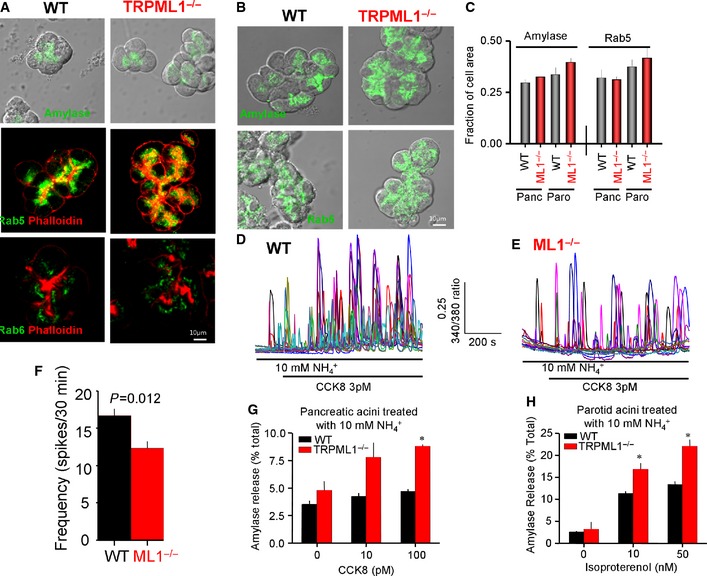
In an attempt to understand the aberrant enhanced regulated exocytosis in spite of reduced Ca2+ signals, we determined the localization of secretory granules, amylase content, the actin cytoskeleton that acts as a barrier for regulated exocytosis 22, and the polarized localization of Rab5 and Rab6, which regulate organellar traffic 23. These parameters are all unchanged in pancreatic (Fig EV1A and C) and parotid acini (Fig EV1B and C). In addition, although collapsing the acidic lysosomal pH by treatment with NH4 + reduced exocytosis in all cell types, it did not change the difference in CCK‐evoked Ca2+ oscillations (Fig EV1D–F) or exocytosis by pancreatic (Fig EV1G) or by parotid (Fig EV1H) wild‐type and Trpml1 −/− acini.
Figure EV1. Localization and levels of amylase, actin, Rab5, and Rab6 and effect of organellar pH on exocytosis in wild‐type and Trpml1 −/− acini.
-
A–CIsolated acini from the pancreas (A) and the parotid glands (B) of wild‐type and Trpml1 −/− mice were stained for amylase, actin, Rab5, and Rab6 as listed in the images. The graph in (C) shows the mean ± s.e.m. fluorescence intensity analyzed with ImageJ of at least eight clusters containing 10–20 cells from three mice of each line.
-
D–FCa2+ oscillations evoked by 3 pM CCK in wild‐type (D) and Trpml1 −/− (E) pancreatic acini treated with 10 mM NH 4 +, and the graph in (F) shows the mean ± s.e.m. of the frequency.
-
G, HAmylase release from pancreatic (G) and parotid acini (H) treated with 10 mM NH 4 + and stimulated with CCK8 (G) or isoproterenol (H). The results are the mean ± s.e.m. of three experiments with acini obtained from three mice of each line. *P < 0.05.
Since the secretory granules and lysosomes are in close proximity in polarized secretory cells, we asked whether deletion of Trpml1 may have resulted in unintended pathological fusion of secretory granules with the lysosomes in a hybrid organelle and in granules self‐fusion. We used multiple independent assays to test this possibility. First, we analyzed the size of secretory granules by TEM. The images and size analysis (Fig 2A) reveal a remarkable enlargement of pancreatic acini secretory granules in Trpml1 −/− mice. Next, we used four independent assays to examine interaction between lysosomes and secretory granules. We reasoned that fusion of lysosomes and secretory granules should increase co‐localization and association of their specific markers. Staining with the granules marker amylase and the lysosomal marker LAMP1 in fixed acini showed about 10‐fold increased co‐localization (Fig 2B). In live acini, labeling the lysosomes with lysotracker revealed accumulation of lysosomes in the apical pole of Trpml1 −/− pancreatic acini, increased overlap of lysosomes with secretory granule area, and the presence of high numbers of large vesicles that may represent hybrid organelles (Fig 2C). Biochemical evidence for interaction between the granules and lysosomes was obtained by measuring co‐immunoprecipitation (Co‐IP) of the lysosomal LAMP1 and two secretory granules markers VAMP8 24 and Rab27b 25. Figure 2D shows a marked increase in the Co‐IP of the markers in pancreatic acini from Trpml1 −/− mice. Finally, we determined if stimulation of exocytosis resulted in concomitant release of digestive enzymes and lysosomal content by measuring CCK‐stimulated exocytosis of lysosomal acid phosphatase (AP). Figure 2E shows that CCK‐stimulated Trpml1 −/− pancreatic acini mediate large exocytosis of AP, indicating coincident release of lysosomal and granular contents.
Figure 2. Impaired secretory granules size and association with lysosomes in Trpml1 −/− pancreatic acini.
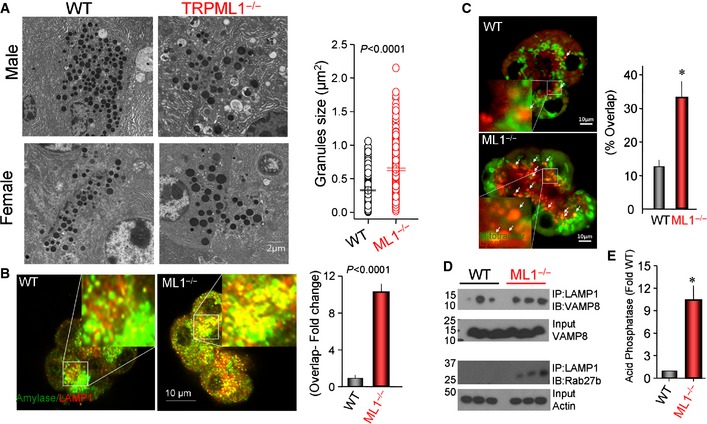
- Example TEM ultrastructure images obtained from male and female mice pancreas and the graph shows the granules size distribution. Granules size was analyzed in at least 10 images from 3 wild‐type and 5 Trpml1 −/− mice.
- Fixed acini were co‐stained with amylase (granules) and LAMP1 (lysosomes), and the fold overlap was calculated from 14 and 11 images obtained from 3 wild‐type and 3 Trpml1 −/− mice, respectively (mean ± s.e.m.).
- Live wild‐type and Trpml1 −/− acini were labeled with mitotracker (green) and lysotracker (red). The panels show the merged green, red, and DIC images. The large vesicles are marked by white arrows and shown at higher magnification in the inserts. The overlap between lysosomes and granules was determined by ImageJ (see Materials and Methods). The results are from 14 wild‐type and 30 Trpml1 −/− acini each comprising 3–7 cells and obtained from 3 wild‐type and four Trpml1 −/− mice (mean ± s.e.m.), *P < 0.01.
- Co‐IP of lysosomal LAMP1 and granule proteins VAMP8 and Rab27b. Note the increased lysosomal/granules interaction.
- Enhanced exocytosis of the lysosomal acid phosphatase by Trpml1 −/− acini stimulated with 100 pM CCK. The results are mean ± s.e.m. of three experiments with acini obtained from 3 wild‐type and 3 Trpml1 −/− mice *P < 0.001.
Source data are available online for this figure.
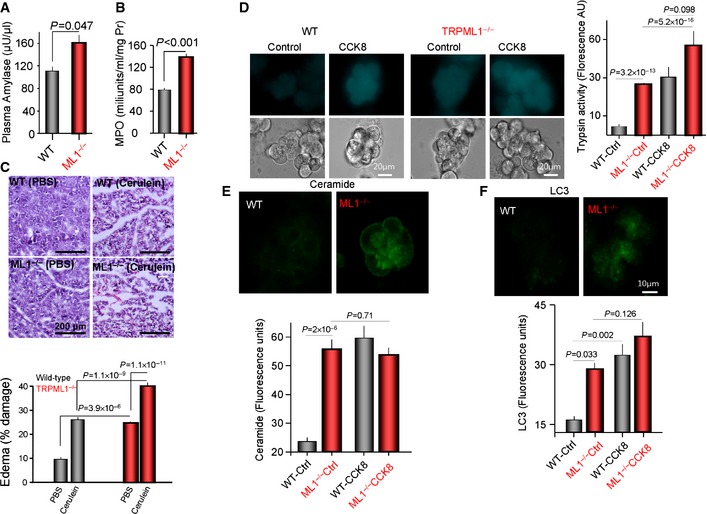
Taken together, the multiple assays in Figure 2 strongly suggest fusion of lysosomes with secretory granules. This conclusion is further supported by the in vivo consequence of this fusion. Fusion of lysosomes with secretory granules and activation of digestive enzymes within the pancreas by Cathepsin B‐mediated cleavage of proenzymes are the hallmark of pancreatitis 26, 27. Therefore, in Figure 3 we used a panel of assays to determine whether digestive enzymes are activated in the pancreas and the Trpml1 −/− mice develop pancreatitis. Figure 3A shows elevated plasma amylase, Figure 3B shows high pancreatic MPO levels indicative of inflammation in Trpml1 −/− mice, and Figure 3C shows edema and damage to the pancreatic parenchyma before induction of acute pancreatitis. Moreover, Figure 3D, E and F shows activation of trypsin, accumulation of ceramide at the granular area, and activation of autophagy, respectively, in the Trpml1 −/− mice that are as high as those observed in wild‐type acini after induction of acute pancreatitis by stimulation with high concentration of CCK. Hence, all typical pancreatitis parameters tested in pancreatic tissue and in isolated acini indicate that the Trpml1 −/− mice have chronic pancreatitis, as expected from premature activation of digestive enzymes. This is most likely due to Cathepsin B‐mediated cleavage and activation of the digestive enzymes that is observed in all forms of pancreatitis 26, 27.
Figure 3. Trpml1 −/− mice develop chronic pancreatitis.
-
A, BPlasma amylase (A) and pancreatic MPO (B) in three mice of each line.
-
CEdema was evaluated in pancreas of mice treated with PBS or cerulein by H&E staining. Shown are examples of images and the average damage in the graph, which shows the mean ± s.e.m. of four experiments with each mouse line.
-
DIntracellular trypsin activity was measured in isolated pancreatic acini before and after stimulation with 10 nM CCK for 30 min. Shown are example images and the averages.
-
EIsolated acini before and after stimulation with 10 nM CCK for 30 min were stained for the lipid ceramide. The figure shows example images before stimulation and the averaged fluorescence intensity.
-
FIsolated acini before and after stimulation with 10 nM CCK for 30 min were stained with the autophagy marker LC3. The figure shows example images before stimulation, and the columns depict the fluorescence intensity as determined by ImageJ.
Uncontrolled cAMP‐dependent exocytosis in Trpml1 −/− mice
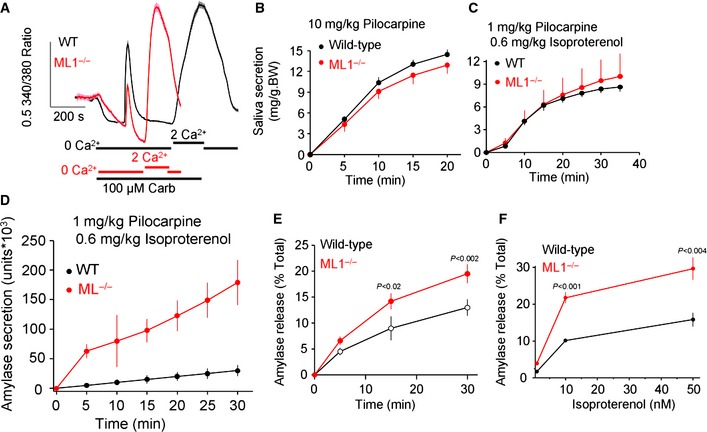
The findings in Figures 1 and 2 raised the question of whether other forms of regulated exocytosis are altered in the Trpml1 −/− mice. To address this question, we analyzed fluid and amylase secretion in another model of exocytosis, that by salivary glands. Fluid secretion by salivary glands is Ca2+‐driven fueled by activation of the Ca2+‐activated Cl− and K+ channels 28, whereas regulated exocytosis is stimulated by the cAMP pathway 29. The salivary glands cAMP pathway has PKA and Ecap1 components that independently stimulate regulated exocytosis 30, 31. In salivary glands, the Ca2+ signal is dominated by receptor‐mediated Ca2+ influx 32, which is nearly normal in Trpml1 −/− cells (Fig 4A). Notably, the Ca2+‐stimulated fluid secretion (salivation) evoked by maximal (Fig 4B) or submaximal (Fig 4C) stimulation of the muscarinic receptors with pilocarpine is unaltered in Trpml1 −/− mice. On the other hand, exocytosis stimulated by isoproterenol, which acts through the cAMP pathways, is markedly augmented when measured in mice (Fig 4D) or in isolated acini at all times and isoproterenol concentrations (Fig 4E and F). Hence, deletion of Trpml1 results in augmented regulated exocytosis, whether stimulated by the Ca2+ (pancreas) or by the cAMP (salivary glands) signaling pathways.
Figure 4. Normal Ca2+‐stimulated fluid secretion but augmented cAMP‐stimulated exocytosis in Trpml1 −/− mice salivary glands.
-
AIsolated acini from wild‐type (black) and Trpml1 −/− mice (red) loaded with Fura2 were used to determine [Ca2+]i in response to stimulation with 100 μM carbachol. The traces are the mean ± s.e.m. of six acinar clusters. Similar results were obtained in three experiments.
-
B, CSaliva was collected from wild‐type (black) and Trpml1 −/− mice (red) injected i.p. with 10 mg/kg pilocarpine (B) or 1 mg/kg pilocarpine and 0.6 mg/kg isoproterenol (C) over 20–40 min to stimulate fluid secretion by pilocarpine and amylase secretion by isoproterenol. Each condition used 4–5 mice from each line, and the results are given as the mean ± s.e.m.
-
DThe saliva collected in (C) was used to determine the amount of secreted amylase (mean ± s.e.m.).
-
E, FIsolated acini from the parotid glands of wild‐type (black) or Trpml1 −/− mice (red) were used to measure amylase secretion in response to 50 nM isoproterenol for the indicated times (E) and the indicated isoproterenol concentrations during 30 min stimulation (F). The results are the mean ± s.e.m. obtained from two mice of each line.
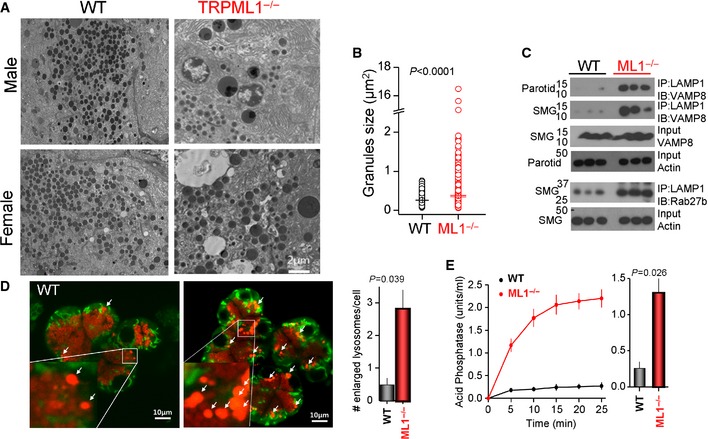
As in the pancreas, the secretory granules in parotid acini of Trpml1 −/− mice are markedly enlarged (Fig 5A and B). Deletion of Trpml1 prominently increased the Co‐IP of the lysosomal marker LAMP1 and the secretory granule markers VAMP8 and Rab27b in the parotid and submandibular glands (Fig 5C). Staining the lysosomes with lysotracker revealed the presence of numerous large vesicles in Trpml1 −/− acini (Fig 5D). Moreover, Figure 5E shows that deletion of Trpml1 resulted in copious secretion of the lysosomal acid phosphatase into the saliva, supporting the notion that lysosomal and granules contents are mixed in the Trpml1 −/− acini fused organelles that simultaneously exocytose the lysosomal and granular contents.
Figure 5. Enlarged salivary glands secretory granules, association of lysosomes and secretory granules, and secretion of the lysosomal acid phosphatase in Trpml1 −/− mice.
-
A, BExample TEM images (A) and granules size distribution (B) in parotid glands determined from 10 images obtained from three wild‐type mice and 14 images obtained from 4 Trpml1 −/− mice.
-
CCo‐IP of the lysosomal LAMP1 and the secretory granule proteins VAMP8 and Rab27b. Input control is actin.
-
DAcini isolated from the parotid glands of wild‐type and Trpml1 −/− mice were incubated with mitotracker (green) and lysotracker (red). The large vesicles in the secretory granules/lysosomal area are marked by white arrows. The average number of enlarged profiles is given in the graph and obtained from three acinar preparations of each line (mean ± s.e.m.).
-
ETime course (left) and averaged 10 min secretion (right) of the lysosomal marker acid phosphatase in the saliva collected from wild‐type (black) and Trpml1 −/− mice (red) stimulated with 1 mg/kg pilocarpine and 0.6 mg/kg isoproterenol. The mean ± s.e.m. is from four mice of each line.
Source data are available online for this figure.
Enhanced neuronal exocytosis in Trpml1 −/− mice
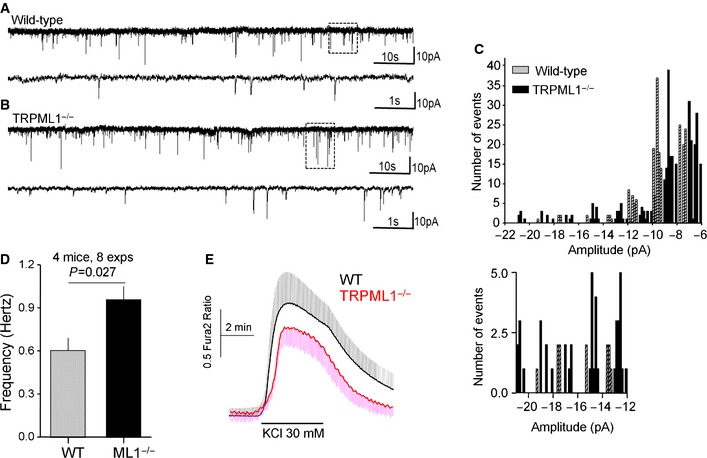
The most prominent MLIV phenotype is neurodegeneration 1, suggesting aberrant neuronal exocytosis. To test the role of TRPML1 in neurotransmission, we analyzed spontaneous mini Evoked Post Synaptic Currents (mEPSCs) from brain slices while inhibiting action potentials with TTX and GABAA receptors with Bicuculline 33. Figure 6A and B shows example traces, Figure 6C shows current size distribution, and Figure 6D shows the frequency of the mEPSCs in wild‐type and Trpml1 −/− neurons. The basal mEPSCs frequency in Trpml1 −/− neurons was about 50% higher than in wild‐type neurons (Fig 6D), and Trpml1 −/− neurons showed higher number of large mEPSCs (Fig 6C, expanded portion). To exclude the possibility that the increased mEPSCs was due to elevated Ca2+, we measured basal and KCl‐induced Ca2+ increase in brain slices. Figure 6E shows that basal Ca2+ was similar in the two groups, while KCl‐mediated Ca2+ increase was slightly lower in Trpml1 −/− neurons. The higher mEPSCs are present in neurons from 5‐week‐old mice, long before the development of noticeable neuronal symptoms, as was reported for muscle damage 15.
Figure 6. mEPSCs and [Ca2+]i in brain slices.
-
A, BExample traces of mEPSCs recorded from wild‐type (A) and Trpml1 −/− (B) mice brain slices as detailed in Materials and Methods. The lower traces in each panel show the portion of the traces marked by dotted boxes in an expanded time scale.
-
CHistogram distribution of the events at each amplitude. The lower graph shows the distribution of the higher amplitude mEPSCs.
-
DThe frequency of mEPSCs in each line.
-
EThe Ca2+ signal in response to depolarization with 30 mM KCl in wild‐type and Trpml1 −/− slices.
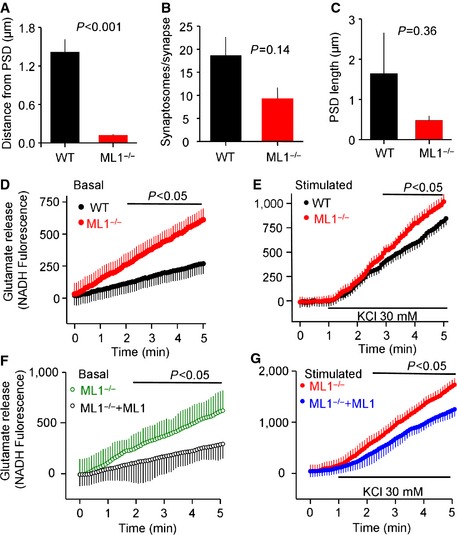
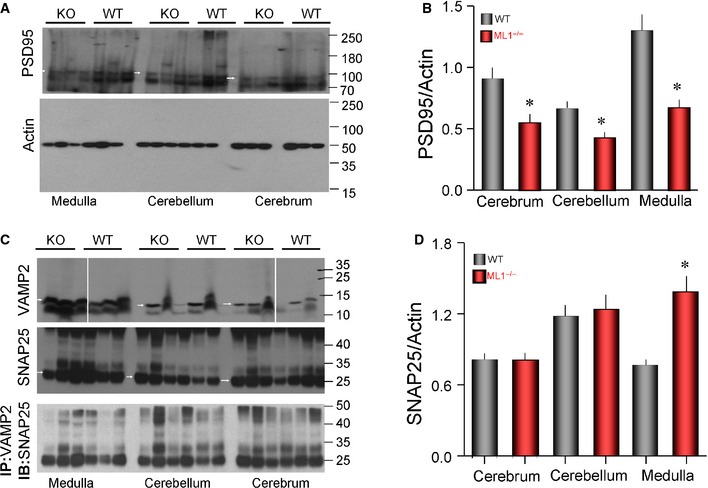
Next, we analyzed the state and number of synapses in the Trpml1 −/− mice at age 2–3 months, before the development of the severe disease phenotype and death at 6–9 months. Figure 7A and B shows that synaptic vesicles (SVs) in wild‐type synapses are fairly uniform in size. On the other hand, synapses in Trpml1 −/− neurons tend to contain large number of enlarged SV (Fig 7B). The number of active synapses, as evaluated from the number of post‐synaptic density (PSD) profiles, is reduced in the Trpml1 −/− mice (arrows in Fig 7C and summary in Fig 7D), perhaps due to continuous use. This is further suggested by crowding of synaptosomes at the active zone of Trpml1 −/− neurons (Fig EV2A), reduced synaptosomes/synapse (Fig EV2B) with no significant change in PSD length (Fig EV2C), and the reduced level of PSD in all areas of the brain tested by Western blots (Fig EV3A and B).
Figure 7. Impaired synaptic vesicle size, number of PSD, and exocytosis in cortical neurons.
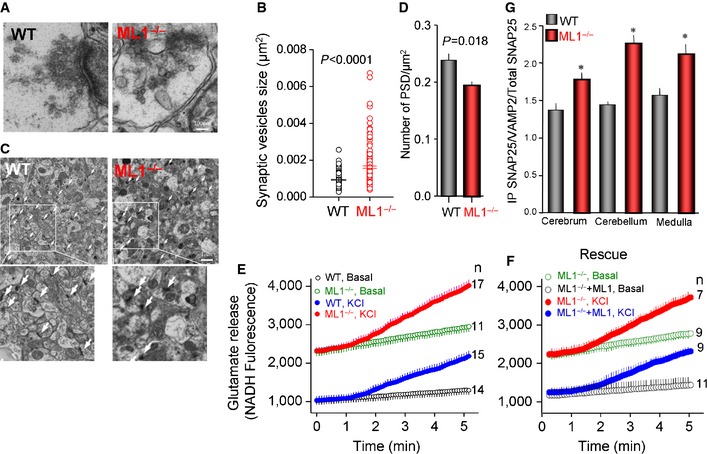
- Example TEM images of synapses in wild‐type and Trpml1 −/− mice brain cortex.
- The distribution of synaptic vesicle size determined in 10 and 14 images obtained from 3 wild‐type and 3 Trpml1 −/− mice, respectively.
- Example TEM images at low magnification of wild‐type and Trpml1 −/− mice brain cortical slices with the dark PSD profiles marked by white arrows.
- Average number of PSD/μm2 analyzed in at least 10 images obtained from three mice of each line.
- Glutamate levels and secretion by cultured cerebral cortical neurons. Total glutamate measured in non‐stimulated wild‐type (black) and Trpml1 −/− (green) neurons and neurons stimulated by depolarization with 30 mM KCl (blue and red).
- Rescue of glutamate levels and secretion by the expression of TRPML1 in cultured cerebral cortical neurons. Total glutamate measured in non‐stimulated Trpml1 −/− neurons (green) and Trpml1 −/− neurons transfected with TRPML1 (black) and untransfected (red) and TRPML1‐transfected (blue) Trpml1 −/− neurons stimulated by depolarization with 30 mM KCl.
- Averaged Co‐IP of SNAP25 and VAMP2 in three brain regions of wild‐type and Trpml1 −/− mice. The images of all blots are given in Figure EV4.
Figure EV2. Analysis of synapses parameters and of neuronal glutamate release.
-
A–CAnalysis of PSD length (A), average number of synaptosomes in synapses (B), and synaptosomes distance from PSD (C) in wild‐type and Trpml1 −/− neurons. All parameters were analyzed in 11–14 images obtained from three wild‐type and 4 Trpml1 −/− mice.
-
D–GAnalysis of glutamate release. The portion of the basal and stimulated secretion was obtained by subtracting the initial level of glutamate. Trpml1 −/− neurons transfected with RFP and empty vector (D, F, green and red) or with RFP and TRPML1 (E, G, black and blue) were used to rescue neuronal exocytosis. Shown are basal (D, F) and stimulated (E, G) secretion.
Figure EV3. Levels and Co‐IP of synaptic proteins in wild‐type and Trpml1 −/− mice.
-
A, BThe blots show the expression level of PSD95 (marked by white arrowhead) and of actin (A), and the graph in (B) shows the average of PSD95 normalized for actin in the three brain regions obtained from three wild‐type and 3 Trpml1 −/− mice.
-
CExpression levels of VAMP2 (above), SNAP25 (middle), and the Co‐IP of VAMP2/SNAP25 (below).
-
DAverage expression level of SNAP25 normalized for actin. The normalized averaged Co‐IP is shown in Fig 7.
Data information: Results in (B, D) are given as the mean ± s.e.m. *P < 0.05. Source data are available online for this figure.
To further assay the role of TRPML1 in neuronal exocytosis, cerebral cortical neurons were cultured and secretion of the neurotransmitter glutamate was determined. Excessive glutamate stimulation causes Ca2+ overload and neurotoxicity 34, which is common in neurodegenerative diseases 35. Figures 7E and EV2D show significant increase in spontaneous glutamate release by Trpml1 −/− neurons. KCl‐stimulated exocytosis of glutamate was also enhanced in Trpml1 −/− neurons (Figs 7E and EV2E). Of note, the expression of TRPML1 in the Trpml1 −/− neurons was sufficient to rescue the aberrant exocytosis, reducing both the basal (Figs 7F and EV2F) and stimulated exocytosis (Figs 7F and EV2G) to the levels found in wild‐type neurons. This indicates that reversing the damage to the lysosomes can rescue the disease phenotype. In agreement with the increased mEPSCs and basal glutamate secretion, Figure 7G and the blots in Figure EV3 show increased basal Co‐IP of the v‐SNARE VAMP2 and t‐SNARE SNAP25 in the brains of the Trpml1 −/− mice.
Enhanced exocytosis is specific for MLIV
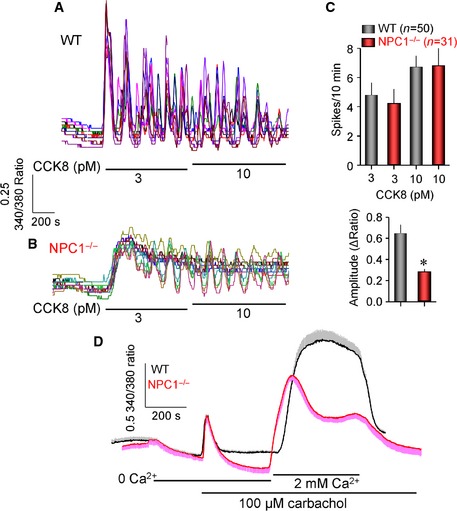
To determine whether the enhanced exocytosis is specific for MLIV, we analyzed Ca2+ signaling and exocytosis in the Npc1 −/− mice model. The results in Figures EV4 and EV5 indicate that enhanced exocytosis is specific for MLIV. Deletion of Npc1 reduced the amplitude of the Ca2+ spikes (Fig EV4A and B) and the receptor‐stimulated Ca2+ influx (Fig EV4C). Npc1−/− pancreatic acini exhibited reduced Ca2+‐driven exocytosis (Fig EV5A) and slightly reduced size of secretory granules (Fig EV5B). Npc1−/− neurons have normal SVs size (Fig EV5C). Finally, deletion of Npc1 inhibited Ca2+‐driven fluid secretion (Fig EV5D) without affecting cAMP‐driven exocytosis in salivary glands (Fig EV5E), although the size of the parotid acini granules was unchanged. Finally, the stimulated salivary glands did not secret the lysosomal acid phosphatase. The activity of TRPML1 was reported to be reduced in other LSDs, including Npc1, to suggest a common pathology in LSD related to altered membrane traffic 7. Our findings suggest that the pathology of MLIV is specific to this LSD.
Figure EV4. Properties of Ca2+ signaling in Npc1 −/− mice.
-
A, BIsolated pancreatic acini from wild‐type (A) and Npc1 −/− mice (B) loaded with Fura2 were used to analyze Ca2+ oscillations in response to stimulation with 3 and 10 pM CCK.
-
CThe graph shows the average frequency (above) and amplitude (below) of the oscillations recorded in 50 wild‐type and 31 Npc1 −/− acinar cells (mean ± s.e.m.). *P < 0.01.
-
DMean ± s.e.m. of the Ca2+ signal recorded from 7 to 9 parotic acini obtained from wild‐type (black) or Npc1 −/− mice (red). Similar results were obtained in acini from three mice of each line.
Figure EV5. Ca2+‐dependent exocytosis, Ca2+‐dependent fluid secretion, cAMP‐dependent exocytosis, granules, and synaptic size and acid phosphatase secretion in Npc1 −/− mice.
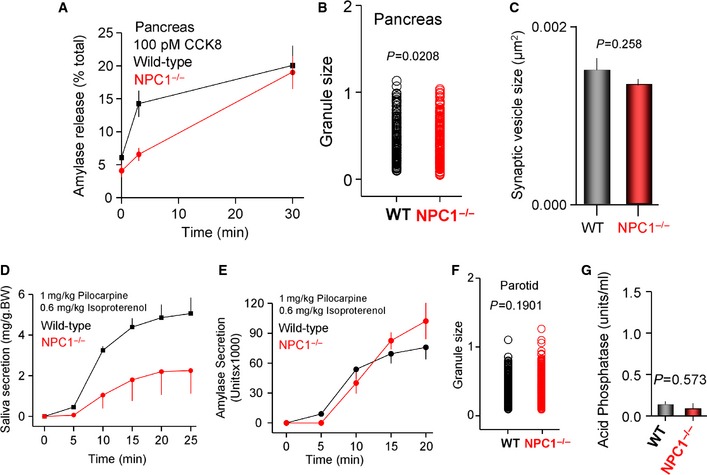
- Isolated pancreatic acini from wild‐type (black) and Npc1 −/− mice (red) were used to measure exocytosis in response to 100 pM CCK.
- TEM images similar to those in Figure 2 from wild‐type and Npc1 −/− mice were used to determine granules size distribution.
- TEM images similar to those in Figure 7 from wild‐type and Npc1 −/− mice were used to determine synaptic vesicles size distribution.
- Wild‐type (black) and Npc1 −/− mice (red) were used to determine the Ca2+‐regulated salivation in response to 1 mg/kg pilocarpine and 0.6 mg/kg isoproterenol.
- cAMP‐mediated exocytosis was analyzed by measurement of amylase secretion in the saliva collected as in (D) from wild‐type (black) and Npc1 −/− mice (red).
- TEM images similar to those in Figure 5 from wild‐type and Npc1 −/− mice were used to determine granules size distribution.
- The saliva collected after 10 min stimulation in (D) was used to determine secretion of the lysosomal acid phosphatase by wild‐type and Npc1 −/− mice.
Data information: All results are given as the mean ± s.e.m.
Discussion
The lysosomes participates in many cellular functions by sensing and responding to cellular nutrients 36 and are a hub for membrane trafficking. Impaired lysosomal function, as occurs in lysosomal storage diseases, disturbs membrane traffic to and from the lysosomes 37. Lysosomes can also undergo exocytosis, which plays a role in membrane repair 15, cell migration 38, and phagocytosis 14. All these functions are mediated by the relatively slow constitutive trafficking pathway. Another form of membrane trafficking is regulated exocytosis in secretory cells and neurons. Although formation of secretory organelles involves trafficking through the secretory pathway, after their maturation the organelles are clustered close to the secretory membrane, being it the luminal membrane in secretory cells or the active zone in neurons. Notably, lysosomes do not have a role in regulated exocytosis. The present study reports that when lysosomal function is specifically altered by deletion of the lysosomal channel TRPML1, regulated exocytosis becomes uncontrolled.
Regulated exocytosis controls rapid responses to changes in the physiological status and is particularly active in neuronal system, making it more vulnerable to uncontrolled exocytosis. The present studies in secretory glands indicate that a key role of Trpml1 is to guard against unintended, pathological fusion of lysosomes with other intracellular organelles. That this function is specific to TRPML1 is shown by the rescue of normal exocytosis by the expression of TRPML1 in Trpml1 −/− neurons. The major organelles in secretory cells are the highly fusogenic secretory granules containing the exocytosed material, which appear to be a major target of the aberrant fusion with lysosomes. The present work provides multiple independent evidence to suggest fusion between secretory granules and the lysosomes. First is the marked enlargement of the granules; second is the co‐localization of granules and lysosomal markers both in fixed and in live acini; third is the Co‐IP of granules and lysosomal markers; fourth is the concomitant agonist‐stimulated secretion of granules and lysosomal content to the luminal space; and fifth and probably the strongest evidence is the development of pancreatitis in Trpml1 −/− mice that includes intracellular activation of trypsin. It is amply established that intracellular activation of trypsin is by lysosomal cathepsin B 26, 27. This causes marked increase in all forms of regulated exocytosis, Ca2+‐driven and cAMP‐driven, in the Trpml1 −/− mice. In addition to uncontrolled exocytosis, fusion of lysosomes and secretory organelles results in secretion of harmful lysosomal proteases to the luminal and perhaps the neuronal external space.
Localization of secretory granules and lysosomal markers, like LAMP1, can also take place in newly synthesized granules, which can lead to a constitutive‐like secretion and secretion by the so‐called minor regulated pathways 39, 40. However, this is unlikely to be of major contribution to the uncontrolled enhanced exocytosis in Trpml1 −/− cells since the two minor pathways originate from small vesicle that move through intermediate endosomes 41, whereas the granules in the Trpml1 −/− mice are markedly enlarged. Additionally, we observed trypsin activation in unstimulated Trpml1 −/− pancreatic acini, which can never occur in the immature granules. Activation of trypsin from trypsinogen requires proteolysis within the acini that is mediated by lysosomal proteases 26, 27. Moreover, the minor pathways contribute < 5% of the secreted material, whereas at physiological receptor stimulation, exocytosis is nearly doubled in the Trpml1 −/− cells, a level that is many folds higher than the capacity of the minor pathways. Hence, we conclude that aberrant fusion of lysosomes and secretory granules is the most likely cause of the runaway exocytosis.
Our preliminary exploration of synaptic vesicle size and exocytosis provides evidence for interesting changes. Although these changes are compelling, the data are too preliminary for a mechanistic interpretation and firm conclusions. The increase in spontaneous mEPSC and glutamate release may lead to high basal level of glutamate in the neuronal space. The high basal glutamate exocytosis can be the result of the increased basal interaction of the v‐ and t‐SNARE in Trpml1 −/− brains. Long exposure to glutamate is neurotoxic 34, 35 and may cause the severe neurodegeneration and impaired neuromuscular junction in MLIV. Glutamate neurotoxicity and synaptic exhaustion can contribute to the reduced number of active synapses and reduced level of PSD in the brain of Trpml1 −/− mice and contribute to the neuronal deficiency in MLIV patients.
The uncontrolled excessive exocytosis is specific to MLIV and was not observed in the well‐characterized lysosomal storage disease NPC1. Hence, the phenotype reported here is not the consequence of lysosomal storage, but more likely due to loss of function of TRPML1. This is supported by the rescue of the exocytosis phenotype by the expression of TRPML1 in Trpml1 −/− neurons. It follows that TRPML1 plays a central role in the many lysosomal fusion reactions, with which a major function of TRPML1 is to determine the specificity of fusion. At this time, it is not known how TRPML1 could carry out this role. One possibility is that TRPML1 supplies the Ca2+ essential for lysosomal fusion 4, 7, with TRPML1 function regulated by specific interaction of the lysosomes with particular intracellular organelles or the plasma membrane. Another possibility is the function of TRPML1 in regulation of lysosomal pH. In the absence of TRPML1, the lysosomes are more acidic 5, 6 and lysosomal pH plays a key regulatory role in lysosomal fusions 42. It is possible that in the absence of TRPML1, continued leakage of Ca2+ from the acidic lysosome or enhanced fusogenicity by the over‐acidic lysosomes results in uncontrolled fusion with other organelles. In secretory cells with a dedicated role in regulated exocytosis, this leads to exposure of the secretory granules to lysosomal enzymes and uncontrolled regulated exocytosis.
Materials and Methods
Animals
All protocols used with the mice have been approved by the NIH animal use committee and by the Thomas Jefferson Institutional Animal Care and Use Committee. The Trpml1 −/− mice 43 and Npc1 −/− mice 44 have been described before.
Isolation of pancreatic and parotid acini
Pancreatic and parotid acini were prepared from 4‐ to 6‐month‐old mice as described previously 45. Mice were sacrificed by inhalation of CO2, and the pancreas or parotid glands were quickly removed into an ice‐cold buffer containing (mM) the following: 140 NaCl, 5 KCl, 1 CaCl2 1, MgCl2, 10 HEPES (pH 7.4), 0.1% bovine serum albumin, 0.1% pyruvic acid, and 0.02% soybean trypsin inhibitor (solution A). The tissues were minced finely and were digested with collagenase P (0.25 mg/ml) dissolved in the buffered solution. After washing twice, the acini were suspended in the standard buffer and were kept on ice until use.
Neuronal culture
Cerebral cortical neurons were dissociated and cultured from cerebral cortex, as previously described 46. Briefly, the mice were euthanized by cervical dislocation; the brains were quickly removed and immersed in ice‐cold Hanks balanced salt solution (Mediatech, Manassas, VA). The cerebral cortex was dissected and minced, and the cells were dissociated by enzymatic digestion with papain, followed by mechanical trituration. After centrifugation at 1,000× g, fractions enriched in neurons were collected and resuspended in culture medium containing Neurobasal‐A (Invitrogen), which promotes the survival of postnatal neurons, 1% GlutaMax (Invitrogen), 2% penicillin–streptomycin–amphotericin B solution (Invitrogen), and 20% fetal bovine serum (Atlanta Biologicals, Lawrenceville, GA). Cells were plated on round, 25‐mm glass coverslips, previously coated with poly‐L‐lysine (Sigma‐Aldrich) in 6‐well plates. Cultures were maintained at 37°C in a humidified atmosphere with 5% CO2. After 24 h, the cultured neurons were transferred to complete growth medium containing 10% fetal bovine serum. The mitotic inhibitor cytosine β‐arabino furanoside (1 μM) (Sigma‐Aldrich) was added to the culture to inhibit glial cell proliferation 47. Cells were used for imaging after 2–4 days in culture.
Measurement of salivary secretion
Salivary collection was as we described before 32. In brief, mice were anesthetized with a mixture of 75 mg/kg ketamine and 1 mg/kg dexmedetomidine and underwent endotracheal intubation to maintain an open airway path. Salivation was stimulated by I.P. delivery of the muscarinic agonist pilocarpine to stimulate fluid secretion and of the β adrenergic agonist isoproterenol to stimulate exocytosis. Saliva was collected under minimal vacuum into pre‐weighed tubes. Saliva was collected every 5 min for 20–30 min and was normalized to body weight.
Induction of acute pancreatitis
Acute pancreatitis was induced by IP injection of mice with cerulein as detailed before 45. To test vulnerability of the Trpml1 −/− mice to induce acute pancreatitis, the mice were injected hourly only four times over the 4‐h period. Two hours after the last injection (a total of 6 h), the mice were sacrificed for evaluation of serum amylase and edema.
Measurement of [Ca2+]i
Acini were loaded with Fura2 by incubation with 2 μM Fura2/AM for 30 min at room temperature in solution A. Acini attached to cover glass that formed the bottom of a perfusion chamber were continually perfused with a warm, 37°C solution A without pyruvic acid and soybean trypsin inhibitor. Agonists were added to the perfusate, fluorescence was recorded at excitation wavelengths of 340 and 380 nm, and emitted light was collected and digitized with a cutoff filter at 510 nm. Collected images were analyzed using MetaFluor and presented as the change in 340/380 ratio.
Determination of amylase release
Samples of stimulated pancreatic acinar suspension were collected and centrifuged for 5 s at 1,000× g and the supernatants collected to measure secreted amylase. To determine amylase content in saliva, whole saliva secreted in response to IP injection of pilocarpine and isoproterenol was collected. Amylase activity was measured with a Phadebas kit (Pharmacia & Upjohn, Cambridge, MA) following the manufacturer's instructions. Briefly, each sample was diluted in phosphate‐buffered saline containing the amylase substrate and incubated for 5 min at 37°C in a shaking water bath. Reactions were stopped by the addition of 2 N NaOH to the mixture. After centrifugation at 14,000× g for 5 min, the supernatant was collected and OD was measured at an absorbance wavelength of 620 nm.
Measurement of acid phosphatase (AP) release
AP activity was measured in secreted fluids with an AP assay kit (Sigma‐Aldrich, St. Louis, MO) following the manufacturer's instructions. Briefly, each sample was diluted in citrate buffer containing 4‐nitrophenyl phosphate, an AP substrate, and incubated for 20 min at 37°C. Reactions were terminated by the addition of 0.5 N NaOH to the mixture, and absorbance was measured at a wavelength of 405 nm.
Determination of intracellular trypsin activation
Intracellular trypsin activity was measured using the cell‐permeable synthetic substrate rhodamine 110–(CBZ‐Ile‐Pro‐Arg)2, as described before 32. Isolated pancreatic acini were stimulated with or without the high concentration of 10 nM CCK8 for 60 min at 37°C. The cells were then washed in a solution containing (mM) 5 HEPES, 150 NaCl, 2 EDTA (pH 7.4), and 10 μM substrate. The cells were incubated in the same solution but without substrate for an additional 20 min to allow complete substrate hydrolysis. Bright field and fluorescence images were captured, and results were analyzed by counting the number of fluorescent cells.
Co‐immunoprecipitation
Co‐immunoprecipitation (Co‐IP) and Western blot analysis were as described in 48. Briefly, the tissues (pancreas, submandibular, and parotid glands) were isolated from three wild‐type and three Trpml1 −/− mice. The tissues in solution A were minced finely. The minced tissues were washed three times in PBS and then homogenized in glass homogenizer on ice in 1 ml of RIPA buffer containing protease inhibitors. The homogenate was centrifuged at 14,000× g in Eppendorf tubes. The supernatant was collected and was used for Co‐IP, with 100 μl of lysates containing the same amount of protein for all the samples that were incubated with 50 μl of Protein G Sepharose beads for 2 h to pre‐clear the lysates. The lysates were centrifuged, and the beads were discarded. The cleared lysates were incubated with 1 μl Lamp1 antibody (0.1 mg/ml) overnight at 4°C, and then, 50 μl of Protein G Sepharose beads were added and the incubation continued for 4 h at 4°C. Then, the beads were washed four times with RIPA buffer containing protease inhibitors and proteins were released by incubation at 95°C for 20 min with 60 μl of Laemmli's buffer containing β‐mercaptoethanol. Samples (20 μl) were run in a denaturing gradient gel (4–12%) and blotted for Rab27b (1:500, BD biosciences) and VAMP8 (1:500, Sigma). The samples were also blotted for β‐actin for normalizing the protein loads.
Recording mEPSC from brain slices
Horizontal brain slices (300 μm) that include the hippocampus, subiculum, and entorhinal cortex were cut using a vibrating blade microtome from 5‐week‐old wild‐type and Trpml1 −/− littermates. Mice deeply anesthetized with isoflurane were decapitated, and their brains were dissected out in ice‐cold solution containing (in mM) 95 NaCl, 25 NaHCO3, 25 glucose, 50 sucrose, 2.5 KCl, 1.25 NaH2PO4, 0.1 CaCl2, 3 MgCl2, 0.4 ascorbic acid, 3 myo‐inositol, and 2 Na+ pyruvate and aerated with 95% O2/5% CO2. Slices were incubated for 30 min at 37°C and then held at room temperature (22–24°C) for experiments in a solution containing (in mM) the following: 125 NaCl, 2.5 KCl, 1 MgCl2, 2 CaCl2, 25 glucose, 1.25 NaH2PO4, 0.4 ascorbic acid, 3 myo‐inositol, 2 Na+ pyruvate, 25 NaHCO3, 0.001 TTX (to prevent action potentials), pH 7.4 and bubbled with 95% O2/5% CO2. Bicuculline (10 μM) was included in the bath solution to block GABAA receptors. When KCl concentration was increased (30 mM), NaCl concentration was decreased to maintain osmolarity.
For recordings mEPSCs, the pipette (2–4 MΩ) contained (in mM) the following: 125 K‐gluconate, 20 KCl, 4 MgATP, 10 sodium‐phosphocreatine, 0.3 GTP, 10 HEPES, and 0.5 EGTA, pH 7.2, adjusted with KOH. Whole‐cell patch‐clamp recording was accomplished using an EPC‐10 amplifier (HEKA) in voltage‐clamp mode (holding potential −80 mV) from hippocampal slices. Neurons in the slices were visually identified with infrared video microscopy and differential interference contrast optics. Miniature AMPA EPSCs (mEPSCs) were recorded from dentate gyrus granule cells. Data were filtered at 2 kHz, digitized at 10 kHz, acquired online and analyzed off‐line. The recorded mEPSCs were analyzed using Clampfit 10.
Measurement of glutamate release
Glutamate levels were detected using an enzymatic assay 49, 50, 51. In the presence of glutamate, L‐glutamic dehydrogenase (GDH) reduces 13‐nicotinamide adenine dinucleotide (NAD+) to NADH, a product that fluoresces when excited with UV light. Provided that GDH and NAD+ are added to the saline in which neurons were bathed, any glutamate released in the medium can be detected as an increase in NADH fluorescence around secreted neurons. Neurons on coverslips were subsequently mounted in an open bath chamber (RP‐40LP, Warner Instruments, Hamden, CT) on the stage of an inverted microscope Nikon Eclipse TiE (Nikon Inc, Melville, NY). The microscope is equipped with a Perfect Focus System and a Photometrics CoolSnap HQ2 CCD camera. During the experiments, the Perfect Focus System was activated. The neurons were pre‐incubated with 1 mM NADP+ and 50 units of glutamate dehydrogenase for 5 min. All the experiments were performed at room temperature (20–23°C). The fluorescence (excitation at 340 nm and emission at 460 nm) was acquired and analyzed using NIS‐Elements AR software (Nikon Inc.). For rescue experiments, neurons in primary culture were transfected either with RFP and empty vector or with RFP + HA‐TRPML1 using Turbofectin 8. After 48 h, transfected neurons were identified fluorometrically by the red color and glutamate release was analyzed in Trpml1 −/− neurons transfected with RFP alone of RFP and TRPML1.
Immunofluorescence
Isolated acini were fixed with 4% paraformaldehyde for 15 min and permeabilized with a mixture of 0.3% saponin and 0.2% Triton X‐100 in phosphate‐buffered saline for 15 min at room temperature. After incubation in blocking solution containing 5% goat serum, cells were stained by incubation with anti‐ceramide (1:50) overnight. The following day, each sample was probed with FITC‐conjugated secondary antibodies. Images were collected using a confocal microscope and analyzed using MetaMorph software. Staining for amylase, Rab5, Rab6, and LAMP1 was by incubation with polyclonal anti‐amylase (1:100), anti‐Rab5 (1:100), anti‐Rab6 (1:100), and anti‐LAMP1 (1:250) antibodies overnight and probing with FITC‐conjugated secondary antibodies. Actin was visualized by incubation with 10 μM phalloidin for 20 min at RT. All overlaps were analyzed using ImageJ and particle counting as outlined in the program instructions. In brief, using Photoshop, the green and red images were converted to gray, flattened, and the background adjusted. The images were then opened in ImageJ, which generates an RGB image and a B&W image with the colocalization. To calculate the area of the image occupied by the overlap, a threshold is set after which a binary image is obtained in which the overlap signal is displayed. The analyze particles function of the program is then used to obtain the number of particles and the overlap as percentage of the total image.
For visualizing lysosomes and mitochondria in live cells, pancreatic acini were incubated for 6 min with 1 μM each of mitotracker and lysotracker at 37°C and immediately imaged or kept on ice in the same medium for use within 30 min. Staining of parotid acini was much more intense and less clustered at the apical pole. Test of several conditions showed that the clearest results were obtained when parotid acini were incubated for 30 min with 0.5 μM lysotracker and 0.5 μM mitotracker at 37°C in a shaking water bath. The acini were washed twice with ice‐cold PBS, and confocal images were collected at RT.
Electron microscopy
All tissue samples were cut into 1–3 mm cubes, fixed for 48 h at 4°C in 2% glutaraldehyde in 0.1 M cacodylate buffer (pH 7.4), and washed with cacodylate buffer three times. The tissues were fixed with 2% OsO4 for 2 h, washed again with 0.1 M cacodylate buffer three times, washed with water, and placed in 1% uranyl acetate for 1 h. The tissues were subsequently serially dehydrated in ethanol and propylene oxide and embedded in EMBed 812 resin (Electron Microscopy Sciences, Hatfield, PA, USA). Thin sections, approximately 80 nm, were obtained by utilizing the Leica ultracut‐UCT ultramicrotome (Leica, Deerfield, IL, USA) and placed onto 300 mesh copper grids and stained with saturated uranyl acetate in 50% methanol and then with lead citrate. The grids were viewed in the JEM‐1200EXII electron microscope (JEOL Ltd, Tokyo, Japan) at 80 kV, and images were recorded on the XR611M, mid‐mounted, 10.5M pixel, CCD camera (Advanced Microscopy Techniques Corp, Danvers, MA, USA).
Statistics
All experiments were repeated at least three times, and the results are given as means ± s.e.m. Differences between the groups were analyzed for statistical significance by arc‐sin transformation for percentage and overlap results and calculated t‐test assuming equal variances. Square‐root transformation was used for granule and synaptosomal size differences, and t‐tests were performed assuming unequal variances. Comparisons between more than two groups (Fig 3) and the time course were analyzed by the t‐test, and the resulting P‐values were then corrected for multiple testing using the Holm–Bonferroni method (52, 53). For time courses and concentration dependencies, pairwise comparisons of the effect least squares means using Student's t‐tests with no multiplicity adjustment were performed and the P‐values were then subjected to Holm–Bonferroni corrections. All transformations and statistical analysis were with JMP software. Differences between two groups were analyzed by unpaired t‐test. In all cases, P < 0.05 or better was considered statistically significant.
Author contributions
SP, MA, MSK, GCB, AJ, MZ, MB, and PMZ performed and analyzed the experiments; CAW and FDP provided essential material; MAE, EB, LGW, DMS, and SM designed and directed the studies; and SM drafted the manuscript with input from all authors.
Conflict of interest
The authors declare that they have no conflict of interest.
Supporting information
Expanded View Figures PDF
Source Data for Expanded View
Review Process File
Source Data for Figure 2
Source Data for Figure 5
Acknowledgements
This work was supported in part by National Institutes of Health Grants HL090804 to E.B., P30DA013429 to the Center for Substance Abuse Research, Temple University (E.B.), NIH/NIDCR intramural grant DE000735 to S.M., the Intramural Research Program of NICHD to F.D.P., grant NRF‐2013K2A1A2049748 under the framework of international cooperation program managed by National Research Foundation of Korea (NRF), and by NRF grants funded by the Korea Government (NRF‐2007‐0056419, NRF‐2015R1A2A1A15054157, and NRF‐2012R1A1A1038381).
EMBO Reports (2016) 17: 266–278
References
- 1. Bach G (2001) Mucolipidosis type IV. Mol Genet Metab 73: 197–203 [DOI] [PubMed] [Google Scholar]
- 2. Bargal R, Avidan N, Ben‐Asher E, Olender Z, Zeigler M, Frumkin A, Raas‐Rothschild A, Glusman G, Lancet D, Bach G (2000) Identification of the gene causing mucolipidosis type IV. Nat Genet 26: 118–123 [DOI] [PubMed] [Google Scholar]
- 3. Kiselyov K, Colletti GA, Terwilliger A, Ketchum K, Lyons CW, Quinn J, Muallem S (2011) TRPML: transporters of metals in lysosomes essential for cell survival? Cell Calcium 50: 288–294 [DOI] [PMC free article] [PubMed] [Google Scholar]
- 4. Dong XP, Shen D, Wang X, Dawson T, Li X, Zhang Q, Cheng X, Zhang Y, Weisman LS, Delling M et al (2010) PI(3,5)P(2) controls membrane trafficking by direct activation of mucolipin Ca(2+) release channels in the endolysosome. Nat Commun 1: 38 [DOI] [PMC free article] [PubMed] [Google Scholar]
- 5. Soyombo AA, Tjon‐Kon‐Sang S, Rbaibi Y, Bashllari E, Bisceglia J, Muallem S, Kiselyov K (2006) TRP‐ML1 regulates lysosomal pH and acidic lysosomal lipid hydrolytic activity. J Biol Chem 281: 7294–7301 [DOI] [PubMed] [Google Scholar]
- 6. Miedel MT, Rbaibi Y, Guerriero CJ, Colletti G, Weixel KM, Weisz OA, Kiselyov K (2008) Membrane traffic and turnover in TRP‐ML1‐deficient cells: a revised model for mucolipidosis type IV pathogenesis. J Exp Med 205: 1477–1490 [DOI] [PMC free article] [PubMed] [Google Scholar]
- 7. Shen D, Wang X, Li X, Zhang X, Yao Z, Dibble S, Dong XP, Yu T, Lieberman AP, Showalter HD et al (2012) Lipid storage disorders block lysosomal trafficking by inhibiting a TRP channel and lysosomal calcium release. Nat Commun 3: 731 [DOI] [PMC free article] [PubMed] [Google Scholar]
- 8. Kohn G, Livni N, Ornoy A, Sekeles E, Beyth Y, Legum C, Bach G, Cohen MM (1977) Prenatal diagnosis of mucolipidosis IV by electron microscopy. J Pediatr 90: 62–66 [DOI] [PubMed] [Google Scholar]
- 9. Bargal R, Goebel HH, Latta E, Bach G (2002) Mucolipidosis IV: novel mutation and diverse ultrastructural spectrum in the skin. Neuropediatrics 33: 199–202 [DOI] [PubMed] [Google Scholar]
- 10. Bargal R, Bach G (1989) Phosphatidylcholine storage in mucolipidosis IV. Clin Chim Acta 181: 167–174 [DOI] [PubMed] [Google Scholar]
- 11. Bach G, Ziegler M, Kohn G, Cohen MM (1977) Mucopolysaccharide accumulation in cultured skin fibroblasts derived from patients with mucolipidosis IV. Am J Hum Genet 29: 610–618 [PMC free article] [PubMed] [Google Scholar]
- 12. Chen CS, Bach G, Pagano RE (1998) Abnormal transport along the lysosomal pathway in mucolipidosis, type IV disease. Proc Natl Acad Sci USA 95: 6373–6378 [DOI] [PMC free article] [PubMed] [Google Scholar]
- 13. LaPlante JM, Sun M, Falardeau J, Dai D, Brown EM, Slaugenhaupt SA, Vassilev PM (2006) Lysosomal exocytosis is impaired in mucolipidosis type IV. Mol Genet Metab 89: 339–348 [DOI] [PubMed] [Google Scholar]
- 14. Samie M, Wang X, Zhang X, Goschka A, Li X, Cheng X, Gregg E, Azar M, Zhuo Y, Garrity AG et al (2013) A TRP channel in the lysosome regulates large particle phagocytosis via focal exocytosis. Dev Cell 26: 511–524 [DOI] [PMC free article] [PubMed] [Google Scholar]
- 15. Cheng X, Zhang X, Gao Q, Ali Samie M, Azar M, Tsang WL, Dong L, Sahoo N, Li X, Zhuo Y et al (2014) The intracellular Ca(2)(+) channel MCOLN1 is required for sarcolemma repair to prevent muscular dystrophy. Nat Med 20: 1187–1192 [DOI] [PMC free article] [PubMed] [Google Scholar]
- 16. Cheng X, Shen D, Samie M, Xu H (2010) Mucolipins: intracellular TRPML1‐3 channels. FEBS Lett 584: 2013–2021 [DOI] [PMC free article] [PubMed] [Google Scholar]
- 17. Venkatachalam K, Long AA, Elsaesser R, Nikolaeva D, Broadie K, Montell C (2008) Motor deficit in a Drosophila model of mucolipidosis type IV due to defective clearance of apoptotic cells. Cell 135: 838–851 [DOI] [PMC free article] [PubMed] [Google Scholar]
- 18. Williams JA (2008) Receptor‐mediated signal transduction pathways and the regulation of pancreatic acinar cell function. Curr Opin Gastroenterol 24: 573–579 [DOI] [PubMed] [Google Scholar]
- 19. Yamaguchi S, Jha A, Li Q, Soyombo AA, Dickinson GD, Churamani D, Brailoiu E, Patel S, Muallem S (2011) Transient receptor potential mucolipin 1 (TRPML1) and two‐pore channels are functionally independent organellar ion channels. J Biol Chem 286: 22934–22942 [DOI] [PMC free article] [PubMed] [Google Scholar]
- 20. Gerasimenko JV, Charlesworth RM, Sherwood MW, Ferdek PE, Mikoshiba K, Parrington J, Petersen OH, Gerasimenko OV (2015) Both RyRs and TPCs are required for NAADP‐induced intracellular Ca release. Cell Calcium 58: 237–245 [DOI] [PMC free article] [PubMed] [Google Scholar]
- 21. Pandol SJ, Schoeffield MS, Sachs G, Muallem S (1985) Role of free cytosolic calcium in secretagogue‐stimulated amylase release from dispersed acini from guinea pig pancreas. J Biol Chem 260: 10081–10086 [PubMed] [Google Scholar]
- 22. Muallem S, Kwiatkowska K, Xu X, Yin HL (1995) Actin filament disassembly is a sufficient final trigger for exocytosis in nonexcitable cells. J Cell Biol 128: 589–598 [DOI] [PMC free article] [PubMed] [Google Scholar]
- 23. Messenger SW, Thomas DD, Falkowski MA, Byrne JA, Gorelick FS, Groblewski GE (2013) Tumor protein D52 controls trafficking of an apical endolysosomal secretory pathway in pancreatic acinar cells. Am J Physiol Gastrointest Liver Physiol 305: G439–G452 [DOI] [PMC free article] [PubMed] [Google Scholar]
- 24. Messenger SW, Falkowski MA, Groblewski GE (2014) Ca(2)(+)‐regulated secretory granule exocytosis in pancreatic and parotid acinar cells. Cell Calcium 55: 369–375 [DOI] [PMC free article] [PubMed] [Google Scholar]
- 25. Chen X, Li C, Izumi T, Ernst SA, Andrews PC, Williams JA (2004) Rab27b localizes to zymogen granules and regulates pancreatic acinar exocytosis. Biochem Biophys Res Commun 323: 1157–1162 [DOI] [PubMed] [Google Scholar]
- 26. Sah RP, Garg P, Saluja AK (2012) Pathogenic mechanisms of acute pancreatitis. Curr Opin Gastroenterol 28: 507–515 [DOI] [PMC free article] [PubMed] [Google Scholar]
- 27. Lerch MM, Gorelick FS (2013) Models of acute and chronic pancreatitis. Gastroenterology 144: 1180–1193 [DOI] [PubMed] [Google Scholar]
- 28. Lee MG, Ohana E, Park HW, Yang D, Muallem S (2012) Molecular mechanism of pancreatic and salivary gland fluid and HCO3 secretion. Physiol Rev 92: 39–74 [DOI] [PMC free article] [PubMed] [Google Scholar]
- 29. Fujita‐Yoshigaki J, Dohke Y, Hara‐Yokoyama M, Furuyama S, Sugiya H (1998) Snare proteins essential for cyclic AMP‐regulated exocytosis in salivary glands. Eur J Morphol 36(Suppl): 46–49 [PubMed] [Google Scholar]
- 30. Shimomura H, Imai A, Nashida T (2004) Evidence for the involvement of cAMP‐GEF (Epac) pathway in amylase release from the rat parotid gland. Arch Biochem Biophys 431: 124–128 [DOI] [PubMed] [Google Scholar]
- 31. Wu CY, DiJulio DH, Jacobson KL, McKnight GS, Watson EL (2010) The contribution of AKAP5 in amylase secretion from mouse parotid acini. Am J Physiol Cell Physiol 298: C1151–C1158 [DOI] [PMC free article] [PubMed] [Google Scholar]
- 32. Kim MS, Lee KP, Yang D, Shin DM, Abramowitz J, Kiyonaka S, Birnbaumer L, Mori Y, Muallem S (2011) Genetic and pharmacologic inhibition of the Ca2+ influx channel TRPC3 protects secretory epithelia from Ca2+‐dependent toxicity. Gastroenterology 140: 2107–2115. e1‐4 [DOI] [PMC free article] [PubMed] [Google Scholar]
- 33. He L, Xue L, Xu J, McNeil BD, Bai L, Melicoff E, Adachi R, Wu LG (2009) Compound vesicle fusion increases quantal size and potentiates synaptic transmission. Nature 459: 93–97 [DOI] [PMC free article] [PubMed] [Google Scholar]
- 34. Kemp JA, McKernan RM (2002) NMDA receptor pathways as drug targets. Nat Neurosci 5(Suppl): 1039–1042 [DOI] [PubMed] [Google Scholar]
- 35. Khatri N, Man HY (2013) Synaptic activity and bioenergy homeostasis: implications in brain trauma and neurodegenerative diseases. Front Neurol 4: 199 [DOI] [PMC free article] [PubMed] [Google Scholar]
- 36. Galluzzi L, Pietrocola F, Levine B, Kroemer G (2014) Metabolic control of autophagy. Cell 159: 1263–1276 [DOI] [PMC free article] [PubMed] [Google Scholar]
- 37. Li X, Garrity AG, Xu H (2013) Regulation of membrane trafficking by signalling on endosomal and lysosomal membranes. J Physiol 591: 4389–4401 [DOI] [PMC free article] [PubMed] [Google Scholar]
- 38. Colvin RA, Means TK, Diefenbach TJ, Moita LF, Friday RP, Sever S, Campanella GS, Abrazinski T, Manice LA, Moita C et al (2010) Synaptotagmin‐mediated vesicle fusion regulates cell migration. Nat Immunol 11: 495–502 [DOI] [PMC free article] [PubMed] [Google Scholar]
- 39. Castle JD (1990) Sorting and secretory pathways in exocrine cells. Am J Respir Cell Mol Biol 2: 119–126 [DOI] [PubMed] [Google Scholar]
- 40. Castle JD, Castle AM (1996) Two regulated secretory pathways for newly synthesized parotid salivary proteins are distinguished by doses of secretagogues. J Cell Sci 109(Pt 10): 2591–2599 [DOI] [PubMed] [Google Scholar]
- 41. Huang AY, Castle AM, Hinton BT, Castle JD (2001) Resting (basal) secretion of proteins is provided by the minor regulated and constitutive‐like pathways and not granule exocytosis in parotid acinar cells. J Biol Chem 276: 22296–22306 [DOI] [PubMed] [Google Scholar]
- 42. Schwake M, Schroder B, Saftig P (2013) Lysosomal membrane proteins and their central role in physiology. Traffic 14: 739–748 [DOI] [PubMed] [Google Scholar]
- 43. Chandra M, Zhou H, Li Q, Muallem S, Hofmann SL, Soyombo AA (2011) A role for the Ca2+ channel TRPML1 in gastric acid secretion, based on analysis of knockout mice. Gastroenterology 140: 857–867 [DOI] [PMC free article] [PubMed] [Google Scholar]
- 44. Porter FD, Scherrer DE, Lanier MH, Langmade SJ, Molugu V, Gale SE, Olzeski D, Sidhu R, Dietzen DJ, Fu R et al (2010) Cholesterol oxidation products are sensitive and specific blood‐based biomarkers for Niemann‐Pick C1 disease. Sci Transl Med 2: 56ra81 [DOI] [PMC free article] [PubMed] [Google Scholar]
- 45. Kim MS, Hong JH, Li Q, Shin DM, Abramowitz J, Birnbaumer L, Muallem S (2009) Deletion of TRPC3 in mice reduces store‐operated Ca2+ influx and the severity of acute pancreatitis. Gastroenterology 137: 1509–1517 [DOI] [PMC free article] [PubMed] [Google Scholar]
- 46. Brailoiu GC, Benamar K, Arterburn JB, Gao E, Rabinowitz JE, Koch WJ, Brailoiu E (2013) Aldosterone increases cardiac vagal tone via GPER activation. J Physiol 591: 4223–4235 [DOI] [PMC free article] [PubMed] [Google Scholar]
- 47. Schoniger S, Wehming S, Gonzalez C, Schobitz K, Rodriguez E, Oksche A, Yulis CR, Nurnberger F (2001) The dispersed cell culture as model for functional studies of the subcommissural organ: preparation and characterization of the culture system. J Neurosci Methods 107: 47–61 [DOI] [PubMed] [Google Scholar]
- 48. Jha A, Ahuja M, Maleth J, Moreno CM, Yuan JP, Kim MS, Muallem S (2013) The STIM1 CTID domain determines access of SARAF to SOAR to regulate Orai1 channel function. J Cell Biol 202: 71–79 [DOI] [PMC free article] [PubMed] [Google Scholar]
- 49. Duarte CB, Santos PF, Sanchez‐Prieto J, Carvalho AP (1996) On‐line detection of glutamate release from cultured chick retinospheroids. Vision Res 36: 1867–1872 [DOI] [PubMed] [Google Scholar]
- 50. Ayoub GS, Dorst K (1998) Imaging of glutamate release from the goldfish retinal slice. Vision Res 38: 2909–2912 [DOI] [PubMed] [Google Scholar]
- 51. Innocenti B, Parpura V, Haydon PG (2000) Imaging extracellular waves of glutamate during calcium signaling in cultured astrocytes. J Neurosci 20: 1800–1808 [DOI] [PMC free article] [PubMed] [Google Scholar]
- 52. Holm S (1979) A simple sequentially rejective multiple test procedure. Scand J Stat 6: 65–70 [Google Scholar]
- 53. Gaetano J (2013) Holm‐Bonferroni sequential correction: an EXCEL calculator. Retrieved from https://www.researchgate.net/publication/236969037_Holm-Bonferroni_Sequential_Correction_An_EXCEL_Calculator. doi: 10.13140/RG.2.1.4466.9927
Associated Data
This section collects any data citations, data availability statements, or supplementary materials included in this article.
Supplementary Materials
Expanded View Figures PDF
Source Data for Expanded View
Review Process File
Source Data for Figure 2
Source Data for Figure 5