

Abstract
Background: Pancreatic cancer is one of the cancers where anti-PD-L1/PD-1 immunotherapy has been unsuccessful. What confers pancreatic cancer resistance to checkpoint immunotherapy is unknown. The aim of this study is to elucidate the underlying mechanism of PD-L1 expression regulation in the context of pancreatic cancer immune evasion.
Methods: Pancreatic cancer mouse models and human specimens were used to determine PD-L1 and PD-1 expression and cancer immune evasion. Histone methyltransferase inhibitors, RNAi, and overexpression were used to elucidate the underlying molecular mechanism of PD-L1 expression regulation. All statistical tests were two-sided.
Results: PD-L1 is expressed in 60% to 90% of tumor cells in human pancreatic carcinomas and in nine of 10 human pancreatic cancer cell lines. PD-1 is expressed in 51.2% to 52.1% of pancreatic tumor–infiltrating cytotoxic T lymphocytes (CTLs). Tumors grow statistically significantly faster in FasL-deficient mice than in wild-type mice (P = .03–.001) and when CTLs are neutralized (P = .03–<.001). H3K4 trimethylation (H3K4me3) is enriched in the cd274 promoter in pancreatic tumor cells. MLL1 directly binds to the cd274 promoter to catalyze H3K4me3 to activate PD-L1 transcription in tumor cells. Inhibition or silencing of MLL1 decreases the H3K4me3 level in the cd274 promoter and PD-L1 expression in tumor cells. Accordingly, inhibition of MLL1 in combination with anti-PD-L1 or anti-PD-1 antibody immunotherapy effectively suppresses pancreatic tumor growth in a FasL- and CTL-dependent manner.
Conclusions: The Fas-FasL/CTLs and the MLL1-H3K4me3-PD-L1 axis play contrasting roles in pancreatic cancer immune surveillance and evasion. Targeting the MLL1-H3K4me3 axis is an effective approach to enhance the efficacy of checkpoint immunotherapy against pancreatic cancer.
PD-1 is a T cell inhibitory receptor that interacts with its ligand PD-L1 to maintain self-tolerance and to protect against excessive tissue damage induced by immune responses, and thus functions as an immune checkpoint under physiological conditions (1). Under pathological conditions such as cancer, PD-L1 is often upregulated in tumor cells, resulting in potent immune suppression and tumor immune escape (2–8). Accordingly, blocking the interactions between PD-1 and PD-L1 can induce durable efficacy of tumor suppression in both mouse tumor models and human cancer patients (9–13). However, human pancreatic cancer stands out as one cancer that does not respond to checkpoint immunotherapy (14). The mechanism underlying pancreatic cancer resistance to anti-PD-1/PD-L1 immunotherapy is unknown, but it has been suggested that the expression level of PD-L1 in tumor cells is a key determinant of checkpoint immunotherapy efficacy (9,15,16)
PD-L1 is constitutively expressed and induced by inflammatory cytokines in the tumor microenvironment in human cancers (15,17,18). It has been reported that oncogenes such as AKT and STAT3 directly regulate constitutive PD-L1 expression in tumor cells (19,20). IFNγ is a proinflammatory cytokine secreted by activated T and natural killer (NK) cells and acts as an essential component of the host cancer immune surveillance system (21,22). However, IFNγ also acts as a master inducer of PD-L1 in tumor cells (16–18,23), suggesting that tumor cells may sense the elevated IFNγ as a “threat” in the tumor microenvironment and adapt it by upregulating PD-L1. These studies firmly established the role of oncogenes and inflammatory cytokines as key regulators of PD-L1 expression in tumor cells. We aimed at testing the hypothesis that PD-L1 expression is regulated by an epigenetic mechanism in pancreatic cancer and epigenetic targeting of PD-L1 is an effective approach to enhance the efficacy of checkpoint immunotherapy for pancreatic cancer.
Methods
Cancer Cells
Pancreatic, colon, and melanoma cancer cell lines were obtained from American Type Culture Collection (ATCC; Manassas, VA). ATCC has characterized these cells by morphology, immunology, DNA fingerprint, and cytogenetics. PANC02-H7 cells were kindly provided by Dr. Min Li (University of Oklahoma Health Sciences Center) and characterized as previously described (24,25). UN-KC-6141 cells were kindly provided by Dr. Surinder Batra (University of Nebraska Medical Center) and characterized as previously described (26). Human pancreatic cancer specimens were obtained from the Georgia Cancer Center tumor bank and from the Cooperative Human Tissue Network (CHTN) Southern Division. The tumor tissue specimens were analyzed by a board-certified pathologist.
Orthotopic Mouse Pancreatic Cancer Models
Six- to eight-week-old female WT C57BL/6 and faslgld mice were obtained from the Jackson Laboratory (Bar Harbor, ME). Mice were continuously anesthetized with isoflurane (1%–3% in oxygen). A small abdominal incision at the right side near the spleen was made, and the pancreas was identified with sterile gauze. Tumor cells (1x10⁴ cells in 20 μL saline) were injected into the pancreas using a sterile tuberculin syringe. The abdomen was closed with wound clips. All mouse studies were performed according to protocols approved by Augusta University Institutional Animal Care and Use Committee.
Statistical Analysis
All statistical analysis was performed using SAS 9.4 (SAS Institute Inc., Cary, NC), and statistical significance was assessed using an alpha level of .05. Two-factor ANOVA was used to examine the interaction of treatments on tumor weight and volume within tumor cell type. A Tukey-Kramer multiple comparison procedure on the means of the interaction term was used to examine pair-wise post hoc differences between groups to control the overall statistical significance level. Two-sample t tests were used to determine differences in tumor weight and tumor volume between control and treatment groups or between WT C57BL/6 and faslgld mice. All statistical tests were two-sided.
Additional methods are included in the Supplementary Methods and Supplementary Tables 1 and 2 (available online).
Results
PD-L1 and PD-1 Expression Profiles in Pancreatic Tumor Cells and Pancreatic Tumor-Infiltrating Cytotoxic T Lymphocytes
To determine the expression profiles of PD-L1 and PD-1 in tumor-bearing mice, two orthotopic pancreatic carcinoma mouse models were established (Figure 1, A and E). Both PANC02-H7 and UN-KC-6141 cells express PD-L1 in vitro, and the orthotopic tumor cells express statistically significantly higher levels of PD-L1 in in vivo than in in vitro cultured tumor cells (P < .001) (Figure 1, B and F). An average of 51.2% and 52.1% of tumor-infiltrating CD8+ cytotoxic T lymphocytes (CTLs) are PD-1+ in PANC02-H7 and UN-KC-6141 tumors, respectively (Figure 1, C, D, G, and H). An average of 6.82%, 4.16% and 3.76% CD8+ T cells in the spleen, lymph nodes (LNs), and peripheral blood, respectively, from the PANC02-H7 tumor-bearing mice are PD-1+. Similarly, an average of 6.58%, 4.11%, and 33.3% of CD8+ T cells in the spleen, LNs, and peripheral blood, respectively, from the UN-KC-6141 tumor-bearing mice are PD-1+ (Figure 1, C D, G, and H). These data indicate that pancreatic cancer cells express elevated PD-L1 in vivo and pancreatic tumor–infiltrating CTLs express high levels of PD-1 in vivo in the tumor microenvironment.
Figure 1.

PD-L1 and PD-1 expression profiles in pancreatic cancer in vivo. A) PANC02-H7 cells were surgically transplanted to pancreas of C57BL/6 mice to establish orthotopic pancreatic tumor (yellow arrow). B) PD-L1 expression level on cultured pancreatic cancer cells (in vitro) and the tumor (in vivo) as shown in (A). The PD-L1 protein level (mean fluorescent intensity [MFI]) was analyzed by two-sided t test and presented at the right. Column: mean; bar: SD. C) Cell suspensions were prepared from pancreatic tumor tissues, spleen, LN, and peripheral blood from five tumor-bearing mice (n = 5) and stained with 7-AAD, CD8-, and PD-1-specific antibodies. Stained cells were analyzed by flow cytometry. D) Quantification of CD8+PD-1+ CTLs in the indicated tissues. 7-AAD+ dead cells were gated out. CD8+ cells were gated and analyzed for PD-1+ cells. E) UN-KC-6141 cells were surgically transplanted to the pancreas of C57BL/6 mice to establish orthotopic pancreatic tumor (yellow arrow). F) PD-L1 expression levels in cultured UN-KC-6141 cells (in vitro) and orthotopic UN-KC-6141 tumor (in vivo). The PD-L1 protein level (MFI) was analyzed by two-sided t test and presented at the right. Column: mean; bar: SD. G) Analysis of CD8+PD-1+ cells in the UN-KC-6141 tumor model in the indicated tissues. H) Quantification of CD8+PD-1+ CTLs in the indicated tissues. 7-AAD = 7-aminoactinomycin D; LN = lymph node; MFI = mean fluorescent intensity.
MLL1-Mediated H3K4 Trimethylation in the CD274 Promoter Region and PD-L1 Expression
In a screening for epigenetic mechanisms that regulate PD-L1 expression in pancreatic cancer cells, we observed enrichment of H3K4me3 marks in the proximal cd274 promoter region in both human (Figure 2, A and B) and mouse (Figure 2, A and C) pancreatic cancer cells cultured in vitro. Chromatin immunoprecipitation (ChIP) analysis revealed that H3K4me3 levels are enriched in the proximal cd274 promoter region in both PANC02-H7 and UN-KC-6141 orthotopic tumors, whereas a minimal level of H3K4me3 was detected in the cd274 promoter region in normal pancreas in vivo (Figure 2D). The tumor cells exhibit the highest H4K4me3 level in a region upstream of the transcription initiation region (Figure 2, A–D). ChIP sequencing of chromatin fragments from normal pancreas and orthotopic PANC02-H7 and UN-KC-6141 tumor tissues revealed a cluster of H3K4me3 marks around the cd274 transcription start site, and H3K4me3 marks are enriched in the cd274 promoter region around -1000 to + 2000 in the tumor tissues (Figure 2E).
Figure 2.

Function of MLL1 in H3K4me3 regulation at the cd274 promoter and PD-L1 expression in tumor cells. A) The human CD274 (left panel) and mouse cd274 (right panel) gene promoter structures. B) Chromatin immunoprecipitation (ChIP) analysis of H3K4me3 levels in the CD274 promoter region in MiaPaca-2 cells. C) ChIP analysis of H3K4me3 levels in the cd274 promoter region in PANC02-H7 (left panel) and UN-KC-6141 (right panel) cells. D) ChIP analysis of H3K4me3 levels in the cd274 promoter region in normal mouse pancreatic tissues (left panel) and the orthotopic PANC02-H7 (middle panel) and UN-KC-6141 (right panel) tumor tissues, respectively. E) ChIP DNA fragments prepared as in (D) from normal mouse pancreas (n = 2: N1 and N2), the orthotopic PANC02-H7 tumors (n = 2: H1 and H2) and orthotopic UN-KC-6141 tumors (n = 2:U1 and U2) were cloned to construct DNA library and sequenced with a high-throughout sequencing system. The normalized sequence reads of H3K4me3 were mapped to cd274 gene region (-4000 of the 5’ regulatory region and the entire cd274 gene) on mouse chromosome 19 (left panel). The -4000 to + 1000 region relative to cd274 transcription start site (+1) is shown at the right panel. F) C57BL/6 mouse pancreas (n = 3) and tumor tissues from PNAC02-H7 tumor-bearing (n = 3) and UN-KC-6141 tumor-bearing (n = 3) mice were analyzed by real-time polymerase chain reaction (top panel) for MLL1 and PD-L1 transcript levels and by immunoblotting (bottom panel) for MLL1 protein level. G) ChIP analysis of MLL1 protein association with the cd274 promoter chromatin in PANC02-H7 cells (in vitro) and in orthotopic PANC02-H7 tumors (in vivo). H) MiaPaCa-2 cells were transiently transfected with scramble- and MLL1-specific siRNA, respectively, for 24 hours and analyzed for MLL1 mRNA level by quantitative polymerase chain reaction (qPCR), H3K4me3 level at the CD274 promoter region by ChIP (ChIP 4 as in (B)), and PD-L1 mRNA level by qPCR as indicated. I) PANC02-H7 cells were transiently transfected with scramble- and MLL1-specific siRNAs, respectively, for 24 hours and analyzed for MLL1 mRNA level by qPCR, H3K4me3 level in the cd274 promoter region by ChIP (ChIP 4 as in (C)), and PD-L1 mRNA level by qPCR as indicated. All statistical t tests were two-sided. ChIP = chromatin immunoprecipitation.
Analysis of histone methyltransferases (HMTase) revealed that MLL1, one of the H3K4 methylation-specific HMTases (27,28), is elevated in the orthotopic pancreatic tumor tissues both on the mRNA and the protein level (Figure 2F). PD-L1 is expressed in the normal pancreas tissues, albeit at a lower level (Figure 2F). PD-L1 transcript level is more elevated in the tumor cells than in the normal pancreatic tissues (Figure 2F). ChIP analysis revealed that MLL1 is directly associated with the cd274 promoter region in mouse pancreatic cancer cells in vitro and the orthotopic pancreatic tumor tissues in vivo (Figure 2G). Silencing MLL1 expression dramatically decreased H3K4me3 level in the CD274 promoter region (P = .03) and PD-L1 mRNA level (P = .001) in human pancreatic cancer cells (Figure 2H). Similarly, silencing MLL1 expression notably reduced the H3K4me3 level in the cd274 promoter region (P = .02) and statistically significantly downregulated the PD-L1 mRNA level (P = .002) in mouse pancreatic cancer cells (Figure 2I). PANC02-H7 cells were then transduced with scramble- and MLL1-specific shRNA-coding lentivirus, and stable cells were selected. MLL1-specific shRNA downregulated MLL1 mRNA and protein level in the tumor cells (Supplementary Figure 1A, available online). Again, silencing MLL1 expression statistically significantly reduced the H3K4me3 level in the cd274 promoter region (P = .004) and the PD-L1 expression level (P = 04) in the pancreatic cancer cells (Supplementary Figure 1A, available online). As a specificity control, an optimized mouse MLL1 full-length cDNA was made and cloned into a mammalian expression vector. This optimized MLL1-expressing plasmid was cotransfected with MLL1 siRNA to the tumor cells. Analysis of the optimized MLL1 mRNA using optimized MLL1 sequence-specific PCR primers indicates that it is resistant to WT MLL1-specific siRNA and that overexpression of this optimized MLL1 plasmid rescued WT MLL1 siRNA-mediated downregulation of PD-L1 as measured by PD-L1 mRNA level and protein level (Supplementary Figure 1, B and C, available online).
MLL1 and PD-L1 Expression Patterns in Human Pancreatic Cancer Tissues
Human pancreatic carcinoma specimens from 13 human pancreatic cancer patients were then analyzed by immunohistochemistry (IHC) using a human MLL1-specific antibody and a human PD-L1-specific antibody (29). Human tonsil and adrenal tumor tissues were used as positive controls. Epithelial cells surrounding the crypts in the tonsil tissue are PD-L1+ (Figure 3, A1a–c). Human adrenal tumor tissues exhibit two distinct PD-L1-staining patterns: 1) tumor cells with PD-L1 membrane staining and 2) tumor cells and leukocyte aggregate area with tumor cell membrane staining and both membrane and cytoplasmic staining in monocytes (Figure 3, A2a–c). Approximately 20% to 30% of tumor cells in one of the tumor specimens are MLL1-positive (Supplementary Figure 2, A4). The majority of tumor cells (60%–90%) express MLL1 in the resting 11 tumor specimens (Figure 3, B1 and C1; Supplementary Figure 2, A1–A11, available online). MLL1 protein is primarily localized in the nucleus of the tumor cells. PD-L1 protein was detected in approximately 60% to 90% of tumor cells in all 13 tumor specimens (Figure 3, B2 and C2; Supplementary Figure 2, B1–B11, available online). PDL1 protein was detected on the cell membrane and in the cytoplasms of almost all tumor cells. Consistent with the observation that PD-L1 protein is present in the majority of the tumor cells in all tumor specimens examined, flow cytometry analysis of 10 human pancreatic tumor cell lines revealed that nine of cell lines express high levels of PD-L1 (Figure 3B). All tumor cells uniformly express PD-L1, and almost all are PD-L1+ in nine of the 10 tumor cell lines (Figure 3C). Taken together, our data indicate that PD-L1 is uniformly expressed in murine and human pancreatic tumor cells cultured in vitro and is also abundantly expressed in orthotopic mouse pancreatic tumor cells and human pancreatic carcinoma cells in vivo. Analysis of mouse and human colon carcinoma and melanoma cells indicated that these two types of tumor cells are also uniformly PD-L1+, albeit at various levels (Supplementary Figure 3, A and B, available online).
Figure 3.

MLL1 and PD-L1 protein levels in human pancreatic carcinoma cells. A) Immunohistochemical staining of human tissues. A1a and b) Human tonsil tissues were stained with anti-PD-L1 antibody. Shown are low (A1a) and high magnification (A1b) images of the stained tonsil tissue. A1a) The yellow arrows indicate PD-L1+ cells, the black arrow points to crypts, and green arrows point to lymphoid cells. A1b) The yellow arrows indicate PD-L1+ epithelial cells surrounding the crypt. A1c) Negative staining without anti-PD-L1 antibody. A2a–c) Human adrenal tumor tissues were stained with anti-human PD-L1 antibody. Shown are low (A2a) and high magnification (A2b and c) images of the stained adrenal tumor tissue. A2a) The yellow arrow indicates tumor cells, and the black arrow indicates tumor cells and leukocytes aggregate area. A2b) The yellow arrow indicates PD-L1+ tumor cells. A2c) The yellow arrow indicates PD-L1+ tumor cells, and the black arrows point to PD-L1+ monocytes. B1a and b and C1a and b) Two human pancreatic adenocarcinoma specimens were stained with anti-MLL1 antibody. Shown are low (B1a and C1a) and high magnification (B1b and C1b) images of the stained tumor tissues. Red arrows indicate MLL1+ tumor cells. B2a and b and C2a and b) The two human pancreatic adenocarcinoma specimens as shown in (B1 and C1) were stained with anti-PD-L1 antibody. Shown are low (B2a and C2a) and high magnification (B2b and C2b) images of the stained tumor tissues. Yellow arrows indicate PD-L1+ tumor cells. Pink arrows in (B2b and C2b) indicate PD-L1 protein staining in both cell membrane and cytoplasm. MLL1- and PD-L1-specific staining is indicated by brown color, and nuclei were counterstained with hematoxylin in blue. B) Ten human pancreatic cancer cell lines were stained with IgG isotype control and PD-L1-specific monoclonal antibody, respectively, and analyzed for PD-L1 protein level by flow cytometry. C) Quantification of PD-L1 protein levels on human pancreatic cancer cell surface. The mean fluorescent intensity of PD-L1 protein as analyzed in (B) were quantified and presented. Column: mean; bar: SD. Scale bar (redline at the bottom left) = 50 μm.
MLL1 and PD-L1 Expression in Pancreatic Cancer Cells
We then made use of a recently identified HMTase inhibitor verticillin A that inhibits MLL1 (30). Verticillin A inhibits MLL1 activity with an IC50 of 0.8 μM (Supplementary Figure 4A, available online). However, verticillin A does not inhibit global H3K4 methylation in human and mouse pancreatic cancer cells (Supplementary Figure 4B, available online). Interestingly, verticillin A statistically significantly decreased the H3K4me3 level in the cd274 promoter region in a dose-dependent manner in pancreatic tumor cells in vitro (P = .02) (Figure 4A). Consistent with the decreased H3K4me3 levels in the cd274 promoter region, verticillin A dramatically decreased the PD-L1 mRNA level (P = .01) (Figure 4B) and the protein level (P = .007) (Figure 4C) in the tumor cells in vitro. Treatment of tumor-bearing mice with verticillin A also decreased the H3K4me3 level in the cd274 promoter region in the orthotopic tumor tissues (P = .04) (Figure 4D). PD-L1 mRNA level (P = .02) (Figure 4E) and protein level (P < .001) (Figure 4F) were also statistically significantly decreased in the orthotopic tumor tissues in vivo.
Figure 4.

Function of MLL1 in regulation of PD-L1 expression through H3K4me3. A) PANC02-H7 cells were treated with verticillin A at the indicated doses for two days and analyzed by chromatin immunoprecipitation (ChIP) for H3K4me3 level in the ChIP 4 region of the cd274 promoter region. B) The untreated and verticillin A–treated (50 nM) PANC02-H7 cells as shown in (A) were analyzed for PD-L1 mRNA levels by quantitative polymerase chain reaction (qPCR). C) The untreated and verticillin A–treated (50 nM) PANC02-H7 cells as shown in (A) were stained with PD-L1-specific monoclonal antibody (MAb) and analyzed by flow cytometry. PD-L1 protein mean fluorescent intensity (MFI) is presented at the right. D) PANC02-H7 tumor-bearing mice (n = 5) were treated with verticillin A at 0.5 mg/kg body weight once every two days for 10 days, and the tumor tissues were analyzed by ChIP for H3K4me3 level as in (A). The H3K4me3 level is normalized to input. E) The orthotopic PANC02-H7 tumor tissues from untreated and verticillin A–treated mice (n = 5) were analyzed for PD-L1 mRNA levels by qPCR. F) Tumor cells from untreated and verticillin A–treated mice were stained with PD-L1-specific MAb and analyzed by flow cytometry. PD-L1 protein MFI is presented at the right. All statistical t tests were two-sided. ChIP = chromatin immunoprecipitation; MFI = mean fluorescent intensity; qPCR = quantitative polymerase chain reaction.
Chaetocin is a potent HMTase inhibitor (31). Interestingly, chaetocin also exhibits potent inhibitory activity for MLL1 (Figure 5A). Treatment of human pancreatic cancer cells with chaetocin statistically significantly decreased the H3K4me3 level in the CD274 promoter region (P = .002) (Figure 5B). Consistent with decreased H3K4me3 level, PD-L1 protein level is statistically remarkably decreased in chaetocin-treated human pancreatic cancer cells (P < .001) (Figure 5C). Although chaetocin inhibits SUV39H1 and SUV39H2, HMTases that mediate H3K9me3 (31), the H3K9me3 level is low in the CD274 promoter region in human pancreatic cancer cells (Figure 5D). Conversely, overexpression of MLL1 increased MLL1 mRNA level, resulting in increased PD-L1 mRNA and protein levels in both PANC02-H7 and UN-KC-6141 cells (P < .01) (Supplementary Figure 5, available online).
Figure 5.
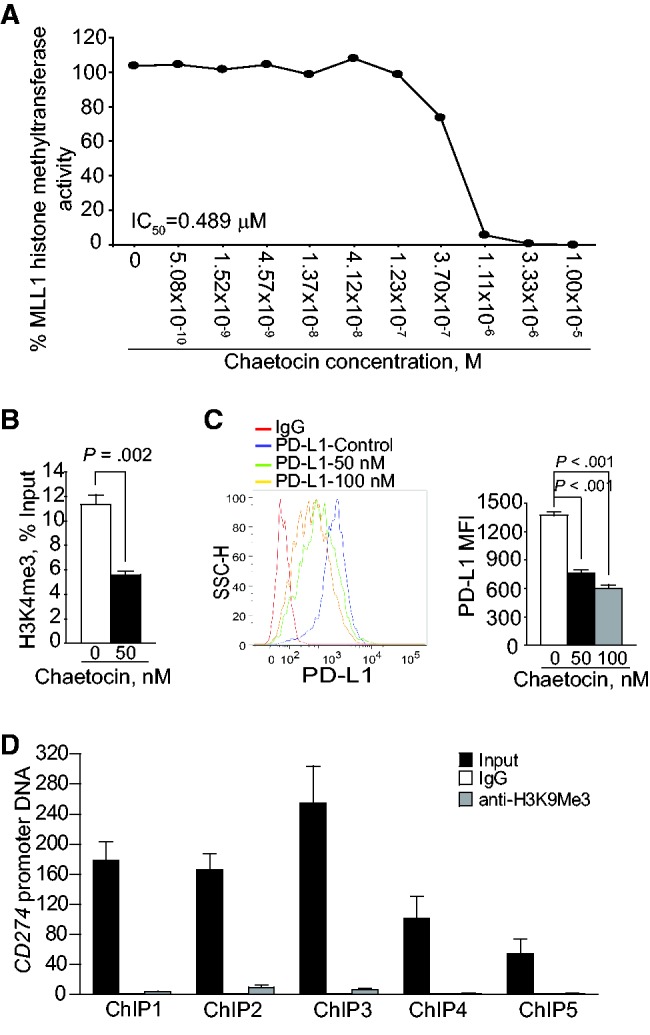
Function of MLL1 in regulation of H3K4me3 in the CD274 promoter and PD-L1 expression in human pancreatic cancer cells. A) Chaetocin is a potent MLL1 inhibitor. Chaetocin was tested in a 10-dose IC50 mode with threefold serial dilutions using 3H-S-adenosyl-methionine as substrate with MLL1 recombinant protein complex. The enzyme activity was then analyzed and plotted against chaetocin concentrations. IC50 was calculated using the Graphpad Prism program. B) PANC10.05 cells were treated with chaetocin (50 nM) for two days and analyzed with H3K4me3-specific monoclonal antibody (MAb) by chromatin immunoprecipitation (ChIP). The ChIP DNA was amplified using ChIP primer 4. The relative H3K4me3 level was normalized to input DNA and analyzed by two-sided t test. C) PANC10.05 cells were treated with chaetocin at the indicated doses for two days, stained with PD-L1-specific MAb, and analyzed by flow cytometry. The PD-L1 protein mean fluorescent intensity is presented at the right panel. Column: mean; bar: SD. D) H3K9me3 is not enriched in the CD274 promoter region in human pancreatic cancer cells. PANC10.05 cells were analyzed by ChIP with H3K9me3-specific MAb and polymerase chain reaction primers. All statistical t tests were two-sided. ChIP = chromatin immunoprecipitation; mAb = monoclonal antibody.
Role of FasL in Suppression of Pancreatic Tumor Growth In Vivo
The Fas-mediated apoptosis pathway plays a key role in host cancer immune surveillance against spontaneous B lymphoma and colon carcinoma (22,32). In addition to H3K4me3, verticillin A also targets H3K9me3 to increase Fas expression in human colon cancer cells (30). PANC02-H7 and UN-KC-6141 cells were then surgically transplanted to the pancreas of WT and faslgld mice. Analysis of tumor volume and tumor weight indicates that pancreatic tumors grew statistically dramatically faster in the faslgld mice than in the WT control mice in both tumor models (P = .03–.001) (Figure 6, A and E). Fas receptor is weakly expressed in both tumor cell lines in vitro, but is dramatically high in both orthotopic tumors in vivo (Figure 6, B and F). Analysis of tumor-infiltrating CTLs revealed that an average of 66.7% of tumor-infiltrating CTLs in the PANC02-H7 tumors and an average of 42.6% in the UN-KC-6141 tumors are FasL+ (Figure 6, C and G) in WT mice, whereas only a small fraction of CTLs in the spleen, LNs, and blood are FasL+ (Figure 6, C, D, G, and H). These observations suggest that the FasL of the host CTLs plays a key role in the suppression of pancreatic cancer development in vivo.
Figure 6.

Role of the Fas-FasL system in suppression of pancreatic tumor growth in vivo. A) PANC02-H7 cells were surgically transplanted to the pancreas of wild-type (WT) C57BL/6 (n = 5) and faslgld (n = 5) mice. Shown are the established pancreatic tumors 15 days after tumor transplant. The tumor volume and tumor weight were analyzed by two-sided t test and are presented in the right panels. B) The cultured PANC02-H7 cells and PANC02-H7 tumor tissues from WT mice were analyzed for cell surface Fas protein level by flow cytometry. C) Cells were prepared from the indicated tissues from tumor-bearing WT mice as shown in (A), stained with 7-AAD, CD8-, and FasL-specific monoclonal antibodies (MAbs), and analyzed by flow cytometry. The 7-AAD-CD8+ cells were gated and quantified for FasL+ cells. D) Quantification of % CD8+FasL+ cells as shown in (C). E) UN-KC-6141 cells were surgically transplanted to the pancreas of WT C57BL/6 (n = 5) and faslgld (n = 5) mice. Shown are the established tumors 15 days after tumor transplant. The tumor volume and tumor weight were analyzed by two-sided t test and are presented in the right panels. F) The cultured UN-KC-6141 cells and UN-KC-6141 tumor tissues from WT mice were analyzed for cell surface Fas protein level by flow cytometry. G) Cells were prepared from the indicated tissues from tumor-bearing WT mice as shown in (E), stained with 7-AAD, CD8-, and FasL-specific MAbs and analyzed by flow cytometry. The 7-AAD-CD8+ cells were gated and quantified for FasL+ cells. H) Quantification of % CD8+FasL+ cells as shown in (G). LN = lymph node; WT = wild-type.
Pharmacological Inhibition of HMTase and Anti-PD-L1 Immunotherapy Efficacy
We then reasoned that verticillin A downregulates PD-L1 expression to decrease the threshold of anti-PD-L1 MAb dose and thereby augments the efficacy of anti-PD-L1 immunotherapy. To test the hypothesis, PANC02-H7 and UN-KC-6141 tumor-bearing mice were treated with verticillin A and anti-PD-L1 MAb, either alone or in combination. Although verticillin A and anti-PD-L1 therapy alone suppressed tumor growth at the dose used, verticillin A statistically significantly increased the efficacy of anti-PD-L1 Mab in suppression of PANC02-H7 tumors as measured by tumor weight (P = .003–<.001) (Figure 7A). In the UN-KC-6141 tumor model, verticillin A and anti-PD-L1 exhibited additive effects in the suppression of tumor growth, and the combined treatment almost eradicated the established tumors (Figure 7B). At the functional level, verticillin A and anti-PD-L1 monotherapies decreased tumor cell proliferation and increased tumor cell apoptosis (Figure 7C). However, consistent with the greater degree of tumor growth inhibition, verticillin A statistically significantly increased the efficacy of anti-PD-L1 therapy in the suppression of tumor cell proliferation (P < .001) and in the induction of tumor cell apoptosis (P < .001) in vivo (Figure 7D). We also test the effects of verticillin A on the efficacy of anti-PD-1 immunotherapy in the UN-KC-6141 tumor model. Both verticillin A and anti-PD-1 MAb remarkably suppressed the established tumor growth (Supplementary Figure 6, A and B, available online). However, verticillin A further statistically significantly improved the efficacy of anti-PD-1 immunotherapy as measured by decreased tumor weight (P = .05) (Supplementary Figure 6, A and B, available online). Taken together, our data indicate that targeting MLL1 can effectively enhance the efficacy of anti-PD-L1/PD-1 immunotherapy to suppress pancreatic tumor growth in vivo as measured by tumor weight.
Figure 7.

Pharmacological inhibition of H3K4me3 and efficacy of anti-PD-L1 immunotherapy aganist pancreatic tumor growth in vivo. A) PANC02-H7 cells were surgically transplanted to wild-type (WT) mice. Five days later, tumor-bearing mice were randomly divided into four groups and treated with verticillin A (0.5 mg/kg body weight) and anti-PD-L1 (200 μg/mouse), either alone or in combination (n = 5) once every two days for 10 days. Shown are tumors of the different treated groups. Tumor volume and tumor weight were analyzed by two-sided t tests and are presented in the right panels. B) UN-KC-6141 cells were surgically transplanted to WT mice. Five days later, tumor-bearing mice were treated as in (A). Shown are tumors of the different treated groups. Tumor volume and tumor weight were analyzed by two-sided t tests and are presented in the right panels. C) The four groups of PANC02-H7 tumors as shown in (A) were sectioned and stained for Ki67 (left panel) and TUNEL (right panel). Shown are representative images of one of five tumors: a) control; b) verticillin A; c) anti-PD-L1 monoclonal antibody (MAb); d) verticillin A and anti-PD-L1 MAb. Scale bars in (C) are 20 μm, unless noted otherwise. D) Ki67+ (top panel) and TUNEL+ (bottom panel) cells in tumor tissues as shown in (C) were analyzed by two-sided t tests. Column: mean; bar: SD.
Verticillin A and Efficacy of Anti-PD-L1 Immunotherapy in FasL- and CTL-Deficient Tumor Microenvironment
To determine whether the greater tumor suppression efficacy of combined verticillin A and anti-PD-L1 immunotherapy depends on FasL and CTLs, PANC02-H7 cells were transplanted to pancreas of faslgld mice. The tumor-bearing mice were then treated with verticillin A and anti-PD-L1 MAb. Although combined verticillin A and anti-PD-L1 MAb also noticeably inhibited tumor growth (Figure 8, A and B), the degree of tumor growth suppression is statistically significantly higher in WT mice (Figure 7, A and B) than in the faslgld mice (P = .02–<.001) (Figure 8, A and B). To further determine the role of CTLs in pancreatic tumor growth and anti-PD-L1 immunotherapy efficacy, tumor-bearing mice were treated with a CD8+ T cell neutralization Mab, verticillin A + anti-PD-L1 MAb, or verticillin A + anti-PD-L1 Mab + CD8+ T cell neutralization Mab. Neutralizing CD8+ T cells markedly increased the growth rate of both PANC02-H7 and UN-KC-6141 tumors (P = .03–<.001) (Figure 8, C and D). Neutralizing CD8+ T cells also statistically significantly diminished the efficacy of combined verticillin A and anti-PD-L1 immunotherapy in PANC02-H7 and UN-KC-6141 tumor models as measured by tumor volume and weight (P = .37–.99) (Figure 8, C and D). Analysis of tumor tissues revealed that verticillin A further increased anti-PD-L1 Mab-induced CD8+ CTL tumor infiltration (P = .006–<.001) in both PANC02-H7 and UN-KC-6141 tumors and CTL activation as measured by IFNγ level in PANC02-H7 tumors (P = .02) in vivo (Figure 8, E and F). These observations suggest that pancreatic tumor growth control in vivo and anti-PD-L1 immunotherapy efficacy depend on FasL and CTLs.
Figure 8.

Roles of FasL and T cells in enhancement of verticillin A and anti-PD-L1 immunotherapy. A) PANC02-H7 cells were surgically transplanted to faslgld mice. Five days later, tumor-bearing mice were randomly divided into two groups and treated with either solvent or verticillin A (0.5 mg/kg body weight) and anti-PD-L1 monoclonal antibody (MAb; 200 μg/mouse) once every two days for 10 days. Tumor volume and weight were analyzed by two-sided t tests (right panels). B) Comparison of tumor growth inhibition efficacy by combined verticillin A and anti-PD-L1 therapy in wild-type (WT) and faslgld mice. Tumor volume and weight in WT (as shown in Figure 6A) and faslgld (as shown in Figure 7A) mice treated with verticillin A and anti-PD-L1 MAb were compared with those of untreated mice and presented as % of control tumors. The difference between WT and Faslgld mice was analyzed by two-sided t test. Column: mean; bar: SD. C) PANC02-H7 cells were surgically transplanted to WT mice. Five days later, tumor-bearing mice were randomly divided into four groups and treated with solvent (control, n = 5), anti-CD8 MAb (clone 2.43, 200 μg/mouse, n = 5), verticillin A (0.5 mg/kg body weight, n = 5) and anti-PD-L1 MAb (200 μg/mouse, n = 5), and verticillin A plus anti-PD-L1 plus anti-CD8 MAbs (n = 5) once every two days for 10 days. Tumor volume and tumor weight were analyzed by two-sided t tests and are presented in the right panels. D) UN-KC-6141 cells were surgically transplanted to WT mice. Five days later, tumor-bearing mice were treated as in (C). Tumor volume and tumor weight were analyzed by two-side t tests and are presented in the right panels. E and F) Tumor tissues from both PANC02-H7 (E) and UN-KC-6141 (F) tumor-bearing mice as shown in Figure 7, A and B, were collected after the indicated treatments and analyzed for CD8 and IFNγ mRNA levels by quantitative polymerase chain reaction. The differences between control and treatment group were analyzed by two-sided t tests. Column: mean; bar: SD. WT = wild-type.
Discussion
H3K4 methylation in mammalian cells is catalyzed by multiple HMTases (33). Homozygous MLL SET-domain knockout mice have a relatively normal phenotype (34), and the histone methyltransferase activity of MLL1 seems dispensable for hematopoiesis (35). Furthermore, the effects of MLL1 deficiency on H3K4me3 and gene expression are minimal in mouse embryonic stem cells (36). However, MLL1 is essential for H3K4me3-dpendent Hox gene transcription activation in leukemia (27,28,37,38). Here we show that MLL1 is highly expressed in pancreatic cancer cells. We also show an H3K4me3 cluster present in the cd274 promoter region flanking the transcription start site in a normal mouse pancreas. However, H3K4me3 level is dramatically upregulated in the cd274 promoter region in pancreatic tumor tissues in vivo. We further show that inhibition of MLL1 activity or silencing of MLL1 expression decreases H3K4me3 level in the CD274 promoter region and downregulates PD-L1 expression in pancreatic tumor cells. Conversely, overexpression of MLL1 increased PD-L1 expression in pancreatic tumor cells. Our data thus extend MLL1 function to H3K4 methylation and PD-L1 transcription activation in pancreatic cancer cells.
Immune suppression is a major limiting factor for cancer immunotherapy (39–41). Immune checkpoint blockade reverses immune suppression to activate tumor-reactive CTLs that directly target tumor cells for apoptosis (11,16,42). CTLs primarily use the perforin- and Fas-mediated effector mechanisms to induce tumor cell apoptosis. Recent studies have shown that immune suppressive cells selectively inhibit the perforin pathway of tumor-specific CTLs without downregulating CTL activation in vivo (43,44), suggesting that the Fas-mediated effector mechanism may be functional in the immune-suppressive tumor microenvironment. Indeed, it has been shown that the Fas-FasL axis represses spontaneous melanoma metastasis (45), and FasL-mediated immune surveillance by T cells is essential for the control of spontaneous B cell lymphomas (32). Here we demonstrated that pancreatic tumor–infiltrating CTLs are FasL+ and FasL plays a key role in the suppression of pancreatic cancer growth in vivo. Our data therefore reveal a key role of FasL of host CTLs in cancer immune surveillance against pancreatic cancer growth in vivo.
One limitation of this study is that in addition to MLL1, verticillin A also inhibits five other HMTases (Supplementary Figure 4A, available online). Therefore, the specificity and toxicity of verticillin A as an epigenetic agent in cancer therapy remains to be further studied. Nevertheless, this proof of concept study indicates that epigenetic targeting of H3K4me3 is potentially effective in enhancing the efficacy of pancreatic cancer checkpoint immunotherapy.
Pancreatic ductal adenocarcinoma is a highly aggressive cancer where prognosis has not been improved over the past few decades (46). Pancreatic cancer is also one of the few cancers that does not respond to checkpoint immunotherapy (14). It has been shown that the expression level of PD-L1 is positively correlated with the efficacy of anti-PD-1/PD-L1 immunotherapy (9). In the literature, it has been reported that PD-L1 expression is sparse in human pancreatic carcinoma tissues (42,47). However, we show here that human pancreatic carcinoma expresses abundant PD-L1 and the majority of tumor cells are PD-L1-positive. Furthermore, nine of the 10 human pancreatic cancer cell lines are PD-L1-positive and no PD-L1- tumor cells are observed in these nine tumor cell lines. In this study, a specific and sensitive anti-PD-L1 MAb (clone 28-8) (29) was used, and this MAb has recently been approved by US Food and Drug Administration for detecting PD-L1 protein in human cancer patient tumor specimens. The discrepancy between our study and the reports in the literature might be due to the specificity and sensitivity of antibodies used, which requires further study. Nevertheless, the abundant PD-L1 protein level in human pancreatic cancer cells also suggests that the expression level of PD-L1 might be a determining factor of the PD-1/PD-L1 pathway-mediated cancer immune resistance against elimination by endogenous tumor-specific T cells in pancreatic cancer. This notion is supported by our observation that repression of MLL1-mediated PD-L1 expression with verticillin A statistically significantly increases the efficacy of anti-PD-L1/PD-1 immunotherapy against the established pancreatic cancer. Therefore, elevated PD-L1 expression levels in vivo might be a limiting factor for the poor response of pancreatic cancer to anti-PD-L1/PD-1 immunotherapy. However, although verticillin A and anti-PD-L1 alone exhibited statistically remarkable tumor suppressive activity, no synergistic effects were observed between these two agents, which is probably because of the fact that these two agents, when combined, almost eradicated the tumors. Further studies for various agent doses and treatment time are required. Nevertheless, our findings support the notion of combined epigenetic agents and immunotherapy to combat cancer (48). Specifically, the use of an epigenetic agent, such as an MLL1 inhibitor, to target H3K4me3 to decrease PD-L1 expression is potentially an effective approach to augment the efficacy of checkpoint blockade immunotherapy against deadly pancreatic cancer.
Funding
This work was supported by the National Institutes of Health (CA185908 and CA133085).
Notes
The funder had no role in the study; the collection, analysis, or interpretation of the data; the writing of the manuscript; or the decision to submit the manuscript for publication.
Author contributions: CL and AVP performed experiments, analyzed data, and wrote the manuscript. NS, HS, and JLW analyzed data. MES, NHO, and CP generated key reagents and analyzed data. KL designed studies and wrote the manuscript.
We thank Dr. Kimya Jones at Georgia Pathology Service for excellent technical assistance in immunohistochemical staining of tumor tissues. We also thank Dr. Amninder Kaur (UNCG) for isolating the verticillin A used in these experiments. We also thank Dr. Roni Bollag at the Georgia Cancer Center Tumor Bank for analyzing the tumor specimens.
References
- 1.Sun L, St Leger AJ, Yu CR, et al. Interferon regulator factor 8 (IRF8) limits ocular pathology during HSV-1 infection by restraining the activation and expansion of CD8+ T Cells. PLoS One. 2016;11(5):e0155420. [DOI] [PMC free article] [PubMed] [Google Scholar]
- 2.Munir S, Andersen GH, Met O, et al. HLA-restricted CTL that are specific for the immune checkpoint ligand PD-L1 occur with high frequency in cancer patients. Cancer Res. 2013;73(6):1764–1776. [DOI] [PubMed] [Google Scholar]
- 3.Hayes JB, Sircy LM, Heusinkveld LE, et al. Modulation of macrophage inflammatory nuclear factor kappaB (NF-kappaB) signaling by intracellular cryptococcus neoformans. J Biol Chem. 2016;291(30):15614–15627. [DOI] [PMC free article] [PubMed] [Google Scholar]
- 4.Hirano F, Kaneko K, Tamura H, et al. Blockade of B7-H1 and PD-1 by monoclonal antibodies potentiates cancer therapeutic immunity. Cancer Res. 2005;65(3):1089–1096. [PubMed] [Google Scholar]
- 5.Peng J, Hamanishi J, Matsumura N, et al. Chemotherapy induces programmed cell death-ligand 1 overexpression via the nuclear factor-kappaB to foster an immunosuppressive tumor microenvironment in ovarian cancer. Cancer Res. 2015;75(23):5034–5045. [DOI] [PubMed] [Google Scholar]
- 6.Teng MW, Ngiow SF, Ribas A, et al. Classifying cancers based on T-cell infiltration and PD-L1. Cancer Res. 2015;75(11):2139–2145. [DOI] [PMC free article] [PubMed] [Google Scholar]
- 7.Twyman-Saint Victor C, Rech AJ, Maity A, et al. Radiation and dual checkpoint blockade activate non-redundant immune mechanisms in cancer. Nature. 2015;520(7547):373–377. [DOI] [PMC free article] [PubMed] [Google Scholar]
- 8.Norde WJ, Maas F, Hobo W, et al. PD-1/PD-L1 interactions contribute to functional T-cell impairment in patients who relapse with cancer after allogeneic stem cell transplantation. Cancer Res. 2011;71(15):5111–5122. [DOI] [PubMed] [Google Scholar]
- 9.Topalian SL, Hodi FS, Brahmer JR, et al. Safety, activity, and immune correlates of anti-PD-1 antibody in cancer. N Engl J Med. 2012;366(26):2443–2454. [DOI] [PMC free article] [PubMed] [Google Scholar]
- 10.Kobold S, Grassmann S, Chaloupka M, et al. Impact of a new fusion receptor on PD-1-mediated immunosuppression in adoptive T cell therapy. J Natl Cancer Inst. 2015;107(8):XXX–XXX. [DOI] [PMC free article] [PubMed] [Google Scholar]
- 11.Winograd R, Byrne KT, Evans RA, et al. Induction of T-cell immunity overcomes complete resistance to PD-1 and CTLA-4 blockade and improves survival in pancreatic carcinoma. Cancer Immunol Res. 2015;3(4):399–411. [DOI] [PMC free article] [PubMed] [Google Scholar]
- 12.Lutz ER, Wu AA, Bigelow E, et al. Immunotherapy converts nonimmunogenic pancreatic tumors into immunogenic foci of immune regulation. Cancer Immunol Res. 2014;2(7):616–631. [DOI] [PMC free article] [PubMed] [Google Scholar]
- 13.Zitvogel L, Galluzzi L, Smyth MJ, et al. Mechanism of action of conventional and targeted anticancer therapies: Reinstating immunosurveillance. Immunity. 2013;39(1):74–88. [DOI] [PubMed] [Google Scholar]
- 14.Brahmer JR, Tykodi SS, Chow LQ, et al. Safety and activity of anti-PD-L1 antibody in patients with advanced cancer. N Engl J Med. 2012;366(26):2455–2465. [DOI] [PMC free article] [PubMed] [Google Scholar]
- 15.Dong H, Strome SE, Salomao DR, et al. Tumor-associated B7-H1 promotes T-cell apoptosis: A potential mechanism of immune evasion. Nat Med. 2002;8(8):793–800. [DOI] [PubMed] [Google Scholar]
- 16.Topalian SL, Drake CG, Pardoll DM. Immune checkpoint blockade: A common denominator approach to cancer therapy. Cancer Cell. 2015;27(4):450–461. [DOI] [PMC free article] [PubMed] [Google Scholar]
- 17.Taube JM, Young GD, McMiller TL, et al. Differential expression of immune-regulatory genes associated with PD-L1 display in melanoma: Implications for PD-1 pathway blockade. Clin Cancer Res. 2015;21(17):3969–3976. [DOI] [PMC free article] [PubMed] [Google Scholar]
- 18.Limagne E, Euvrard R, Thibaudin M, et al. Accumulation of MDSC and Th17 cells in patients with metastatic colorectal cancer predict the efficacy of a FOLFOX-bevacizumab drug treatment regimen. Cancer Res. 2016; in press. [DOI] [PubMed] [Google Scholar]
- 19.Marzec M, Zhang Q, Goradia A, et al. Oncogenic kinase NPM/ALK induces through STAT3 expression of immunosuppressive protein CD274 (PD-L1, B7-H1). Proc Natl Acad Sci U S A. 2008;105(52):20852–20857. [DOI] [PMC free article] [PubMed] [Google Scholar]
- 20.Mittendorf EA, Philips AV, Meric-Bernstam F, et al. PD-L1 expression in triple-negative breast cancer. Cancer Immunol Res. 2014;2(4):361–370. [DOI] [PMC free article] [PubMed] [Google Scholar]
- 21.Shankaran V, Ikeda H, Bruce AT, et al. IFNgamma and lymphocytes prevent primary tumour development and shape tumour immunogenicity. Nature. 2001;410(6832):1107–1111. [DOI] [PubMed] [Google Scholar]
- 22.Bardhan K, Paschall AV, Yang D, et al. IFNgamma induces DNA methylation-silenced GPR109A expression via pSTAT1/p300 and H3K18 acetylation in colon cancer. Cancer Immunol Res. 2015;3(7):795–805. [DOI] [PMC free article] [PubMed] [Google Scholar]
- 23.Spranger S, Spaapen RM, Zha Y, et al. Up-regulation of PD-L1, IDO, and T(regs) in the melanoma tumor microenvironment is driven by CD8(+) T cells. Sci Transl Med. 2013;5(200):200ra116. [DOI] [PMC free article] [PubMed] [Google Scholar]
- 24.Wang Y, Zhang Y, Yang J, et al. Genomic sequencing of key genes in mouse pancreatic cancer cells. Curr Mol Med. 2012;12(3):331–341. [DOI] [PMC free article] [PubMed] [Google Scholar]
- 25.Wang B, Shi Q, Abbruzzese JL, et al. A novel, clinically relevant animal model of metastatic pancreatic adenocarcinoma biology and therapy. Int J Pancreatol. 2001;29(1):37–46. [DOI] [PubMed] [Google Scholar]
- 26.Torres MP, Rachagani S, Souchek JJ, et al. Novel pancreatic cancer cell lines derived from genetically engineered mouse models of spontaneous pancreatic adenocarcinoma: Applications in diagnosis and therapy. PLoS One. 2013;8(11):e80580. [DOI] [PMC free article] [PubMed] [Google Scholar]
- 27.Cao F, Townsend EC, Karatas H, et al. Targeting MLL1 H3K4 methyltransferase activity in mixed-lineage leukemia. Mol Cell. 2014;53(2):247–261. [DOI] [PMC free article] [PubMed] [Google Scholar]
- 28.Milne TA, Briggs SD, Brock HW, et al. MLL targets SET domain methyltransferase activity to Hox gene promoters. Mol Cell. 2002;10(5):1107–1117. [DOI] [PubMed] [Google Scholar]
- 29.Phillips T, Simmons P, Inzunza HD, et al. Development of an automated PD-L1 immunohistochemistry (IHC) assay for non-small cell lung cancer. Appl Immunohistochem Mol Morphol. 2015;23(8):541–549. [DOI] [PMC free article] [PubMed] [Google Scholar]
- 30.Chun E, Lavoie S, Michaud M, et al. CCL2 promotes colorectal carcinogenesis by enhancing polymorphonuclear myeloid-derived suppressor cell population and function. Cell Rep. 2015;12(2):244–257. [DOI] [PMC free article] [PubMed] [Google Scholar]
- 31.Greiner D, Bonaldi T, Eskeland R, et al. Identification of a specific inhibitor of the histone methyltransferase SU(VAR)3-9. Nat Chem Biol. 2005;1(3):143–145. [DOI] [PubMed] [Google Scholar]
- 32.Afshar-Sterle S, Zotos D, Bernard NJ, et al. Fas ligand-mediated immune surveillance by T cells is essential for the control of spontaneous B cell lymphomas. Nat Med. 2014;20(3):283–290. [DOI] [PubMed] [Google Scholar]
- 33.Salz T, Li G, Kaye F, et al. hSETD1A regulates Wnt target genes and controls tumor growth of colorectal cancer cells. Cancer Res. 2014;74(3):775–786. [DOI] [PMC free article] [PubMed] [Google Scholar]
- 34.Terranova R, Agherbi H, Boned A, et al. Histone and DNA methylation defects at Hox genes in mice expressing a SET domain-truncated form of Mll. Proc Natl Acad Sci U S A. 2006;103(17):6629–6634. [DOI] [PMC free article] [PubMed] [Google Scholar]
- 35.Mishra BP, Zaffuto KM, Artinger EL, et al. The histone methyltransferase activity of MLL1 is dispensable for hematopoiesis and leukemogenesis. Cell Rep. 2014;7(4):1239–1247. [DOI] [PMC free article] [PubMed] [Google Scholar]
- 36.Denissov S, Hofemeister H, Marks H, et al. Mll2 is required for H3K4 trimethylation on bivalent promoters in embryonic stem cells, whereas Mll1 is redundant. Development. 2014;141(3):526–537. [DOI] [PubMed] [Google Scholar]
- 37.Wang P, Lin C, Smith ER, et al. Global analysis of H3K4 methylation defines MLL family member targets and points to a role for MLL1-mediated H3K4 methylation in the regulation of transcriptional initiation by RNA polymerase II. Mol Cell Biol. 2009;29(22):6074–6085. [DOI] [PMC free article] [PubMed] [Google Scholar]
- 38.Garcia-Cuellar MP, Buttner C, Bartenhagen C, et al. Leukemogenic MLL-ENL fusions induce alternative chromatin states to drive a functionally dichotomous group of target genes. Cell Rep. 2016;15(2):310–322. [DOI] [PubMed] [Google Scholar]
- 39.Rutkowski MR, Svoronos N, Perales-Puchalt A, et al. The tumor macroenvironment: Cancer-promoting networks beyond tumor beds. Adv Cancer Res. 2015;128:235–262. [DOI] [PMC free article] [PubMed] [Google Scholar]
- 40.Pylayeva-Gupta Y, Lee KE, Hajdu CH, et al. Oncogenic Kras-induced GM-CSF production promotes the development of pancreatic neoplasia. Cancer Cell. 2012;21(6):836–847. [DOI] [PMC free article] [PubMed] [Google Scholar]
- 41.Bayne LJ, Beatty GL, Jhala N, et al. Tumor-derived granulocyte-macrophage colony-stimulating factor regulates myeloid inflammation and T cell immunity in pancreatic cancer. Cancer Cell. 2012;21(6):822–835. [DOI] [PMC free article] [PubMed] [Google Scholar]
- 42.Herbst RS, Soria JC, Kowanetz M, et al. Predictive correlates of response to the anti-PD-L1 antibody MPDL3280A in cancer patients. Nature. 2014;515(7528):563–567. [DOI] [PMC free article] [PubMed] [Google Scholar]
- 43.Chen ML, Pittet MJ, Gorelik L, et al. Regulatory T cells suppress tumor-specific CD8 T cell cytotoxicity through TGF-beta signals in vivo. Proc Natl Acad Sci U S A. 2005;102(2):419–424. [DOI] [PMC free article] [PubMed] [Google Scholar]
- 44.Mempel TR, Pittet MJ, Khazaie K, et al. Regulatory T cells reversibly suppress cytotoxic T cell function independent of effector differentiation. Immunity. 2006;25(1):129–141. [DOI] [PubMed] [Google Scholar]
- 45.Owen-Schaub LB, van Golen KL, Hill LL, et al. Fas and Fas ligand interactions suppress melanoma lung metastasis. J Exp Med. 1998;188(9):1717–1723. [DOI] [PMC free article] [PubMed] [Google Scholar]
- 46.Ponnusamy MP, Batra SK. Insights into the role of nicotine in pancreatic stem cell activation and acinar dedifferentiation. Gastroenterology. 2014;147(5):962–965. [DOI] [PubMed] [Google Scholar]
- 47.Wang L, Ma Q, Chen X, et al. Clinical significance of B7-H1 and B7-1 expressions in pancreatic carcinoma. World J Surg. 2010;34(5):1059–1065. [DOI] [PubMed] [Google Scholar]
- 48.Elpek KG, Cremasco V, Shen H, et al. The tumor microenvironment shapes lineage, transcriptional, and functional diversity of infiltrating myeloid cells. Cancer Immunol Res. 2014;2(7):655–667. [DOI] [PMC free article] [PubMed] [Google Scholar]