

Abstract
Recent studies have indicated that innate immune signalling molecules are involved in late-onset Alzheimer's disease (LOAD) risk. Amyloid beta (Aβ) accumulates in AD brain, and has been proposed to act as a trigger of innate immune responses. Caspase-4 is an important part of the innate immune response. We recently characterized transgenic mice carrying human CASP4, and observed that the mice manifested profound innate immune responses to lipopolysaccharide (LPS). Since these inflammatory processes are important in the aetiology of AD, we have now analysed the correlation of expression of caspase-4 in human brain with AD risk genes, and studied caspase-4 effects on AD-related phenotypes in APPswe/PS1deltaE9 (APP/PS1) mice. We observed that the expression of caspase-4 was strongly correlated with AD risk genes including TYROBP, TREM2, CR1, PSEN1, MS4A4A and MS4A6A in LOAD brains. Caspase-4 expression was upregulated in CASP4/APP/PS1 mice in a region-specific manner, including hippocampus and prefrontal cortex. In APP/PS1 mice, caspase-4 expression led to impairments in the reversal phase of a Barnes maze task and in hippocampal synaptic plasticity, without affecting soluble or aggregated Aβ levels. Caspase-4 was expressed predominantly in microglial cells, and in the presence of CASP4, more microglia were clustered around amyloid plaques. Furthermore, our data indicated that caspase-4 modulates microglial cells in a manner that increases proinflammatory processes. We propose that microglial caspase-4 expression contributes to the cognitive impairments in AD, and that further study of caspase-4 will enhance our understanding of AD pathogenesis and may lead to novel therapeutic targets in AD.
Introduction
Alzheimer's disease (AD) is a major form of senile dementia affecting more than 30 million people worldwide. AD prevalence is expected to double every 20 years in the near future, however, no effective intervention or preventive treatment is currently available. Aβ peptides, which accumulate in the brains of AD patients, are proteolytic fragments of the amyloid precursor protein (APP), and this has been postulated to be a causative agent of neurodegeneration in AD (1–2). Mutations in APP, PSEN1 and PSEN2 explain the majority of early-onset AD, the latter two of which are the catalytic subunits of gamma-secretase, which contributes to the formation of Aβ, supporting a causal role for Aβ. Recently, a single nucleotide variant in APP was discovered that reduces Aβ production and risk for LOAD, further underscoring the importance of Aβ in AD (3).
Despite the evidence of microglial activation in AD brains (4), it is important to understand whether microglia drive AD pathogenesis or are downstream and activated in response to neurodegenerative processes. Genetic association studies have identified several immune-related genes in LOAD, including TREM2, MS4A4A, CD33, SORL1, CR1 and HLA-DRBs (5–7). Transcriptome and gene coexpression analysis in human brains showed altered immune/inflammatory responses in AD brain (8–10). Furthermore, a recent integrative network analysis of the genetic and gene expression data from a large number of LOAD brains revealed that microglia and immune enriched gene networks in multiple brain regions of LOAD are most associated with AD pathophysiological data. (11).
Microglial cells are derived from erythromyeloid precursor cells migrating from yolk sac during early embryonic brain development, and are a major resident immune cell in the central nervous system (CNS)(12,13). Microglia comprise 5–10% of all cells in the brain (14), and carry out innate immune functions, such as phagocytosis of debris from cells and synapses (15) and secretion of factors that can either promote tissue protection and repair or act as neurotoxic agents, depending on the context (16). Mouse microglial cells are recruited to Aβ plaques (17), where they are believed to uptake plaques by phagocytosis (18,19) and release inflammatory cytokines (20), however it has been suggested that human microglia do not appear to significantly influence plaque clearance in AD brains (21). In addition to resident microglia, peripheral monocytes infiltrate the brain parenchyma under pathological condition, and several studies have indicated that infiltrating monocytes have distinct functional characteristics compared to resident microglia (22–24).
We have previously noted that caspase-4 expression is regulated by the APP-binding protein Fe65, and observed the dysregulation of caspase-4 expression in the entorhinal cortex of AD subjects (25). Caspase-4 results from gene duplication of caspase-11, such that rodents have caspase-11, while primates have caspases-4 and -5. Caspases, including caspase-4, are distinctly regulated, hence the absence of caspase-4 in rodents may contribute to altered CNS immune responses in rodents, as compared to humans. Caspase-4 has been shown to enhance the transcriptional role of NF-kB signalling in human THP1 macrophage cells (26). Recently, we reported on the development and characterization of a novel transgenic mouse expressing human caspase-4 from its native regulatory elements. In these studies, we observed a crucial role for caspase-4 in not only initiating inflammatory cell death but also priming the Nlrp3 inflammasome and caspase-1 activation (27). Caspase-4 is an intracellular receptor for LPS leading to an induction of pyroptosis (28) by cleaving gusdermin D (29,30), and activates the non-canonical Nlrp3 inflammasome leading to activation of caspase-1 and secretion of IL-1β and IL-18 (31-32). Caspase-4 was shown to play a critical role in clearance and protection against cytosolic gram-negative bacteria (33,34). Recent studies have demonstrated that Aβ activates caspase-1 via the Nlrp3 inflammasome in microglial cells (35), and that there are reduced behavioural deficits and amyloid pathology as a result of deletion of Nlrp3 or caspase-1 in a mouse model of AD (36). In addition, mouse caspase-11 has been shown to play a role in cell migration by recruiting Wdr1/Aip1 to cofilin1 and F-actin, thereby increasing actin depolymerization independent of catalytic activity (37).
With multiple roles of caspase-4 in innate immunity and evidence for increased CASP4 expression in AD post-mortem brains, we hypothesized that CASP4 is a critical part of AD progression, which is not captured in current mouse models for AD. In the current study, we analysed coexpression of AD-associated genes with CASP4 in LOAD brains, and tested the hypothesis in an APP/PS1 AD mouse model that human CASP4 contributes to AD progression by driving pathological immune responses.
Results
Caspase-4 regulation in AD brain
To understand whether caspase-4 had a role in AD progression, we first examined the results from a multidimensional large-scale study of LOAD, including SNP, gene expression and pathophysiological data for 1647 brain specimens from three post-mortem brain regions (dorsolateral prefrontal cortex, visual cortex and cerebellum) of AD patients and non-demented controls (11). We first noted that this study confirmed our prior findings in an independent sample (25), i.e., that the levels of caspase-4 increased in AD brains. We next examined a list of genes implicated in LOAD aetiology (See Supplementary Material, Table S1 for genes and references), looking for evidence for coexpression. In LOAD prefrontal cortex, caspase-4 (CASP4) showed a very strong correlation with caspase-1 (CASP1) (r2 = 0.701, P = 1.89 × 10−78 and 3.77 × 10−78 by Benjamini-Hochberg (BH) and Bonferroni (B) correction, respectively), consistent with their overlapping roles in mediating the inflammatory response (Fig. 1A). Strong correlation of expression with caspase-1 was also observed in the LOAD visual cortex, and cerebellum [visual cortex: r2 = 0.702, P = 4.42 × 10−47 (BH) and 8.83×10−47 (B); cerebellum: r2 = 0.435, P = 1.53×10⁻³¹ (BH) and 1.21×10⁻²⁹ (B)]. In visual cortex, caspase-4 was also significantly correlated with TREM2 [r2 = 0.165, P = 1.76×10⁻⁷ (BH) and 2.41×10⁻⁴ (B)]. TREM2 has its highest expression in microglia and genetic variation in this gene has been found to increase risk for LOAD (6). Likewise, in LOAD cortex, caspase-4 had a significant and positive correlation with CR1 [visual cortex: r2 = 0.180, P = 3.69×10⁻⁸ (BH) and 4.36×10⁻⁵ (B); prefrontal cortex: r2 = 0.151, P = 2.11×10⁻¹¹ (BH) and 4.60×10⁻⁸ (B)]. CR1 is a complement receptor protein that has been associated with LOAD risk in genome wide association studies (GWAS) (38). In all brain regions examined, caspase-4 showed significant correlation with TYROBP [visual cortex: r2 = 0.361, P = 7.47×10⁻¹⁸ (BH) and 2.01×10⁻¹⁵ (B); prefrontal cortex: r2 = 0.359, P = 1.88×10⁻²⁹ (BH) and 6.02×10⁻²⁷ (B); cerebellum: r2 = 0.214, p 1.95×10⁻¹³ (BH) and 9.44×10⁻¹¹ (B)], a top driver of an inflammation/microglial-enriched subnetwork that has been causally associated with LOAD (11). The MS4A gene cluster also has been implicated by multiple GWAS (39,40), and MS4A4A and MS4A6A, which are highly expressed in hematopoietic cells (41), showed strong correlations with caspase-4 in all regions [MS4A4A: visual cortex: r2 = 0.644, P = 3.39×10⁻²¹ (BH) and 4.85×10⁻¹⁹ (B); prefrontal cortex: r2 = 0.658, P = 1.53×10−45 (BH) and 1.32×10−43 (B); cerebellum: r2 =0.624, P = 3.14×10⁻²⁷ (BH) and 3.66×10⁻²⁵ (B); MS4A6A: visual cortex: r2 = 0.642, P = 4.51×10⁻²¹ (BH) and 6.58×10⁻¹⁹ (B); prefrontal cortex: r2 = 0.695, P = 1.71×10−43 (BH) and 1.74×10−41 (B); cerebellum: r2 =0.498, P = 7.49×10⁻¹⁶ (BH) and 2.84×10⁻¹³ (B)]. Finally, in LOAD prefrontal cortex, caspase-4 showed a significant inverse correlation with PSEN1 [r2 = -0.157, P = 7.39×10⁻¹⁸ (BH) and 6.67×10⁻¹⁵ (B)], the most commonly mutated gene in familial AD. In order to put the correlations of gene expression between CASP4 and the genes studied here in a genome-wide framework, for each significant correlation, we also noted the percentile of the pair-wise correlation rank relative to all of the other probes considered (n = 35,979). Overall, CASP4 has a very high level of correlation with these genes, compared to all others that could be reliably analysed in the transcriptome (Fig. 1A). We next performed an enrichment analysis with all genes positively correlated with CASP4 (i.e., CASP4, CR1, MS4A4A, MS4A6A, TREM2, TYROBP, CASP1) using Enrichr (42). These genes were significantly overrepresented in GO modules related to immune cells/immune processes (Supplementary file 1). This analysis also suggested that the transcription factor IRF8, Spi1, Cebpb, Stat3 and Pbx1, are regulators significantly associated with these modules (Supplementary Material, Table S2). We focused on IRF8 and Spi1 for functional analysis of the CASP4 gene promoter, as they are selectively expressed in microglia (43,44) and play an important role in microglial development (13). Our in silico promoter analysis identified a conserved GGAA motif among different species of CASP4 as well as human CASP5 (Fig. 1B and Supplementary Material, Fig. S1). We cloned the CASP4 promoter from -908 to +76 bp relative to the transcriptional start site [as defined according to the CASP4 alpha isoform (NM_001225)] into the pGL3-Basic luciferase vector and performed luciferase assays by transiently transfecting HEK293T cells. We found that Spi1 significantly induced expression from the CASP4 promoter, which was completely abolished by the deletion of the conserved GGAA motif (Fig. 1C); in contrast, IRF8 had no effect (data not shown).
Figure 1.

Correlation of caspase-4 expression with select genes implicated in Alzheimer’s disease. A. Upper panel, Correlation (Pearson coefficient, r2) of expression of CASP1, MS4A4A, MS4A46, CR1, PSEN1, TREM2, or TYROBP with that of CASP4 were calculated in the cerebellum, prefrontal cortex and visual cortex of Alzheimer’s disease subjects (cerebellum: n = 263, prefrontal cortex: n = 310, visual cortex: n = 190). Asterisk indicates P < 0.001 by Bonferroni post-hoc test. Lower panel, Percentiles for pair-wise correlation rank for significant correlations, relative to all of the assayed transcriptome (n = 35,979), to reflect genome-wide assessment of significance. B. Sequence comparison of human CASP4 and CASP5, Chimpanzee CASP4 and mouse Casp11 are shown. Del indicates the GGAA Spi1 binding motif deleted in the luciferase assays depicted in Figure 1C. Transcription start and translation initiation sites are shown with arrows. The gray box indicates 60 base pairs omitted from the scheme for simplicity. See supplementary Material, Figure 1 for a complete comparison. C. Luciferase assays were performed using a pGL3 vector containing a CASP4 wildtype (WT) promoter fragment or a promoter with the GGAA deletion (Del) indicated in B. A figure representative of three independent experiment is shown. ANOVA and Bonferroni post-hoc test were used for statistical analysis. ***P < 0.001.
Induction of caspase-4 by Aβ
We previously demonstrated that caspase-4 was upregulated in the entorhinal cortex of AD, beginning at the earliest stages of amyloid plaque deposition (25). This observation led us to test whether Aβ could upregulate caspase-4. Expression of caspase-4 in vitro was upregulated in H4 neuroglioma cells treated with 10 μM Aβ (1–42) but not reverse Aβ (42–1), concomitant with increases in interleukin (IL)-1β (Supplementary Material, Fig. S2A and B).
We next investigated whether caspase-4 expression was upregulated in the brains of CASP4/APP/PS1 mice, as compared to CASP4 mice. In addition, we also analysed the expression of caspase-1 in these animals, as we recently demonstrated that caspase-4 is an activator of caspase-1 (27) and we observed robust coexpression of caspase-1 and caspase-4 in LOAD brain (Fig. 1A). We found significant differences in the expression of both caspase-4 and caspase-1 as a function of genotype by ANOVA [caspase-4: F(1,17) = 5.945, P = 0.020; caspase-1: F(1,17) = 4.503, P = 0.041] (Fig. 2). Fisher's post-hoc tests revealed that caspase-4 levels were significantly elevated in hippocampus (P = 0.044), prefrontal area (P = 0.050), and olfactory bulb (P = 0.004), while caspase-1 levels were significantly elevated in hippocampus (P < 0.001). We did not find evidence that caspase-4 altered the levels of soluble Aβ or volume of amyloid plaques (Supplementary Material, Fig. S3A and B).
Figure 2.

Upregulation of caspase-4 expression in CASP4/APP/PS1 mice. 13 month old CASP4 and CASP4/APP/PS1 male mouse brains were dissected into the indicated brain regions and analysed by immunoblot (IB) with anti-caspase-4 or anti-caspase-1 antibodies. Band intensities were quantified and normalized to actin. Immunoblot images are representative of three independent experiments from three independent cohorts, each consisting of three CASP4 and three CASP4/APP/PS1 mice. OB; olfactory bulb, PFC; prefrontal cortex, CPu; caudate/putamen, HPC; hippocampus, Th/Hy; thalamus/hypothalamus, Mid; midbrain, Crb; cerebellum, Hind; hindbrain, SC; spinal cord. ANOVA followed by Fisher's post-hoc tests were used for statistical analysis. *P < 0.05.
Caspase-4-associated deficits in the reversal phase of spatial learning in an AD mouse model
It has been shown that APP/PS1 mice display deficits in spatial learning and memory tasks, including in the Morris water maze and Barnes mazes (45,46), that are associated with hippocampal synaptic plasticity deficits (47,48). We tested whether caspase-4 modulates such deficits using the 40-hole Barnes maze. At 7 months, mice in all genotypes showed similar learning curves during the acquisition learning phase (Day 1–5) [ϵ = 0. 674, F(8.093, 91.725) = 0.838, P = 0.573] (Fig. 3A). In contrast, there was a significant interaction of genotype by trial day during the reversal learning phase (Day 6–10) [ϵ = 0.398, F(4.773, 54.090) = 2.60, P = 0.037] (Fig. 3B). This interaction was driven by the performance on Day 6 (the first day on the reversal phase), where one-way analysis of variance (ANOVA) showed a significant difference between genotypes [F(3, 37) = 3.341, P = 0.031)], with post-hoc difference by Dunnett's procedure observed between wildtype (WT) and CASP4/APP/PS1 animals (P = 0.017). During the reversal phase, groups differed on the means [F(3,34) = 30.12, P = 0.043]. Follow-up pair-wise comparisons by Dunnett's procedure showed that CASP4/APP/PS1 (P = 0.021), but not CASP4 (P = 0.896) or APP/PS1 (P = 0.476) mice are significantly impaired compared to WT mice at 7 months.
Figure 3.

Impaired acquisition and reversal for the Barnes maze in CASP4/APP/PS1 mice. (A and B) Latency of 7-month-old animals with the indicated genotypes on Barnes maze test are shown (A, acquisition trials; B, reversal trials). C and D, The same cohort of mice shown in panels A and B was retested when the animals were 13 months old. (C, acquisition trials; D, reversal trials). The number of animals used for each genotype are indicated in parentheses. Dunnett's post-hoc tests after repeated measure two-way ANOVA are indicated as asterisks. *P < 0.05; **P < 0.01; ***P <0.001.
When the same cohort of mice was tested at 14 month of age, there were significant differences in genotype x trial day interaction in the acquisition phase [ϵ = 0.670, F(8.044, 75.079) = 2.839, P = 0.008] (Fig. 3C). Specifically, they differed on the means of the four genotypes [F(3,28) = 9.930, P < 0.0005]. Pair-wise comparison by Dunnett's procedure revealed that CASP4/APP/PS1 (P < 0.0005) and APP/PS1 (P = 0.001) mice were significantly impaired compared to WT. During the reversal phase, there was no genotype x trial day interaction [ϵ = 0.720, F(8.636,94.996) = 1.107, P = 0.366]. However, there were significant genotype differences across the reversal phase [F(1, 33) = 4.858, P = 0.007] (Fig. 3D). Dunnett's pair-wise comparison revealed that CASP4/APP/PS1 mice performed significantly worse compared to control (P = 0.004) as well as CASP4 (P = 0.021) animals.
No impairment of motor functions was observed in any genotypes as measured by rotarod test at 13 month [Latency to fall; F(3, 43) = 0.504, P = 0.682, maximal revolution per minute (RPM); F(3,43) = 0.142, P = 0.934] (Supplementary Material, Fig. S4). Hence, we conclude that the deficits in reversal learning were not influenced by motor problems.
Caspase-4-associated impairment of long-term potentiation (LTP)
Given the evidence for an exacerbation of behavioural phenotypes with the expression of CASP4, we next tested whether caspase-4 expression exacerbates AD-related synaptic plasticity deficits in APP/PS1 mice. LTP was induced by tetanic stimulation of the Schaffer collaterals (4 trains of 100 Hz separated by 5 min, a stimulation protocol that induces late-phase LTP) in hippocampal slices taken from 14-month old mice of all four genotypes. LTP maintenance was impaired in all three transgenic lines (CASP4, APP/PS1, CASP4/APP/PS1) in comparison to WT mice [F(1,22) = 13.69, P < 0.001, repeated measures ANOVA] (Fig. 4). Measuring at 110 min after tetanus, the field EPSP slope was 147.6 ± 5.8% of the baseline for WT, 110.8 ± 3.7% for CASP4, 115.5 ± 3.6% for APP/PS1 and 103.7 ± 3% for CASP4/APP/PS1 slices. Importantly, comparison of the induction phase of LTP showed a significant reduction only in CASP4/APP/PS1 mice [F(2,11) = 7.9, P = 0.01] indicating further and profound synaptic effects due to caspase-4 expression in APP/PS1 mice. Quantitative immunoblot analysis of synaptic marker proteins revealed that they were significantly reduced in the hippocampus of CASP4, APP/PS1, and CASP4/APP/PS1 compared to WT (Supplementary Material, Fig. S5A), suggesting the accretion of multiple factors which can impair behavioural and electrophysiological functions in CASP4/APP/PS1 mice.
Figure 4.
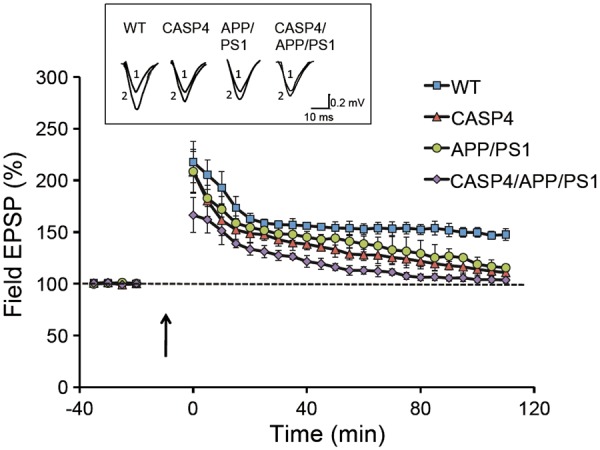
Deficits in induction and maintenance of hippocampal long-term potentiation in CASP4/APP/PS1 mice. LTP was induced in hippocampi from of 13 month old mice (5 animals per genotype from an independent cohort) by tetanic stimulation (4x1 s trains, 100 Hz, separated by 5 min) to the Schaffer collaterals in hippocampal slices taken from all four genotypes, and field EPSP slope in CA1 was determined during the 110 min recording period after tetanus. The inset shows representative EPSP traces that were obtained for each genotype, recorded before (1) and 90 min after (2) tetanic stimulation (calibration: 10 ms, 0.5 mV).
Caspase-4 expression in and regulation of microglial cells
To better understand the cellular mechanisms of caspase-4-induced neurophysiological and cognitive deficits, we used immunoblotting to analyse the cellular expression of caspases in lysates prepared from cultures of neurons, astrocytes and microglial cells. In CASP4 mice, caspase-1, caspase-4 and Nlrp3 expression were almost exclusively observed in microglial cells (Fig. 5A, left), consistent with recent, extensive transcriptome analysis of mouse brain cells (43). Similarly, in human foetal-derived brain cells, caspase-4 was primarily expressed in microglial cells with much more modest expression in astrocytes, while neurons did not show detectable caspase-4 expression (Fig. 5A, right). Microglial cells accounted for the majority of caspase-1 expression, with very limited expression in neurons and no expression observed in astrocytes.
Figure 5.

Altered distribution of microglial cells in the hippocampus of CASP4/APP/PS1 mice. (A) Left panel, Lysates from 7- or 14-days in vitro (Div) mouse neurons, astrocytes or microglial cells, all derived from CASP4 mice, were immunoblotted with the indicated antibodies. Right panel, Lysates prepared from human foetus-derived neurons (NEU), astrocytes (AST) and microglial cells (MG) were analysed by immunoblot with the indicated antibodies. (B) Left panel, Number of microglial cells associated with thioflavin positive amyloid plaque were quantitatively estimated by confocal image analysis. Middle panel, Frequency distribution of microglial cells per plaque is shown. Right panel, Confocal images representative for each genotype are shown (scale bar: 10 μm). Five animals were used per group from an independent cohort, and a. t-test was used for statistical analysis. C, Gene expression for IL-1β, iNOS, IL-6, Ym1 and Arg1 in the hippocampus of 14 month old mice was quantitated by qPCR and relative expression of each gene was calculated after normalizing to Gapdh, 18s rRNA and Rpl13a. Five to nine animals from an independent cohort were used for each group. One-way ANOVA and Bonferroni post-hoc testing were used for statistical analysis. * P < 0.05; **P < 0.01. D, Correlation (Pearson coefficient, r2) of expression of IL1B, IL6, ARG1 and CHIT1 with that of CASP4 were calculated in the cerebellum (CR), prefrontal cortex (PFC) and visual cortex (VC) of Alzheimer’s disease subjects as described in Figure 1A.
Since caspase-4 is primarily expressed in microglial cells in both mouse and human samples, we quantitatively analysed the microglia associated with thioflavin positive amyloid plaques, and found that the number of microglial cells associated with amyloid plaques was significantly increased in CASP4/APP/PS1 mice, compared to APP/PS1 mice (Fig. 5B). Microglial cells are functionally heterogeneous (14) and are differentiated to a broad spectrum of functional states including proinflammatory M1 (classical activation) and neuroprotective M2 (alternative activation) phenotypes. We found that expression of M1-phenotype markers including IL-1β, inducible nitric oxide synthase (iNOS), and IL-6 were significantly increased (as determined by Bonferroni post-hoc analyses), in the hippocampus of CASP4/APP/PS1 mice, as compared to APP/PS1 mice (Fig. 5C). In contrast, no significant changes were found in M2 phenotype markers such as Ym1 and Arg1. In human AD brains, we found significant correlation of IL1B [visual cortex: r2 = 0.280, P = 3.09×10⁻¹³ (BH) and 1.50×10⁻¹⁰ (B); prefrontal cortex: r2 = 0.258, P = 5.84×10⁻²⁰ (BH) and 4.19×10⁻¹⁷ (B); cerebellum: r2 = 0.264, P = 4.05×10⁻¹⁷ (BH) and 1.37×10⁻¹⁴ (B)] and IL6 [visual cortex: r2 = 0.334, P = 3.01×10⁻¹⁶ (BH) and 1.00×10⁻¹³ (B); prefrontal cortex: r2 = 0.399, P = 1.05×10⁻³³ (BH) and 2.20×10⁻³¹ (B); cerebellum: r2 = 0.509, P = 2.93×10−39 (BH) and 1.11×10−37 (B)] with CASP4 whereas ARG1 [visual cortex: r2 = 0.099, P = 1.21×10⁻⁴ (BH) and 3.72×10⁻¹ (B); prefrontal cortex: r2 = 0.106, P = 4.07×10⁻⁸ (BH) and 1.51×10⁻⁴ (B); cerebellum: r2 = 0.055, P = 1.03×10⁻³ (BH) and 1.00 (B)] and CHIT1 (the human homologue of Ym1) [visual cortex: r2 = 0.033, P = 4.25×10⁻² (BH) and 1.00 (B); prefrontal cortex: r2 = 7.2×10⁻⁴, P = 7.47×10⁻¹ (BH) and 1.00 (B); cerebellum: r2 = 9.87×10⁻⁵, P = 9.40×10⁻¹ (BH) and 1.00 (B)] showed relatively mild correlation (Fig. 5D). These data are consistent with a model whereby caspase-4 induces the recruitment of microglia to amyloid plaques, concomitant with proinflammatory M1 microglial polarization.
Discussion
Gene expression is a highly coordinated process reflecting the functional adaptation of cells and tissues to physiological and pathophysiological states. Gene coexpression approaches have been widely applied to infer molecular networks associated with complex biological and clinical traits, particularly in the context of diseases. Gene coexpression analysis has been carried out in AD postmortem brains, and the results indicated a critical pathological role of microglial immune responses. We observed that expression of caspase-4 in AD-associated brain regions is highly correlated with AD GWAS associated genes that have a role in the innate immune responses, providing support for a role for caspase-4 in AD pathogenesis through inflammatory processes. In an effort to understand the mechanism of the observed gene coexpression, we explored transcription factors which may regulate these genes, and identified a potential Spi1 binding motif in the CASP4 promoter, which we then showed to be functional in vitro. Spi1 is a transcription factor indispensable for maintenance of myeloid lineage stem cells (49) and microglia (13). In mouse microglial Bv2 cells, Spi1 has been found to occupy promoters of Tyrobp, Trem2, and Ms4a family genes (50). Taken together, Spi1 may be partially responsible for coregulation of CASP4 and the subset of AD-associated genes that are involved in the innate immune response.
Previous gene coexpression network analysis comparing human and mouse brain has highlighted profound species differences, with the greatest species difference found in microglial modules (51). Specifically, although dementia-related genes were highly enriched across the modules, they were nearly absent in mouse microglial modules. Since expression of caspase-4 is relatively constitutive, whereas mouse caspase-11 is very low in the absence of immune activation, we explored the possibility that introduction of human CASP4 in AD mouse model would better recapitulate AD pathogenesis in such a model. In our CASP4/APP/PS1 mouse model, we found that upregulation of caspase-4 was prominent in regions relevant to AD, including hippocampus, olfactory bulb and PFC. The hippocampus plays a critical role in the acquisition and retrieval of declarative memory (52), which is prominently impaired in AD subjects (53,54). Olfactory dysfunction is also an incipient symptom of AD (55,56). When considered together with our previous data, we can show that Aβ load is associated with increases in caspase-4 (1) in vitro, (2) in the AD mouse model, and (3) in AD patients (25).
We found that caspase-4 is predominantly expressed in microglial cells in our transgenic mice and in human cells, consistent with a role for caspase-4 in the immune response in the brain and our observation of CASP4 being an Spi1 target. Importantly, in the hippocampus of CASP4/APP/PS1 mice, we found an increased number of microglia associating with amyloid plaques. A previous study demonstrated the role for mouse caspase-11 in cell migration (37), and further study will be required to test whether caspase-4 may carry out similar function, and to clarify the mechanism of increased microglial association with amyloid plaques. Despite this increased microglial recruitment to plaques, we did not observe significant clearance of either soluble Aβ or plaques. In human AD brains, microglia apparently do not effectively clear amyloid plaques (21), and cultured microglia do not efficiently degrade phagocytosed Aβ fibrils (57–59). In addition, amyloid associated microglia have been shown to be primarily derived from peripheral monocytes and may aggravate AD-like phenotypes (23,60). In addition, recent studies indicated that infiltrating peripheral monocytes clustered around amyloid plaques, but do not effectively clear plaques (61) and eliminating microglia did not affect amyloid load (62). We speculate that these observations may explain our findings that caspase-4 enhance microglial homing to plaques, yet failed to promote degradation or clearance.
We observed the increased expression of M1 markers such as IL-1β, iNOS and IL-6 in CASP4/APP/PS1 compared to APP/PS1 transgenic mice, indicating that caspase-4 promotes proinflammatory M1 polarization, resulting in classically activated macrophages. In addition, we provided evidence that in human AD brain, CASP4 significantly correlates with expression of IL1B and IL6, while correlation with ARG1 or CHIT1 are moderate or low. Although we found no correlation with iNOS expression, this was not altogether surprising as it has been well documented that human iNOS expression is clearly distinct from the mouse counterpart (63–65). A previous study showed that infiltrating macrophages recruited to amyloid plaques increased expression of proinflammatory cytokines including IL-1β (23). Together with our observations that CASP4 expression increases plaque clustering of microglia and leads to upregulation of Il1b in the hippocampus, as well as our findings for gene coexpression of CASP4 and IL1B in human AD, we hypothesize that these recuited microglia may be responsible for Il1b expression and local proinflammatory processes. Future studies will focus on the transcriptomic and functional analysis of amyloid associated infiltrating cells.
In the Barnes maze analyses, both CASP4 and CASP4/APP/PS1 mice were impaired compared to WT animals during the acquisition phase. However, during the reversal phase, only CASP4/APP/PS1 mice performed significantly worse, indicating that caspase-4 further degrades cognitive performance. Interestingly, it has been suggested that aged individuals with mild cognitive impairment are particularly vulnerable to deficits in reversal learning among a battery of psychological assessments (66). In addition, Myers and colleagues showed that non-demented elderly with hippocampal atrophy — a potential prodromal sign of AD (67) — performed poorly in transfer learning, which involves reconfiguration of a stimulus (68). Several studies suggested that aged APP/PS1 mice are particularly sensitive to a switch of experimental condition such as reversal tasks (45,69), tests for episodic-like memory, and transfer learning (70).
In order to test if changes in synaptic plasticity could contribute to the cognitive deficit in CASP4/APP/PS1 mice, we measured LTP in hippocampal slices from CASP4, APP/PS1, CASP4/APP/PS1 and WT mice. Our results showed a decrease in LTP maintenance in all genotypes in comparison to WT animals, however, the induction phase was impaired only in the CASP4/APP/PS1 mice. This is consistent with the greater impairment in cognitive processes in the CASP4/APP/PS1 mice. Microglia contribute to synaptic and cognitive function through effects in synapse modification (71), and it has been shown that they have a role in neuronal function and learning and memory, mediated via regulation of inflammatory cytokines (72,73). Our analysis of synaptic markers suggests that hippocampal synapses are profoundly reduced in all transgenic mice (Supplementary Material, Fig. S5A), which, when considered together with the increased inflammation in CASP4/APP/PS1 mice, indicate that the combination of synaptic loss and proinflammatory microglial alteration are associated with a more profound impairment of synaptic LTP induction and memory.
While we tested amyloid as an AD-relevant inflammatory signal in the present study, other LOAD mechanisms could be potentially relevant to inflammatory responses mediated by caspase-4. Previous studies have highlighted prominent vascular lesions, such as microvessel degeneration and cerebral amyloid angiopathy, in the brains of subjects with AD (74), and vascular risk factors such as ischemia have been known to increase the risk for developing AD (75–76). These vascular changes could lead to increased permeability of the blood brain barrier (BBB) that has been observed in AD (77), allowing extravasation of blood components into the nervous system and perturbing CNS homeostasis. A recent study showed that aged APPswe/PS1deltaE9 mice (the line we used in the current study) developed loss of BBB integrity (78). Since animal blood contains low level of LPS, derived from intestinal microbiota, as well as oxidatively modified lipids, we consider that loss of BBB integrity might cause extravasation of blood LPS and/or oxidatively modified lipids into the brain parenchyma and trigger caspase-4 activation and inflammatory responses in microglial cells. From this perspective, it is also interesting to consider metabolic risk associated with AD, for example as hyperinsulinemia (79), which leads to altered glucose metabolism in the brain (80). Consumption of high-fat diet has been shown to induce an increase in the level of blood LPS in mice and humans (and likely endogenous oxidatively modified lipids as well), leading to metabolic endotoxemia, and insulin resistance (81–84). Since caspase-4 is expressed in peripheral immune cells such as macrophages (27), it is tempting to speculate that caspase-4 in part mediates such response to peripheral endotoxemia.
Other studies have shown, although inconsistently, the presence of infectious pathogens in the brains of AD (85,86). These pathogens include virus, fungi and LPS-bearing gram-negative bacteria such as Chlamydophila pneumoniae, spirochetes, and Porphyromonas gingivalis. We and others have recently shown that cytosolic bacteria can induce inflammatory response through caspase-4 (33,34), and we speculate that these intracellular bacteria might potentially be means to activate caspase-4 in the brain of AD and contribute to inflammatory processes and cognitive impairments.
In summary, we have provided evidence that induction of caspase-4 expression is relevant in the aetiology of AD using human, mouse in vivo and in vitro data. The presence of human caspase-4 worsened cognitive impairment and synaptic functions in the APP/PS1 mouse model of AD, and these changes were accompanied by increased microglial clustering to plaques and a shifting of the microglial cells toward a proinflammatory state. We hypothesize that caspase-4 could be a key molecule mediating deleterious effects of inflammatory stimuli (including amyloid deposits) during the early phases of AD pathogenesis. We suggest that further analysis of this pathway may enhance our understanding of AD pathobiology and potentially lead to the identification of novel targets for therapeutic interventions in AD. The recent demonstration that a loss of function gene variant of CASP7 — a gene that is downstream of CASP4 in our multidimensional pathway analyses (11) — is protective against LOAD (89), provides further, compelling support for our hypothesis.
Materials and Methods
Animals
All studies were approved by the Mount Sinai IACUC. The APP/PS1 (B6C3-Tg(APPswe,PSEN1dE9)85Dbo/J) (stock #004462) line was purchased from The Jackson laboratory (Bar Harbor, ME, USA), and crossed with human caspase-4 transgenic mice, denoted as CASP4, which we have recently described (27). Mice were genotyped by quantitative PCR using the Universal Probe Library (UPL; Roche Applied Science, Indianapolis, IN, USA) (Supplementary Material, Table S3). Hemizygous APP/PS1 mice were mated with hemizygous CASP4 mice to generate WT, APP/PS1, CASP4, or CASP4/APP/PS1 mice. Therefore, all transgenic mice used in the current study are hemizygous for transgenes. All mice were genotyped at weaning and genotypes re-confirmed after the completion of experiments. Only males were used in the current study. All assessments of animals and tissue were carried out blind to genotype.
Post-mortem LOAD gene coexpression
The methods for post-mortem gene expression analysis from late onset AD and non-demented controls have been previously described (11). Briefly, the post-mortem gene expression data was derived from Harvard Brain Tissue Resource Center, and consisted of 376 late onset Alzheimer's disease and 173 non-demented control subjects. All of the available samples and brain regions were analysed for a grand total of 1647 samples. RNA expression was quantified on custom microarrays consisting of 4720 control probes and 39579 probes for transcripts representing 25242 known and 14337 predicted genes. Gene expression data were generated using Rosetta Resolver software, and MATLAB. Data were controlled for demographic variables such as age, sex and ethnicity, and technical variables such as PMI, RIN and tissue pH. Bonferroni and Benjamini-Hochberg tests were used for correction of multiple testing.
Quantitative PCR
Total RNAs were isolated from whole brains of mice using the RNeasy® Mini Kit (Qiagen, Valencia, CA, USA) and cDNAs were synthesized using the Superscript3 First Strand Synthesis kit (Life Technologies, Grand Island, NY, USA). Quantitative PCR was performed using UPL probes (Supplementary Material, Table S1). Acquired data were loaded onto qBase Plus software (Biogazzele, Belgium) for data quality control and normalization. Hippocampus from 5 wildtype, 6 CASP4, 9 APP/PS1 and 5 CASP4/APP/PS1 were used for quantitative PCR analysis.
In silico analysis of promoters
Genomic sequences ranging from -900 to 100 base pairs relative to transcription start sites for human CASP4 (NM_001225), CASP5 (NM_004347), mouse Casp11 (NM_007609) and chimpanzee CASP4 (XM_008953765) analysed are shown in Supplemental file 1 in FASTA format. They were analysed using ClustalW, and BoxShade was used to indicate conserved bases.
Cell culture
HEK293T cells were maintained in DMEM with 10% foetal bovine serum and 1% penicillin/streptomycin. Mouse primary cortical neuron cultures were prepared from E15.5 mouse embryo according to published method. Briefly, embryonic brains were dissected out and forebrains were isolated. Brains were trypsinized and incubated at 37C for 10 min followed by trituration to dissociate into single cells. Cells were plated onto poly-D lysine coated plates for 7 or 14 days before harvesting proteins for immunoblot analysis. Astrocytes and microglia were derived from postnatal P2 brains. Dissected cortices devoid of meninges were trypsinized and dissociated. Cells were incubated in T75 flask for 2 weeks in RPMI containing FBS and penicillin/streptomycin. Flasks were shaken at 500 rpm for 10 min to detach microglial cells, while astrocytes remained attached. Detached microglia were collected and plated onto cell culture plates.
Human neural cells were derived from foetal brain tissue and were obtained from Clonexpress (Clonexpress, Gaithersburg, MD). Human neuronal cultures were derived from human neuronal progenitor cells by culturing in the presence of dibutyrtyl cAMP (100 μM), FGF (10 ng/ml) and EGF (10 ng/ml) for 14 days. Human astrocytes and microglia were cultured in DMEM/F12 medium containing 5% FBS and EGF (10 ng/ml for astrocytes) and MCSF (10 ng/ml for microglia).
Reporter assay
The dual luciferase assay was performed using the Dual-Luciferase Reporter Assay System (Promega, Madison, WI). HEK293T cells in 24-well plate were transfected with 0.5 μg of reporter plasmid and 0.05 μg of pRL-null with or without 1 μg of the Spi1 expression vector. At 30 hours post transfection, cells were lysed by 100 μl of 1x Passive lysis buffer with vigorous shaking. 10 μl of the resultant lysates were used to detect firefly and renilla luciferase activity by sequential addition of substrates and detection by LMax II 384 luminometer (Molecular Devices, Sunnyvale, CA).
Barnes maze
Animals were group housed with between 1 and 5 animals in each cage until 5 month of age, after which they were singly caged with 12/12 hour dark/light cycle and ad lib access to water and food. The Barnes maze was performed by placing each animal on the Barnes maze table containing 40 holes (AccuScan Instruments, Columbus, OH) and the movement of animals was tracked by EZ Video@ (AccuScan). Each animal was given 5 min for habituation/exploration on the table under intense light so that they were accustomed to the room and table, as well as extra- and intra-maze cues. Pre-training was performed by placing the mouse on the table under bright light so that it was able to recognize the presence of an escape hole. During pre-training, the animal was positioned at the edge of the escape hole at the start, and directed down that hole if they had not entered after 1 min. Training/Testing trials were started from the black start box with the animal placed in the centre of the table. Bright light from the ceiling served as a learning incentive to seek an escape box, which was located in 1 of the 40 holes. Trials were performed for each animal individually and the table was wiped with 10% ethanol to remove odours between trials. During training, each animal was allowed to find an escape hole using fixed visual cues on the wall. When animals found and entered the escape box within 5 min, they were left in the box for 1 min. If they failed to find the escape box within 5 min, animals were picked up by the tail and placed near the escape box to guide them to the box where they were allowed to remain for 1 min. After each trial, the maze and escape box were cleaned using perfume-free quatricide to remove odours and the table was rotated to eliminate the possibility of the use of intra-maze cues. Training sessions lasted 5 consecutive days, each consisting of 4 trials. Testing phases were run on two consecutive weeks, with acquisition trials during the first week and reversal trials during the second week, with the escape hole rotated by 180 degrees.
Rotarod
Rotarod test was performed as follows. At the outset, the rod was rotated at a speed of 4 rpm/min, and the test was initiated by accelerating the rod at the rate of 15 rpm/min for 150 s and the maximum speed at which animals fell was recorded. Three trials were performed for each animal and mean speed at fall was calculated.
Immunohistochemistry
After transcardial perfusion, brains were coronally sectioned at 50 µm thickness from rostral to caudal using a vibratome. Every 9th section was used for immunostaining microglia and deposited amyloid using the anti-Iba1 (Wako, Richmond, VA, USA) and 12F4 anti-Aβ42 (Covance, Princeton, NJ, USA) primary antibodies, respectively. Signals were enhanced with biotin conjugated secondary antibody followed by ABC (Vector Laboratories, Burlingame, CA, USA) with diaminobenzidine. For amyloid staining, sections were first treated with 98% formic acid for 7 min to retrieve antigen. After colour development, sections were dried on slides overnight followed by xylene treatment, and mounted with CytosealTM 60. For immunofluorescence staining, secondary antibody conjugated with Alexa Fluor 594 (Life Technologies) was used.
Quantitative stereology
Iba1-positive microglial cell number in the hippocampus was estimated using the optical fractionator method of StereoInvestigator (MBF Bioscience, Williston, VT, USA). Hippocampus was coronally sliced using a vibratome to 50 μm thickness and every 9th section was taken for immunostaining. Hippocampal area was traced using an Olympus PlanFI 4x/0.13 objective lens on an Olympus BX51 microscope and a UplanApo 40x/1.00 objective lens was used for cell counting. Sampling grids (500µm×400µm) were randomly placed over the hippocampal region, and contained an optical disector (80µm×80µm), within which cell numbers were counted. 1 µm guard zone was set from the top and the bottom of the section. For the estimation of microglial association with amyloid, microglial cells that made direct contact with thioflavin reactive plaques through their soma or processes were manually counted in z-stacked confocal images. A total of 15-30 plaques from three equally spaced hippocampal slices were analysed for each animal.
Amyloid volume analysis
All volume fraction estimation was done on images acquired with an Aperio ScanScope CS system using a 20x/0.75NA PlanApo objective (0.5 µm pixel resolution) using stereological methods as follows. A point-grid was superimposed on the image in a random XY location, and points over amyloid deposition were characterized as being over either dense or diffuse amyloid. Point spacing was optimized for each region, generally at 30 µm for CA1 and CA3, 20 µm for DG and Subiculum, and 10 µm for Hilus. The limited amount of vascular amyloid present was measured using a 2D approximation of a stereological method, with intersections recorded between amyloid and randomly-oriented superimposed test lines. Anatomical definitions included the CA2 region with CA3, and all other methods were as previously described, including the CE calculation (87).
Quantitation of soluble amyloid
Whole cortices were homogenized in phosphate buffered saline containing protease inhibitor cocktail. Lysates were centrifuged at 100,000g for 1 hour and supernatants were subjected to amyloid 40 or 42 ELISA (Wako Chemicals, Richmond, VA) following the provided instructions.
Hippocampal slice electrophysiology
Hippocampal slices (350 µm) were prepared from 13 month-old CASP4, APP/PS1, APP/PS1/CASP4 mice and their wild-type littermate controls. A total of 5 animals were used for each genotype. Slices were perfused with Ringer’s solution containing (in mM): NaCl, 125.0; KCl, 2.5; MgSO4, 1.3; NaH2PO4, 1.0; NaHCO3, 26.2; CaCl2, 2.5; glucose, 11.0 and bubbled with 95% O2/5% CO2, at 32 °C. A solution containing 3 M NaCl was used for the extracellular recording pipette. Field excitatory postsynaptic potentials (fEPSPs) were recorded from stratum radiatum in area CA1, evoked by stimulation of the Schaffer collaterals (100 µs pulses every 30 s) with bipolar tungsten electrodes placed into area CA3 (88). The EPSP initial slope (mV/ms) was determined from the average waveform of four consecutive responses. The mean slope of the input-output function was calculated from each slope against the stimulus intensity. Long-term potentiation (LTP) was induced by a high-frequency stimulus (four trains of 100 Hz, 1 s stimulation separated by 5 min).
Statistics
All statistical analyses were performed using SPSS version 20 (IBM Corporation, Somers, NY, USA) as detailed in the text. Gene expression data were analysed by one-way ANOVA followed by Bonferroni post-hoc testing. Barnes maze data were analysed by repeated-measures ANOVA with genotype as the between subject factor and trial day as the repeated measure. The Huynh-Feldt adjustment (ϵ) was used for degrees of freedom and p-values due to violation of sphericity assumptions. When there were differences among four genotypes, Dunnett's procedure was used to compare results for wildtype animals with each of three other genotypes. Human soluble Aβ data were analysed by one-way ANOVA (CASP4 genotype). Gene expression data were analysed by two-way ANOVA (APP/PS1 x CASP4 geotype), or one-way ANOVA followed by Bonferroni post hoc testing.
Supplementary Material
Supplementary Material is available at HMG online.
Acknowledgements
JDB is the G. Harold and Leila Y. Mathers Professor of Geriatrics and Adult Development.
Conflict of Interest statement. None declared.
Funding
This work was supported by the National Institute on Aging [AG046170, MPI, Dr. E Shadt, B Zhang and JD Buxbaum]; and the Icahn School of Medicine at Mount Sinai Alzheimer Disease Research Center [AG005138-28, Dr. Mary Sano, PI, Drs. O Bozdagi and JD Buxbaum, PL].
References
- 1.Hardy J.A., Higgins G.A. (1992) Alzheimer's disease: the amyloid cascade hypothesis. Science, 256, 184–185. [DOI] [PubMed] [Google Scholar]
- 2.O'Brien R.J., Wong P.C. (2011) Amyloid precursor protein processing and Alzheimer's disease. Annu. Rev. Neurosci., 34, 185–204. [DOI] [PMC free article] [PubMed] [Google Scholar]
- 3.Jonsson T., Atwal J.K., Steinberg S., Snaedal J., Jonsson P.V., Bjornsson S., Stefansson H., Sulem P., Gudbjartsson D., Maloney J., et al. (2012) A mutation in APP protects against Alzheimer's disease and age-related cognitive decline. Nature, 488, 96–99. [DOI] [PubMed] [Google Scholar]
- 4.McGeer P.L., Itagaki S., Tago H., McGeer E.G. (1987) Reactive microglia in patients with senile dementia of the Alzheimer type are positive for the histocompatibility glycoprotein HLA-DR. Neurosci. Lett., 79, 195–200. [DOI] [PubMed] [Google Scholar]
- 5.Guerreiro R., Wojtas A., Bras J., Carrasquillo M., Rogaeva E., Majounie E., Cruchaga C., Sassi C., Kauwe J.S., Younkin S., et al. (2013) TREM2 variants in Alzheimer's disease. N. Engl. J. Med., 368, 117–127. [DOI] [PMC free article] [PubMed] [Google Scholar]
- 6.Jonsson T., Stefansson H., Steinberg S., Jonsdottir I., Jonsson P.V., Snaedal J., Bjornsson S., Huttenlocher J., Levey A.I., Lah J.J., et al. (2013) Variant of TREM2 associated with the risk of Alzheimer's disease. N. Engl. J. Med., 368, 107–116. [DOI] [PMC free article] [PubMed] [Google Scholar]
- 7.Neumann H., Daly M.J. (2013) Variant TREM2 as risk factor for Alzheimer's disease. N. Engl. J. Med., 368, 182–184. [DOI] [PubMed] [Google Scholar]
- 8.Katsel P., Tan W., Haroutunian V. (2009) Gain in brain immunity in the oldest-old differentiates cognitively normal from demented individuals. PLoS One, 4, e7642.. [DOI] [PMC free article] [PubMed] [Google Scholar]
- 9.Miller J.A., Woltjer R.L., Goodenbour J.M., Horvath S., Geschwind D.H. (2013) Genes and pathways underlying regional and cell type changes in Alzheimer's disease. Genome Med., 5, 48.. [DOI] [PMC free article] [PubMed] [Google Scholar]
- 10.Miller J.A., Oldham M.C., Geschwind D.H. (2008) A systems level analysis of transcriptional changes in Alzheimer's disease and normal aging. J. Neurosci., 28, 1410–1420. [DOI] [PMC free article] [PubMed] [Google Scholar]
- 11.Zhang B., Gaiteri C., Bodea L.G., Wang Z., McElwee J., Podtelezhnikov A.A., Zhang C., Xie T., Tran L., Dobrin R., et al. (2013) Integrated systems approach identifies genetic nodes and networks in late-onset Alzheimer's disease. Cell, 153, 707–720. [DOI] [PMC free article] [PubMed] [Google Scholar]
- 12.Ginhoux F., Greter M., Leboeuf M., Nandi S., See P., Gokhan S., Mehler M.F., Conway S.J., Ng L.G., Stanley E.R., et al. (2010) Fate mapping analysis reveals that adult microglia derive from primitive macrophages. Science, 330, 841–845. [DOI] [PMC free article] [PubMed] [Google Scholar]
- 13.Kierdorf K., Erny D., Goldmann T., Sander V., Schulz C., Perdiguero E.G., Wieghofer P., Heinrich A., Riemke P., Holscher C., et al. (2013) Microglia emerge from erythromyeloid precursors via Pu.1- and Irf8-dependent pathways. Nat. Neurosci., 16, 273–280. [DOI] [PubMed] [Google Scholar]
- 14.Aguzzi A., Barres B.A., Bennett M.L. (2013) Microglia: scapegoat, saboteur, or something else? Science, 339, 156–161. [DOI] [PMC free article] [PubMed] [Google Scholar]
- 15.Kettenmann H., Kirchhoff F., Verkhratsky A. (2013) Microglia: new roles for the synaptic stripper. Neuron, 77, 10–18. [DOI] [PubMed] [Google Scholar]
- 16.Wyss-Coray T., Rogers J. (2012) Inflammation in Alzheimer disease-a brief review of the basic science and clinical literature. Cold Spring Harb. Perspect Med., 2, a006346.. [DOI] [PMC free article] [PubMed] [Google Scholar]
- 17.Meyer-Luehmann M., Spires-Jones T.L., Prada C., Garcia-Alloza M., de Calignon A., Rozkalne A., Koenigsknecht-Talboo J., Holtzman D.M., Bacskai B.J., Hyman B.T. (2008) Rapid appearance and local toxicity of amyloid-beta plaques in a mouse model of Alzheimer's disease. Nature, 451, 720–724. [DOI] [PMC free article] [PubMed] [Google Scholar]
- 18.Lee C.Y., Landreth G.E. (2010) The role of microglia in amyloid clearance from the AD brain. J. Neural Transm., 117, 949–960. [DOI] [PMC free article] [PubMed] [Google Scholar]
- 19.Yamanaka M., Ishikawa T., Griep A., Axt D., Kummer M.P., Heneka M.T. (2012) PPARgamma/RXRalpha-induced and CD36-mediated microglial amyloid-beta phagocytosis results in cognitive improvement in amyloid precursor protein/presenilin 1 mice. J. Neurosci., 32, 17321–17331. [DOI] [PMC free article] [PubMed] [Google Scholar]
- 20.Allan S.M., Tyrrell P.J., Rothwell N.J. (2005) Interleukin-1 and neuronal injury. Nat. Rev. Immunol., 5, 629–640. [DOI] [PubMed] [Google Scholar]
- 21.Koenigsknecht J., Landreth G. (2004) Microglial phagocytosis of fibrillar beta-amyloid through a beta1 integrin-dependent mechanism. J. Neurosci., 24, 9838–9846. [DOI] [PMC free article] [PubMed] [Google Scholar]
- 22.Yamasaki R., Lu H., Butovsky O., Ohno N., Rietsch A.M., Cialic R., Wu P.M., Doykan C.E., Lin J., Cotleur A.C., et al. (2014) Differential roles of microglia and monocytes in the inflamed central nervous system. J. Exp. Med., 211, 1533–1549. [DOI] [PMC free article] [PubMed] [Google Scholar]
- 23.Simard A.R., Soulet D., Gowing G., Julien J.P., Rivest S. (2006) Bone marrow-derived microglia play a critical role in restricting senile plaque formation in Alzheimer's disease. Neuron, 49, 489–502. [DOI] [PubMed] [Google Scholar]
- 24.Ritzel R.M., Patel A.R., Grenier J.M., Crapser J., Verma R., Jellison E.R., McCullough L.D. (2015) Functional differences between microglia and monocytes after ischemic stroke. J. Neuroinflammation, 12, 106.. [DOI] [PMC free article] [PubMed] [Google Scholar]
- 25.Kajiwara Y., Akram A., Katsel P., Haroutunian V., Schmeidler J., Beecham G., Haines J.L., Pericak-Vance M.A., Buxbaum J.D. (2009) FE65 binds Teashirt, inhibiting expression of the primate-specific caspase-4. PLoS One, 4, e5071.. [DOI] [PMC free article] [PubMed] [Google Scholar]
- 26.Lakshmanan U., Porter A.G. (2007) Caspase-4 interacts with TNF receptor-associated factor 6 and mediates lipopolysaccharide-induced NF-kappaB-dependent production of IL-8 and CC chemokine ligand 4 (macrophage-inflammatory protein-1). J. Immunol., 179, 8480–8490. [DOI] [PubMed] [Google Scholar]
- 27.Kajiwara Y., Schiff T., Voloudakis G., Gama Sosa M.A., Elder G., Bozdagi O., Buxbaum J.D. (2014) A Critical Role for Human Caspase-4 in Endotoxin Sensitivity. J Immunol. [DOI] [PMC free article] [PubMed] [Google Scholar]
- 28.Shi J., Zhao Y., Wang Y., Gao W., Ding J., Li P., Hu L., Shao F. (2014) Inflammatory caspases are innate immune receptors for intracellular LPS. Nature, 514, 187–192. [DOI] [PubMed] [Google Scholar]
- 29.Shi J., Zhao Y., Wang K., Shi X., Wang Y., Huang H., Zhuang Y., Cai T., Wang F., Shao F. (2015) Cleavage of GSDMD by inflammatory caspases determines pyroptotic cell death. Nature, 526, 660–665. [DOI] [PubMed] [Google Scholar]
- 30.Kayagaki N., Stowe I.B., Lee B.L., O'Rourke K., Anderson K., Warming S., Cuellar T., Haley B., Roose-Girma M., Phung Q.T., et al. (2015) Caspase-11 cleaves gasdermin D for non-canonical inflammasome signalling. Nature, 526, 666–671. [DOI] [PubMed] [Google Scholar]
- 31.Baker P.J., Boucher D., Bierschenk D., Tebartz C., Whitney P.G., D'Silva D.B., Tanzer M.C., Monteleone M., Robertson A.A., Cooper M.A., et al. (2015) NLRP3 inflammasome activation downstream of cytoplasmic LPS recognition by both caspase-4 and caspase-5. Eur. J. Immunol., 45, 2918–2926. [DOI] [PubMed] [Google Scholar]
- 32.Schmid-Burgk J.L., Gaidt M.M., Schmidt T., Ebert T.S., Bartok E., Hornung V. (2015) Caspase-4 mediates non-canonical activation of the NLRP3 inflammasome in human myeloid cells. Eur. J. Immunol., 45, 2911–2917. [DOI] [PubMed] [Google Scholar]
- 33.Casson C.N., Yu J., Reyes V.M., Taschuk F.O., Yadav A., Copenhaver A.M., Nguyen H.T., Collman R.G., Shin S. (2015) Human caspase-4 mediates noncanonical inflammasome activation against gram-negative bacterial pathogens. Proc. Natl Acad. Sci. U S A, 112, 6688–6693. [DOI] [PMC free article] [PubMed] [Google Scholar]
- 34.Aachoui Y., Kajiwara Y., Leaf I.A., Mao D., Ting J.P., Coers J., Aderem A., Buxbaum J.D., Miao E.A. (2015) Canonical Inflammasomes Drive IFN-gamma to Prime Caspase-11 in Defense against a Cytosol-Invasive Bacterium. Cell Host Microbe, 18, 320–332. [DOI] [PMC free article] [PubMed] [Google Scholar]
- 35.Halle A., Hornung V., Petzold G.C., Stewart C.R., Monks B.G., Reinheckel T., Fitzgerald K.A., Latz E., Moore K.J., Golenbock D.T. (2008) The NALP3 inflammasome is involved in the innate immune response to amyloid-beta. Nat. Immunol., 9, 857–865. [DOI] [PMC free article] [PubMed] [Google Scholar]
- 36.Heneka M.T., Kummer M.P., Stutz A., Delekate A., Schwartz S., Vieira-Saecker A., Griep A., Axt D., Remus A., Tzeng T.C., et al. (2013) NLRP3 is activated in Alzheimer's disease and contributes to pathology in APP/PS1 mice. Nature, 493, 674–678. [DOI] [PMC free article] [PubMed] [Google Scholar]
- 37.Li J., Brieher W.M., Scimone M.L., Kang S.J., Zhu H., Yin H., von Andrian U.H., Mitchison T., Yuan J. (2007) Caspase-11 regulates cell migration by promoting Aip1-Cofilin-mediated actin depolymerization. Nat. Cell Biol., 9, 276–286. [DOI] [PubMed] [Google Scholar]
- 38.Lambert J.C., Heath S., Even G., Campion D., Sleegers K., Hiltunen M., Combarros O., Zelenika D., Bullido M.J., Tavernier B., et al. (2009) Genome-wide association study identifies variants at CLU and CR1 associated with Alzheimer's disease. Nat. Genet., 41, 1094–1099. [DOI] [PubMed] [Google Scholar]
- 39.Hollingworth P., Harold D., Sims R., Gerrish A., Lambert J.C., Carrasquillo M.M., Abraham R., Hamshere M.L., Pahwa J.S., Moskvina V., et al. (2011) Common variants at ABCA7, MS4A6A/MS4A4E, EPHA1, CD33 and CD2AP are associated with Alzheimer's disease. Nat. Genet., 43, 429–435. [DOI] [PMC free article] [PubMed] [Google Scholar]
- 40.Naj A.C., Jun G., Beecham G.W., Wang L.S., Vardarajan B.N., Buros J., Gallins P.J., Buxbaum J.D., Jarvik G.P., Crane P.K., et al. (2011) Common variants at MS4A4/MS4A6E, CD2AP, CD33 and EPHA1 are associated with late-onset Alzheimer's disease. Nat. Genet., 43, 436–441. [DOI] [PMC free article] [PubMed] [Google Scholar]
- 41.Liang Y., Tedder T.F. (2001) Identification of a CD20-, FcepsilonRIbeta-, and HTm4-related gene family: sixteen new MS4A family members expressed in human and mouse. Genomics, 72, 119–127. [DOI] [PubMed] [Google Scholar]
- 42.Chen E.Y., Tan C.M., Kou Y., Duan Q., Wang Z., Meirelles G.V., Clark N.R., Ma'ayan A. (2013) Enrichr: interactive and collaborative HTML5 gene list enrichment analysis tool. BMC Bioinformatics, 14, 128.. [DOI] [PMC free article] [PubMed] [Google Scholar]
- 43.Zhang Y., Chen K., Sloan S.A., Bennett M.L., Scholze A.R., O'Keeffe S., Phatnani H.P., Guarnieri P., Caneda C., Ruderisch N., et al. (2014) An RNA-sequencing transcriptome and splicing database of glia, neurons, and vascular cells of the cerebral cortex. J. Neurosci., 34, 11929–11947. [DOI] [PMC free article] [PubMed] [Google Scholar]
- 44.Zhang Y., Sloan S.A., Clarke L.E., Caneda C., Plaza C.A., Blumenthal P.D., Vogel H., Steinberg G.K., Edwards M.S., Li G., et al. (2016) Purification and Characterization of Progenitor and Mature Human Astrocytes Reveals Transcriptional and Functional Differences with Mouse. Neuron, 89, 37–53. [DOI] [PMC free article] [PubMed] [Google Scholar]
- 45.Savonenko A., Xu G.M., Melnikova T., Morton J.L., Gonzales V., Wong M.P., Price D.L., Tang F., Markowska A.L., Borchelt D.R. (2005) Episodic-like memory deficits in the APPswe/PS1dE9 mouse model of Alzheimer's disease: relationships to beta-amyloid deposition and neurotransmitter abnormalities. Neurobiol Dis., 18, 602–617. [DOI] [PubMed] [Google Scholar]
- 46.Reiserer R.S., Harrison F.E., Syverud D.C., McDonald M.P. (2007) Impaired spatial learning in the APPSwe + PSEN1DeltaE9 bigenic mouse model of Alzheimer's disease. Genes Brain Behav., 6, 54–65. [DOI] [PubMed] [Google Scholar]
- 47.Ma T., Hoeffer C.A., Wong H., Massaad C.A., Zhou P., Iadecola C., Murphy M.P., Pautler R.G., Klann E. (2011) Amyloid beta-induced impairments in hippocampal synaptic plasticity are rescued by decreasing mitochondrial superoxide. J. Neurosci., 31, 5589–5595. [DOI] [PMC free article] [PubMed] [Google Scholar]
- 48.Hong X., Liu J., Zhu G., Zhuang Y., Suo H., Wang P., Huang D., Xu J., Huang Y., Yu M., et al. (2014) Parkin overexpression ameliorates hippocampal long-term potentiation and beta-amyloid load in an Alzheimer's disease mouse model. Hum. Mol. Genet., 23, 1056–1072. [DOI] [PubMed] [Google Scholar]
- 49.Iwasaki H., Somoza C., Shigematsu H., Duprez E.A., Iwasaki-Arai J., Mizuno S., Arinobu Y., Geary K., Zhang P., Dayaram T., et al. (2005) Distinctive and indispensable roles of PU.1 in maintenance of hematopoietic stem cells and their differentiation. Blood, 106, 1590–1600. [DOI] [PMC free article] [PubMed] [Google Scholar]
- 50.Satoh J., Asahina N., Kitano S., Kino Y. (2014) A Comprehensive Profile of ChIP-Seq-Based PU.1/Spi1 Target Genes in Microglia. Gene Regul. Syst. Bio., 8, 127–139. [DOI] [PMC free article] [PubMed] [Google Scholar]
- 51.Miller J.A., Horvath S., Geschwind D.H. (2010) Divergence of human and mouse brain transcriptome highlights Alzheimer disease pathways. Proc. Natl Acad. Sci. U S A, 107, 12698–12703. [DOI] [PMC free article] [PubMed] [Google Scholar]
- 52.Eichenbaum H. (2004) Hippocampus: cognitive processes and neural representations that underlie declarative memory. Neuron, 44, 109–120. [DOI] [PubMed] [Google Scholar]
- 53.Hodges J.R., Salmon D.P., Butters N. (1990) Differential impairment of semantic and episodic memory in Alzheimer's and Huntington's diseases: a controlled prospective study. J. Neurol. Neurosurg. Psychiat., 53, 1089–1095. [DOI] [PMC free article] [PubMed] [Google Scholar]
- 54.Gallagher M., Koh M.T. (2011) Episodic memory on the path to Alzheimer's disease. Curr. Opin. Neurobiol., 21, 929–934. [DOI] [PMC free article] [PubMed] [Google Scholar]
- 55.Graves A.B., Bowen J.D., Rajaram L., McCormick W.C., McCurry S.M., Schellenberg G.D., Larson E.B. (1999) Impaired olfaction as a marker for cognitive decline: interaction with apolipoprotein E epsilon4 status. Neurology, 53, 1480–1487. [DOI] [PubMed] [Google Scholar]
- 56.Wilson R.S., Schneider J.A., Arnold S.E., Tang Y., Boyle P.A., Bennett D.A. (2007) Olfactory identification and incidence of mild cognitive impairment in older age. Arch. Gen. Psychiat., 64, 802–808. [DOI] [PubMed] [Google Scholar]
- 57.Paresce D.M., Chung H., Maxfield F.R. (1997) Slow degradation of aggregates of the Alzheimer's disease amyloid beta-protein by microglial cells. J. Biol. Chem., 272, 29390–29397. [DOI] [PubMed] [Google Scholar]
- 58.Chung H., Brazil M.I., Soe T.T., Maxfield F.R. (1999) Uptake, degradation, and release of fibrillar and soluble forms of Alzheimer's amyloid beta-peptide by microglial cells. J. Biol. Chem., 274, 32301–32308. [DOI] [PubMed] [Google Scholar]
- 59.Majumdar A., Chung H., Dolios G., Wang R., Asamoah N., Lobel P., Maxfield F.R. (2008) Degradation of fibrillar forms of Alzheimer's amyloid beta-peptide by macrophages. Neurobiol. Aging, 29, 707–715. [DOI] [PMC free article] [PubMed] [Google Scholar]
- 60.El Khoury J., Toft M., Hickman S.E., Means T.K., Terada K., Geula C., Luster A.D. (2007) Ccr2 deficiency impairs microglial accumulation and accelerates progression of Alzheimer-like disease. Nat. Med., 13, 432–438. [DOI] [PubMed] [Google Scholar]
- 61.Varvel N.H., Grathwohl S.A., Degenhardt K., Resch C., Bosch A., Jucker M., Neher J.J. (2015) Replacement of brain-resident myeloid cells does not alter cerebral amyloid-beta deposition in mouse models of Alzheimer's disease. J. Exp. Med., 212, 1803–1809. [DOI] [PMC free article] [PubMed] [Google Scholar]
- 62.Spangenberg E.E., Lee R.J., Najafi A.R., Rice R.A., Elmore M.R., Blurton-Jones M., West B.L., Green K.N. (2016) Eliminating microglia in Alzheimer's mice prevents neuronal loss without modulating amyloid-beta pathology. Brain 139(Pt 4):1265–1281. [DOI] [PMC free article] [PubMed] [Google Scholar]
- 63.Mestas J., Hughes C.C. (2004) Of mice and not men: differences between mouse and human immunology. J. Immunol., 172, 2731–2738. [DOI] [PubMed] [Google Scholar]
- 64.Vitek M.P., Brown C., Xu Q., Dawson H., Mitsuda N., Colton C.A. (2006) Characterization of NO and cytokine production in immune-activated microglia and peritoneal macrophages derived from a mouse model expressing the human NOS2 gene on a mouse NOS2 knockout background. Antioxid. Redox Signal., 8, 893–901. [DOI] [PubMed] [Google Scholar]
- 65.Kan M.J., Lee J.E., Wilson J.G., Everhart A.L., Brown C.M., Hoofnagle A.N., Jansen M., Vitek M.P., Gunn M.D., Colton C.A. (2015) Arginine deprivation and immune suppression in a mouse model of Alzheimer's disease. J. Neurosci., 35, 5969–5982. [DOI] [PMC free article] [PubMed] [Google Scholar]
- 66.Levy-Gigi E., Kelemen O., Gluck M.A., Keri S. (2011) Impaired context reversal learning, but not cue reversal learning, in patients with amnestic mild cognitive impairment. Neuropsychologia, 49, 3320–3326. [DOI] [PubMed] [Google Scholar]
- 67.de Leon M.J., George A.E., Stylopoulos L.A., Smith G., Miller D.C. (1989) Early marker for Alzheimer's disease: the atrophic hippocampus. Lancet, 2, 672–673. [DOI] [PubMed] [Google Scholar]
- 68.Myers C.E., Kluger A., Golomb J., Ferris S., de Leon M.J., Schnirman G., Gluck M.A. (2002) Hippocampal atrophy disrupts transfer generalization in nondemented elderly. J. Geriatr. Psychiat. Neurol., 15, 82–90. [DOI] [PubMed] [Google Scholar]
- 69.Hooijmans C.R., Van der Zee C.E., Dederen P.J., Brouwer K.M., Reijmer Y.D., van Groen T., Broersen L.M., Lutjohann D., Heerschap A., Kiliaan A.J. (2009) DHA and cholesterol containing diets influence Alzheimer-like pathology, cognition and cerebral vasculature in APPswe/PS1dE9 mice. Neurobiol. Dis., 33, 482–498. [DOI] [PubMed] [Google Scholar]
- 70.Montgomery K.S., Simmons R.K., Edwards G., 3rd, Nicolle M.M., Gluck M.A., Myers C.E., Bizon J.L. (2011) Novel age-dependent learning deficits in a mouse model of Alzheimer's disease: implications for translational research. Neurobiol. Aging, 32, 1273–1285. [DOI] [PMC free article] [PubMed] [Google Scholar]
- 71.Tremblay M.E., Majewska A.K. (2011) A role for microglia in synaptic plasticity? Commun. Integr. Biol., 4, 220–222. [DOI] [PMC free article] [PubMed] [Google Scholar]
- 72.Tanaka S., Kondo H., Kanda K., Ashino T., Nakamachi T., Sekikawa K., Iwakura Y., Shioda S., Numazawa S., Yoshida T. (2011) Involvement of interleukin-1 in lipopolysaccaride-induced microglial activation and learning and memory deficits. J. Neurosci. Res., 89, 506–514. [DOI] [PubMed] [Google Scholar]
- 73.Parkhurst C.N., Yang G., Ninan I., Savas J.N., Yates J.R., 3rd, Lafaille J.J., Hempstead B.L., Littman D.R., Gan W.B. (2013) Microglia promote learning-dependent synapse formation through brain-derived neurotrophic factor. Cell, 155, 1596–1609. [DOI] [PMC free article] [PubMed] [Google Scholar]
- 74.Kalaria R.N. (1999) The blood-brain barrier and cerebrovascular pathology in Alzheimer's disease. Ann. N Y Acad. Sci., 893, 113–125. [DOI] [PubMed] [Google Scholar]
- 75.Kalaria R.N. (2000) The role of cerebral ischemia in Alzheimer's disease. Neurobiol Aging, 21, 321–330. [DOI] [PubMed] [Google Scholar]
- 76.Schneider J.A., Wilson R.S., Bienias J.L., Evans D.A., Bennett D.A. (2004) Cerebral infarctions and the likelihood of dementia from Alzheimer disease pathology. Neurology, 62, 1148–1155. [DOI] [PubMed] [Google Scholar]
- 77.Montagne A., Barnes S.R., Sweeney M.D., Halliday M.R., Sagare A.P., Zhao Z., Toga A.W., Jacobs R.E., Liu C.Y., Amezcua L., et al. (2015) Blood-brain barrier breakdown in the aging human hippocampus. Neuron, 85, 296–302. [DOI] [PMC free article] [PubMed] [Google Scholar]
- 78.Minogue A.M., Jones R.S., Kelly R.J., McDonald C.L., Connor T.J., Lynch M.A. (2014) Age-associated dysregulation of microglial activation is coupled with enhanced blood-brain barrier permeability and pathology in APP/PS1 mice. Neurobiol Aging, 35, 1442–1452. [DOI] [PubMed] [Google Scholar]
- 79.Luchsinger J.A., Tang M.X., Shea S., Mayeux R. (2004) Hyperinsulinemia and risk of Alzheimer disease. Neurology, 63, 1187–1192. [DOI] [PubMed] [Google Scholar]
- 80.Willette A.A., Bendlin B.B., Starks E.J., Birdsill A.C., Johnson S.C., Christian B.T., Okonkwo O.C., La Rue A., Hermann B.P., Koscik R.L., et al. (2015) Association of Insulin Resistance With Cerebral Glucose Uptake in Late Middle-Aged Adults at Risk for Alzheimer Disease. JAMA Neurol., 72, 1013–1020. [DOI] [PMC free article] [PubMed] [Google Scholar]
- 81.Cani P.D., Bibiloni R., Knauf C., Waget A., Neyrinck A.M., Delzenne N.M., Burcelin R. (2008) Changes in gut microbiota control metabolic endotoxemia-induced inflammation in high-fat diet-induced obesity and diabetes in mice. Diabetes, 57, 1470–1481. [DOI] [PubMed] [Google Scholar]
- 82.Cani P.D., Amar J., Iglesias M.A., Poggi M., Knauf C., Bastelica D., Neyrinck A.M., Fava F., Tuohy K.M., Chabo C., et al. (2007) Metabolic endotoxemia initiates obesity and insulin resistance. Diabetes, 56, 1761–1772. [DOI] [PubMed] [Google Scholar]
- 83.Erridge C., Attina T., Spickett C.M., Webb D.J. (2007) A high-fat meal induces low-grade endotoxemia: evidence of a novel mechanism of postprandial inflammation. Am. J. Clin. Nutr., 86, 1286–1292. [DOI] [PubMed] [Google Scholar]
- 84.Mehta N.N., McGillicuddy F.C., Anderson P.D., Hinkle C.C., Shah R., Pruscino L., Tabita-Martinez J., Sellers K.F., Rickels M.R., Reilly M.P. (2010) Experimental endotoxemia induces adipose inflammation and insulin resistance in humans. Diabetes, 59, 172–181. [DOI] [PMC free article] [PubMed] [Google Scholar]
- 85.Maheshwari P., Eslick G.D. (2015) Bacterial infection and Alzheimer's disease: a meta-analysis. J. Alzheimers Dis., 43, 957–966. [DOI] [PubMed] [Google Scholar]
- 86.Itzhaki R.F., Lathe R., Balin B.J., Ball M.J., Bearer E.L., Braak H., Bullido M.J., Carter C., Clerici M., Cosby S.L., et al. (2016) Microbes and Alzheimer's Disease. J. Alzheimers Dis., 51, 979–984. [DOI] [PMC free article] [PubMed] [Google Scholar]
- 87.Long J.M., Kalehua A.N., Muth N.J., Calhoun M.E., Jucker M., Hengemihle J.M., Ingram D.K., Mouton P.R. (1998) Stereological analysis of astrocyte and microglia in aging mouse hippocampus. Neurobiol. Aging, 19, 497–503. [DOI] [PubMed] [Google Scholar]
- 88.Bozdagi O., Sakurai T., Papapetrou D., Wang X., Dickstein D.L., Takahashi N., Kajiwara Y., Yang M., Katz A.M., Scattoni M.L., et al. (2010) Haploinsufficiency of the autism-associated Shank3 gene leads to deficits in synaptic function, social interaction, and social communication. Mol. Autism, 1, 15.. [DOI] [PMC free article] [PubMed] [Google Scholar]
- 89.Ayers K.L., Mirshahi U.L., Wardeh A.H., Murray M.F., Hao K., Glicksberg B.S., Li S., Carey D.J., Chen R. (2016) A loss of function variant in CASP7 protects against Alzheimer's disease in homozygous APOE e4 allele carriers. BMC Genomics, 17(Suppl 2): 445.. [DOI] [PMC free article] [PubMed] [Google Scholar]