Abstract
Metaproteomics is one approach to analyze the functional capacity of the gut microbiome but is limited by the ability to evenly extract proteins from diverse organisms within the gut. Herein, we have developed a pipeline to optimize sample preparation of stool obtained from germ-free (GF) mice that were gavaged a defined community of 11 bacterial strains isolated from the human gut. With 64% more proteins identified, bead-beating was confirmed to be an indispensable step for the extraction of bacterial proteins, especially for Gram-positive bacteria. Bacterial enrichment from mouse fecal samples was further optimized by evaluating three different methods: (1) a high-speed differential centrifugation (HCE) or (2) a low-speed differential centrifugation (LCE) and (3) a filter-aided method (FA). The HCE method was associated with dramatic loss of bacteria and 71% less recovery of bacterial proteins than the LCE method. Compared with LCE, the FA method also showed dramatic loss of the amount of bacteria recovered and decreased protein identifications from Gram-positive bacteria in the stool samples. Ultimately, LCE may provide an alternative and complementary method for enriching bacteria from small amounts of mouse fecal samples, which could aid in investigating bacterial function in health and disease.
Keywords: metaproteome, bead-beating, protein extraction, microbial enrichment, LC−MS/MS
INTRODUCTION
The human intestinal tract harbors trillions of microbes, representing over 1000 bacterial species, which play a significant role in both intestinal health and disease.1 Abnormal alterations in the composition of the gut microbiome, also known as dysbiosis, have been implicated not only in intestinal pathology but also in cardiovascular disease and obesity.2 In contrast, in the absence of dysbiosis, the gut microbiota could largely benefit the host by promoting the development of the gut immune system, facilitating dietary metabolism and preventing pathogen colonization.3,4 Human microbiome studies have demonstrated that there is significant diversity in the membership of individual gut communities, but the functional pathways represented by community metagenomes were less variable and more uniform, suggesting some level of redundancy in the gut microbiome.5 Similarly, studies of lean and obese twins have also demonstrated that despite interindividual variability in the composition of the gut microbiota, the genes represented have common functionalities, and deviations from this core microbiome on a functional level are associated with disease.6 Thus, understanding what genes are expressed by the gut microbiome will likely provide important insight into how changes in the gut microbiota that lead to dysbiosis can contribute to disease pathology.
Metaproteomics studies allow the understanding of the actual expression of genes from the gut microbiota by the detection and identification of proteins in a sample by mass spectrometry (MS);7−9 however, an important consideration is to effectively enrich bacteria from fecal samples and extract microbial proteins from a sample that evenly represents all bacteria. In the current study, we humanized the microbiome of GF mice by orally administering a simple community of 11 bacterial strains that have been isolated from the human gut. Bacterial strains were selected to represent some of the major phylotypes found in the human gut and consist of both Gram-positive and Gram-negative bacteria that have different cell-wall components. To identify the functional expression of these bacteria by mass spectrometry, we optimized a method to enrich these bacteria from stool samples while removing host mouse proteins that allowed the measurement of the functional expression of these bacteria by mass spectrometry.
With advances in mass spectrometry and proteome bioinformatics, several studies have successfully applied the metaproteomics approach to analyze bacterial proteins from fecal samples.10−12 In these studies, different sample preparation procedures were employed and differed in the application of bead−beating for protein extraction. Herein, by comparing the efficiency of protein identification with or without bead-beating, we confirmed that bead-beating is essential for sample preparation for metaproteomics analysis.
Because proteins from untargeted species (i.e., host and dietary proteins) may preclude medium-to-low abundant microbial peptide identification, it is important to enrich bacteria within fecal samples with high purity. To date, there are two main methods used for bacteria enrichment: one is a differential centrifugation method; the other is a filter-aided method, which has been reported to have high efficiency in the removal of host and food proteins.10 Herein, we have compared the differential centrifugation method to the filter-aided method in terms of their performance in reducing host and food protein identification and the improvement in bacterial protein identification, especially for Gram-positive bacteria, which are important microbes in the human gut and aid in keeping the digestive and immune system healthy.13,14 On the basis of a comparison of these methods, an alternative pipeline has been developed for the processing of fecal samples for metaproteomics analysis, which provides a foundation for future work in this field.
MATERIALS AND METHODS
Gnotobiotic Mouse Model
The following bacterial strains were isolated from the human gut: Bacteroides vulgatus, Bacteroides uniformis, Bacteroides thetaiotaomicron, Escherichia coli, Barnesiella intestinihominis, Parabacteroides distasonis, Faecalibacterium prausnitzii, Bifido-bacterium longum, Eubacterium rectale, Lactobacillus reuteri, and Roseburia inulinivorans and cultured under anaerobic conditions at 37 °C using an anaerobic chamber to saturation. Equal volumes of overnight saturated cultures (O.D. ≈ 1) of each bacterial strain were combined and subsequently gavaged into GF mice. Stable community membership within the stool was determined by qPCR using bacterial-specific primers (Supplemental Figure S1). Primer sequences are provided in Supplemental Table S1. Animal experiments used protocols approved by the University Committee on Use and Care of Animals.
Microbial Cell Extraction from Fecal Samples
Fecal samples were collected from mice and immediately stored at −80 °C until use. The samples were processed in parallel by three methods: a centrifuge-low speed method (LCE), a centrifuge-high speed method (HCE), and a filter-aided method (FA). For the LCE method, 25 mg of fecal sample was suspended in 500 μL of phosphate-buffered saline (PBS) with 5% protease inhibitor cocktail (PI), physically disrupted by pipetting and by vortexing thoroughly. Disrupted pellets were centrifuged at 250g for 5 min to precipitate insoluble materials, to which 500 μL of PBS with PI was added to suspend the pellet again as described above (this step was repeated four times). The suspension was then combined and ultra-centrifuged (30 000g, 15 min, 4 °C) to pellet bacteria, which were then washed three times with PBS containing 5% PI.
For the HCE method, fecal samples were disrupted as described in the LCE method. Disrupted pellets were centrifuged at 2500g for 5 min to precipitate insoluble materials, and this process was repeated four times. The combined suspension was then ultracentrifuged at 30 000g, 15 min, 4 °C to pellet bacteria.
The FA method was performed as described by Xiong et al.10 with some modifications. Fecal samples (25 mg) were suspended in 2 mL of Tris-based saline buffer (TBS) with 5% PI and filtered through a 20 μm vacuum filter unit to remove insoluble materials. The filtrate was then homogenized with a Tissue Tearor (Biospec products, USA) at 30 000 rpm for 30 s once, then twice, with a 30 s interval between pulses to remove the remaining mouse cells. The homogenates were then centrifuged at 4000g for 10 min to pellet bacteria. The bacterial pellet was then filtered through a 0.22 μm vacuum filter unit to capture microbial cells, followed by washing twice to remove attached mouse proteins.
Protein Extraction and Digestion by FASP
The five Gram-positive bacterial mixture and microbial cell pellet extracted from mouse fecal samples were lysed in 50 μL of lysing buffer containing 20 mM Tris-HCl (pH7.4), PI (1:20), and 2% w/v SDS at 95 °C for 30 min. The lysates were then transferred to 2 mL conical tubes containing 100 mg of 100 μm diameter low binding zirconium beads (OPS Diagnostics, Lebanon, NJ). The samples were bead-beaten at a maximum speed of the mini-beadbeater (BioSpec Products, Bartlesville, OK) for 1 min pulses, three times, with a 30 s interval on ice between pulses, followed by centrifugation at 13 000 rpm for 15 min. The concentration of protein extracts was measured by the BCA protein assay (Thermo Scientific, Waltham, MA).
The filter-aided sample preparation (FASP) method was then used for SDS-depletion, protein reduction and alkylation, and digestion as described previously,15,16 with some modification. In brief, the concentrates were diluted in 200 μL of uranyl acetate (UA) solutions (8 M urea in 100 mM Tris-HCl, pH 8.8) in Microcon Ultracel YM-30 filtration devices (Millipore, Billerica, MA) and centrifuged at 14 000g for 15 min (this step was repeated once). After centrifugation, the concentrates were reduced with 25 mM tris(2-carboxyethyl)-phosphine (TCEP) in 100 μL of UA solution at 37 °C for 1 h, followed by alkylation with 50 mM indole-3-Acetic Acid (IAA) in the dark for 20 min. Filters were subsequently washed twice with UA, followed by two washes with 50 mM NH4HCO3. Enzymatic digestion was performed by adding trypsin (Promega, Madison, MI) in 75 μL of 50 mM NH4HCO3 to the filter and incubated overnight at 37 °C. Released peptides were collected by centrifugation and desalted with C18 spin columns17 (Thermo Scientific), followed by dryness using a SpeedVac concentrator (Thermo Savant, Milford, MA).
LC–MS/MS
One microgram of peptide mixtures was analyzed by an LTQ-Orbitrap Velos mass spectrometer (Thermo Scientific) interfaced with a Sciex Eksigent Nano 2D-LC system (AB SCIEX), or by an Orbitrap Fusion Tribrid Mass Spectrometer (Thermo Scientific) equipped with an Easy 1000 nano UHPLC system (Thermo). The peptide separation was performed using a C18 column (Acclaim PepMap RSLC, 75 μm × 25 cm, 2 μm, 100 Å) at a flow rate of 300 nL/min using a 152 min gradient from 2 to 35% eluent B (0.1% formic acid in acetonitrile) in eluent A (0.1% formic acid in water). The MS instrument was operated in positive ion mode. Survey MS scans (from m/z 375−2000) were acquired in the Orbitrap analyzer with resolution r = 60 000, and the top 10 most intense ions were selected for tandem MS analysis by collision-induced dissociation (CID) in the linear ion trap. The normalized collision energy was set to 35. Dynamic exclusion was enabled, with a mass exclusion width of 10 ppm and exclusion duration of 20 s.18
Data Analysis
All protein databases were downloaded from the Universal Protein Resource Knowledgebase (UniProtKB, released 2014_5). The combined host, food and bacterial protein database was constructed by appending the mouse and food (wheat, corn, soybean, yeast, alfalfa) proteins to those of the 11 microbes (Bacteroides vulgatus, Bacteroides uniformis, Bacteroides thetaiotaomicron, Escherichia coli, Barnesiella intestinihominis, Parabacteroides distasonis, Faecalibacterium prausnitzii, Bifido-bacterium longum, Eubacterium rectal, Lactobacillus reuteri, and Roseburia inulinivorans). Peptide identification was performed using SEQUEST incorporated into Proteome Discover software 1.4 (Thermo Scientific). The search parameters were set as follows: precursor ion m/z tolerance, ±10 ppm; fragment ion m/z tolerance, ±0.5 Da; two missed cleavages allowed; static modification, carbamidomethylation (+57.02146 Da, C); dynamic modifications, oxidation (+15.99492 Da, M). Identified peptides were filtered using a 1% peptide-level false discovery rate (FDR). All of the samples were run in duplicate to evaluate the reproducibility of LC separation and MS identification steps (technical replicates). For the five Gram-positive mixtures, two independent samples were performed to assess the reproducibility of the whole pipeline (pipeline replicates). To compare the LCE and FA methods for isolating and identifying bacterial proteins, stool samples from 5 mice were processed and analyzed (biological replicates). Peptide and protein grouping according to Proteome Discoverer’s algorithms were allowed, applying strict maximum parsimony principle. For protein identification, there is at least one unique peptide that matches to the protein. Gene Ontology (GO) annotation was applied to elucidate the molecular functions and biological process of the proteins identified.
RESULTS AND DISCUSSION
Inoculation of Germ-Free Mice with Defined Bacterial Community
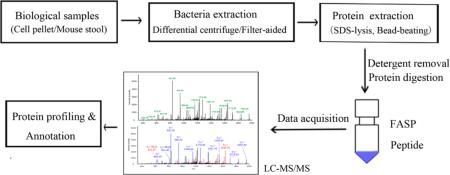
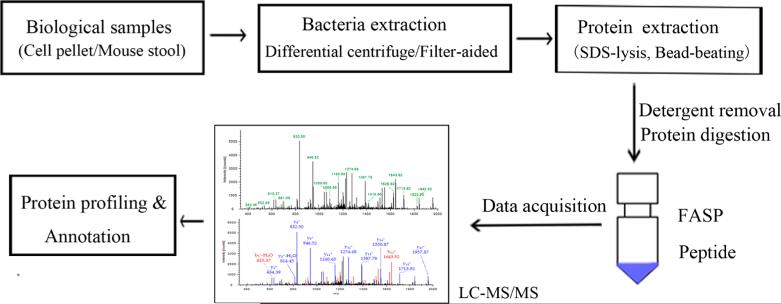
To develop a simple in vivo system to evaluate bacterial protein expression within the gut, we colonized GF mice with a defined bacterial community consisting of 11 bacterial strains that were isolated from the human colon and belonged to the four major bacterial phylotypes, namely, B. vulgates, B. uniformis, B. thetaiotaomicron, E. coli, B. intestinihominis, P. distasonis, F. prausnitzii, B. longum, E. rectal, L. reuteri, and R. inulinivorans. All 11 strains were detectable and stably colonized GF mice by day 14, as assessed by qPCR (Supplemental Figure S1). Using this simplified system, we wished to establish a protocol that would optimally allow the identification and measurement of functional expression of all bacterial strains by mass spectrometry. The pipeline for metaproteome analysis in this study is shown in Figure 1.
Figure 1.
Workflow of differential centrifugation/filter-aided methods for processing mouse fecal samples for metaproteome analysis. Image courtesy of Jing Wu, Copyright 2016.
Evaluation of the Effects of Bead-Beating in Protein Identification from Gram-Positive Bacteria
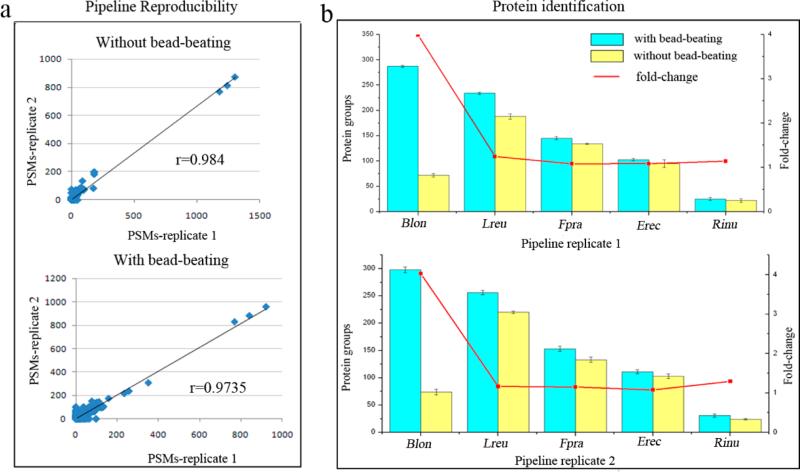
Because of the distinct differences between Gram-positive and Gram-negative cell walls, bead-beating is generally required to disrupt Gram-positive cell walls, while SDS buffer is sufficient for lysis of Gram-negative cells.19 Several studies have investigated bead-beating in DNA extraction from Gram-positive microbes,20,21 while few studies have evaluated the impact of bead-beating for protein extraction and identification from Gram-positive bacteria. In this study, using a mixture of five Gram-positive bacterial strains that were included in the 11-bacteria cocktail inoculated to mice, we evaluated the effect of bead-beating in protein extraction and identification from these Gram-positive bacteria. In total, 518 and 560 proteins were identified, respectively, without bead-beating for pipeline replicates 1 and 2, while 804 and 857 proteins were identified with bead-beating (Table 1). For pipeline replicates 1 and 2, we observed similar results and found that 64% more proteins were identified with bead-beating compared with those without bead-beating, indicating the high reproducibility of the entire pipeline. The reproducibility of the pipeline was further confirmed by the good correlation of PSM values between pipeline replicates at protein level (r = 0.9840 and 0.9735 for bead-beating (−) or (+), respectively, as shown in Figure 2a).
Table 1.
Summary of Proteome Obtained from Five Gram-Positive Microbes Prepared with or without Bead-Beating
| pipeline replicate 1 |
pipeline replicate 2 |
|||
|---|---|---|---|---|
| identification | bead-beating(−) | bead-beating(+) | bead-beating(−) | bead-beating(+) |
| spectral counts | 8125 | 12793 | 8178 | 13763 |
| peptide counts | 1786 | 3414 | 2120 | 3719 |
| unique peptide counts | 1579 | 2965 | 1835 | 3220 |
| protein group counts | 518 | 804 | 560 | 857 |
Figure 2.
Evaluation of the impact of bead-beating in protein extraction and identification from five Gram-positive microbes. (a) Analysis of pipeline reproducibility at protein level. Scatter plot showing the correlation between the number of PSMs identified in the two pipeline replicates (r = Pearson correlation coefficient). (b) Protein identification from five Gram-positive microbes prepared with or without bead-beating. Histogram showing protein identification results (means of two run replicates; error bar indicates standard deviation). Fold-change values were obtained by dividing the number of proteins identified with bead−beating by the number of proteins identified without bead beating. Abbreviations: Blon: B. longum; Lreu: L. reuteri; Fpra: F. prausnitzii; Erec: E. rectal; Rinu: R. inulinivorans.
We further compared the number of proteins identified for each bacterium with or without bead-beating. As shown in Figure 2b, using bead-beating, more proteins were identified for all of these five bacteria, especially for Bifidobacterium longum, for which about four times more proteins were identified with bead-beating from pipeline replicates 1 and 2. Our findings confirm that bead-beating is essential for protein extraction from Gram-positive bacteria due to their cell wall, especially for Bifidobacterium longum, the primary constituent of probiotic formulations that have been suggested to have protective effects against colon cancer development22 and in the treatment of inflammatory bowel disease23
Optimization of Strategy for Mouse Fecal Proteomics Analysis with Differential Centrifugation
To reduce the complexity of peptide analysis, efficient extraction of bacteria with high purity is critical because proteins from untargeted species (host mouse and food) may preclude identification of medium-to-low abundant microbial peptides. The differential centrifugation approach has been used as an effective method for extraction of bacteria from fecal samples. This method consisted of three steps: (1) removal of insoluble material derived from undigested food with low speed centrifugation, (2) pelleting of bacteria and disruption of mouse cells with ultracentrifugation, and (3) thorough washing of captured cells to remove attached mouse proteins. Recently, several studies have used this method to perform metaproteomics analysis of stool samples but with a different centrifugation paradigm.11,24
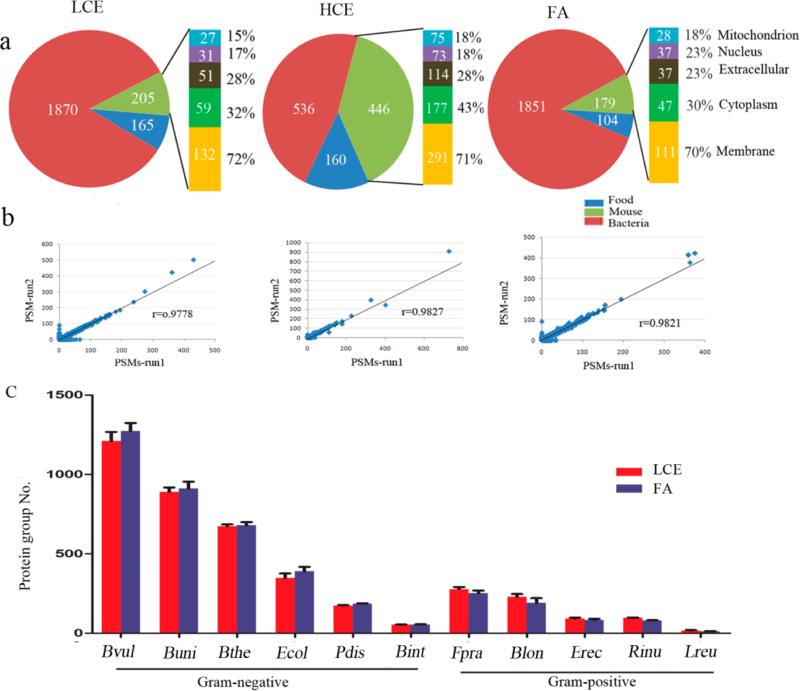
We have evaluated the efficiency of two different centrifugation speeds (low-speed 200g versus higher speed 2500g) in insoluble material removal as well as their impact on bacterial protein identification. With low-speed centrifugation (LCE), a total of 2240 proteins including 1870 bacterial proteins, 205 mouse proteins, and 165 food proteins were identified from the GF mice with the inoculated bacterial cocktail, while a total of 1142 proteins was identified using high-speed centrifugation (HCE), including 536 bacterial proteins, 446 mouse proteins, and 160 food proteins. Because of the dramatic loss of bacteria with the HCE method, 2.5 times more bacterial proteins were identified with the LCE method (Figure 3a). The protein identification from food remains almost the same between these two methods (165 for LCE and 160 for HCE). Our results indicate that centrifugation using high speed (up to 2500g) for the removal of insoluble materials as reported in a previous study24 could not reduce interference from food protein identification but resulted in significant loss of bacteria.
Figure 3.
Evaluation of the performance of the three methods, HCE, LCE, and FA, in untargeted protein removal and bacterial protein identification from mouse fecal samples. (a) Percentage of the identified bacterial, mouse, and food proteins with the LCE (left), HCE (middle), FA (right) methods. (b) Analysis of run reproducibility at the protein level. Scatter plot showing the correlation between the number of PSMs identified in the two runs (r = Pearson correlation coefficient). Each point in the plot represents an identified protein. (c) Numbers of proteins identified for each bacterium from five mouse fecal samples with the FA and LCE methods. Error bars represent standard error of the mean (SEM). Abbreviations: Bvul: B. vulgates; Bthe: B. thetaiotaomicron; Buni: B. uniformis; Pdis: P. distasonis; Ecol: E. coli; Blon: B. longum; Erec: E. rectal; Rinu: R. inulinivorans; Bint: B. intestinihominis; Fpra: F. prausnitzii; Lreu: L. reuteri.
The mouse cell wall is more susceptible and easier to disrupt than bacterial cells, so ultracentrifugation was employed to pellet bacteria and disrupt the mouse cells. This was confirmed by our results demonstrating that more than 70% of the identified mouse proteins were located in the membrane (Figure 3a), while the dominant cytoplasmic proteins were released with the mouse cell disruption during the process of ultracentrifugation.
Because a higher centrifugation speed allows the removal of insoluble material, less precipitate was observed with HCE compared with LCE. To minimize loss of bacteria, one wash rather than three washes was performed for removing attached mouse proteins. However, we found that a single wash of the precipitate led to greater mouse protein contamination (446 mouse proteins for HCE versus 205 proteins for LCE), with increased abundance of mouse cytoplasmic proteins in particular (177 (43%) for HCE versus 59 (32%) for LCE), as shown in Figure 3a. Therefore, multiple washes are critical for reducing host protein contamination.
Comparison of the Differential Centrifugation Method to the Filter-Aided Method in Enrichment of Bacteria
To deepen microbiome characterization by reducing untargeted protein identification, Xiong et al.10 recently developed a filter-aided method to enrich bacteria from human infant fecal samples. With effective removal of untargeted proteins, significant improvement in the depth of the bacterial proteome measurement was observed by this filter-aided method. Herein, we have compared this method with our LCE method in terms of their performance in reducing host and food protein contamination and enriching for bacterial proteins.
As indicated above, using LCE, a total of 2240 proteins including 1870 bacterial proteins, 205 mouse proteins, and 165 food proteins were identified from GF mouse inoculated with the 11-bacteria cocktail by the LTQ-Orbitrap Velos mass spectrometer. The same fecal sample was applied to the filter-aided method, and a total of 2134 proteins including 1851 bacterial proteins, 179 mouse proteins, and 104 food proteins were identified with this filter-aided method. We also analyzed protein expression from the 11-bacteria cocktail by the LTQ- Orbitrap Velos mass spectrometer prior to their inoculation to the mice. In total, 3015 bacterial proteins were identified. Of note, the greatest number of proteins were detected from bacteria that colonized GF mice most abundantly, that is, Bvul, Buni, and Bthe (Supplemental Figure S2). In addition, the number of identified proteins associated with several bacterial strains significantly decreased after inoculation, which may reflect their relative low abundance after colonization in the gut, suggesting perhaps a decreased ability to compete as effectively as the Bacteroides species for nutrients (Supplemental Figure S2). Regardless, a high level of reproducibility between LC− MS/MS runs was observed, with r = 0.9821 and 0.9778 at protein level for the FA and LCE methods, respectively (Figure 3b).
To further evaluate the performance of the two methods for identification of bacterial proteins, we processed five stool samples from five different mice inoculated with the 11-bacteria cocktail. Protein identification was performed using the Orbitrap Fusion Tribrid mass spectrometer. The total number of proteins identified from bacteria, mouse, and food in the five stool samples is shown in Table 2. There were not significant differences in the number of identified bacterial and food proteins with either the LCE and FA methods (p > 0.05), while a slightly reduced number of mouse proteins was obtained using the FA method (p = 0.04). Because mouse proteins accounted for <10% of the total proteins identified, the slightly higher number of mouse proteins enriched by the LCE method did not preclude the identification of bacterial proteins as such that a similar number of bacterial proteins were identified by both the LCE and FA methods, as shown in Table 2.
Table 2.
Number of Proteins and Peptide-Spectrum Matches (PSMs) Identified from the Stool Samples of the Five Mice Using the LCE and FA Methods
| LCE |
FA |
LCE vs FA |
|||||||||
|---|---|---|---|---|---|---|---|---|---|---|---|
| 1 | 2 | 3 | 4 | 5 | 1 | 2 | 3 | 4 | 5 | p value | |
| bacterial proteins | 4158 | 3967 | 4119 | 3945 | 4121 | 4096 | 3906 | 4265 | 4165 | 4076 | 0.43 |
| mouse proteins | 421 | 420 | 419 | 355 | 304 | 384 | 387 | 356 | 336 | 303 | 0.04 |
| food proteins | 238 | 251 | 234 | 229 | 213 | 228 | 209 | 211 | 225 | 202 | 0.06 |
| proteins from Gram-positive | 788 | 761 | 682 | 639 | 689 | 682 | 727 | 547 | 568 | 517 | 0.01 |
| proteins from Gram-negative | 3369 | 3205 | 3436 | 3305 | 3431 | 3413 | 3179 | 3717 | 3596 | 3558 | 0.09 |
| PSMs from untargeted species | 3888 | 4012 | 3925 | 3599 | 2517 | 3507 | 3754 | 3118 | 3130 | 2596 | 0.06 |
It should be noted, however, that with the FA method, dramatic loss in protein recovery was observed because only ~2 μg proteins was obtained per milligram of fecal samples compared with ~18 μg proteins per milligram obtained using LCE with a similar amount of starting material (see Table 3). A higher level of protein recovered by LCE would facilitate quantitative proteomics analysis of these bacteria, especially for the low abundant bacteria to reveal their functions in the gut. Because the peptide-spectrum matches (PSMs) assigned to mouse and food species were not significantly different with either the LCE and FA methods, we confirmed that the significantly high protein/bacteria recovery using LCE method was not from the possible high protein content from untargeted species of mouse and food. Also, the dramatic loss of bacteria using the FA method precluded the identification of bacterial proteins with low abundance from complex bacterial mixtures by mass spectrometry. This issue was verified by our findings that more protein groups were identified from relatively lower abundant Gram-positive bacteria using the LCE method compared with the FA method (p < 0.05) (Table 2 and Figure 3c). This is especially important when stool amounts are limited, as is the case with fecal collections from mice.
Table 3.
Protein Recovery from the Five Mouse Stool Samples Processed by the LCE and FA Methods
| LCE |
FA |
|||||||||
|---|---|---|---|---|---|---|---|---|---|---|
| 1 | 2 | 3 | 4 | 5 | 1 | 2 | 3 | 4 | 5 | |
| starting amount of fecal samples (mg) | 19.8 | 15.1 | 20.0 | 26.3 | 14.8 | 16.3 | 15.1 | 18.8 | 27.0 | 15.5 |
| amount of protein obtained (μg) | 390.0 | 296.6 | 387.9 | 458.1 | 266.1 | 37.2 | 27.7 | 42.5 | 46.6 | 34.6 |
| protein amount (μg) obtained per microgram fecal samples | 19.7 | 19.6 | 19.4 | 17.4 | 18.4 | 2.3 | 1.8 | 2.1 | 1.7 | 2.2 |
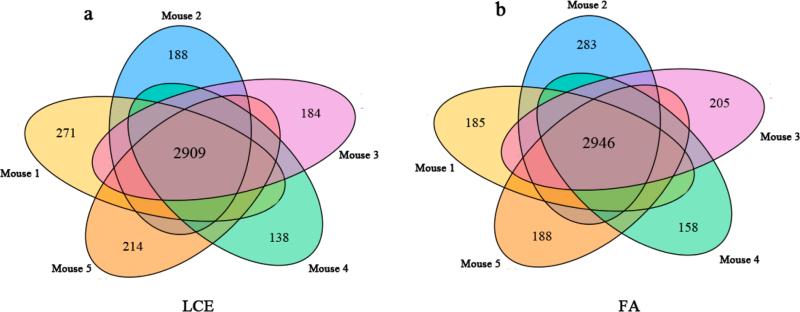
Overlap in identified proteins from the five stool samples from the five different mice using the LCE and FA methods is shown in Figure 4. For the LCE method, 2909 bacterial proteins were commonly identified from the five mice, and 2946 proteins were commonly identified for the FA method. More than 70% of overlapping proteins were identified between any two stool samples, and the number of proteins assigned to each bacterial species in the five mice (Figure 3c) was similar, indicating that the methods we used are robust and effective to process different sets of stool samples. Our results also show that stool samples from different mice inoculated with the 11-bacteria cocktail have low heterogeneity, indicating the applicability of this gnotobiotic mouse model to study the functional capacity of these bacteria in mice.
Figure 4.
Overlap in protein identification among the five mouse stool samples using the LCE (a) and FA methods (b).
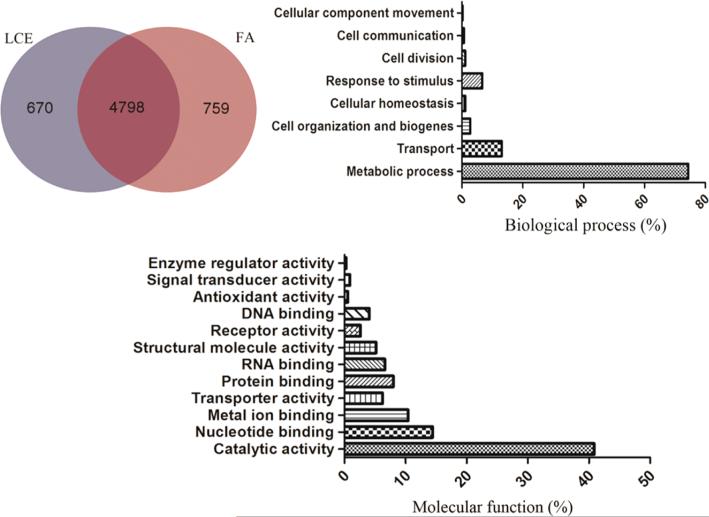
Overlapping proteins identified between using LCE and FA methods were further investigated. In total, 6224 bacterial proteins were identified by these two methods from the five stool samples, as shown in Supplemental Table 2, and 4798 proteins were commonly identified (Figure 5). Therefore, a high number of overlapping proteins (up to 77.0%) were found between using LCE and FA methods, as shown in Figure 5. However, because of the dramatic loss of bacteria/proteins and lower number of proteins identified from Gram-positive bacteria using the FA method, the LCE method was confirmed to be the optimal method for processing stool sample with a limited amount of starting materials.
Figure 5.
Microbial protein groups identified using the LCE and FA methods. The pie charts illustrate the overlap of proteins identified with the two methods from the five stool samples. Bar charts show GO analysis of microbial protein groups according to their molecular functions and biological processes identified with the two methods.
Gene Ontology (GO) annotation was applied to elucidate the common functions and biological processes of the proteins identified. As shown in Figure 5, the identified proteins were involved in metabolic processes, transport, response to stimuli, cell organization and biogenesis, cellular homeostasis, cell division, cell communication, and cellular component movement. More than 70% of the total proteins were involved in metabolic processes, which mainly include glucose metabolism, pyruvate metabolism, fatty acid biosynthesis, oxidative phosphorylation, and purine metabolism. Analysis of functions and biological processes of bacterial proteins identified may aid in understanding bacterial functions during health and disease.
CONCLUSIONS
This work presents an integrated pipeline for metaproteome analysis of fecal samples. By comparison of protein identification from Gram-positive microbes with and without bead-beating, it was confirmed that bead-beating is essential for efficient protein extraction for metaproteome analysis. The pipeline for bacteria enrichment from mouse fecal samples was further optimized in this study. By evaluating three different methods (LCE, HCE, and FA) in terms of their performance in untargeted protein removal, protein content recovery, and bacterial protein identification, LCE showed improved performance in bacterial protein identification from fecal samples that are limited in amount, especially for Gram-positive species. However, the LCE and FA methods appear complementary in terms of number and types of protein identifications and may be used together to improve the overall number of proteins detected.
In future studies, to investigate the importance of bacterial protein expression during health and disease, improved profiling of proteins from gut microbiomes can be achieved by employing the optimized bacterial protein extraction pipeline reported here together with the most advanced MS method and metaproteome bioinformatics.
Supplementary Material
ACKNOWLEDGMENTS
This work was supported by the National Institutes of Health (NIH) under grants R21 CA 191744, R21 CA205636, and the GI SPORE to G.Y.C. and D.M.L. We acknowledge the assistance of the Wayne State University Proteomics Core that is supported through NIH grants P30 ES020957, P30 CA 022453, and S10 OD010700.
Footnotes
ASSOCIATED CONTENT
Supporting Information
The Supporting Information is available free of charge on the ACS Publications website at DOI: 10.1021/acs.jproteome.6b00450.
The authors declare no competing financial interest.
REFERENCES
- 1.Guinane CM, Cotter PD. Role of the gut microbiota in health and chronic gastrointestinal disease: understanding a hidden metabolic organ. Ther. Adv. Gastroenterol. 2013;6(4):295–308. doi: 10.1177/1756283X13482996. [DOI] [PMC free article] [PubMed] [Google Scholar]
- 2.Carding S, Verbeke K, Vipond DT, Corfe BM, Owen LJ. Dysbiosis of the gut microbiota in disease. Microb. Ecol. Health Dis. 2015;26:26191. doi: 10.3402/mehd.v26.26191. [DOI] [PMC free article] [PubMed] [Google Scholar]
- 3.Clemente JC, Ursell LK, Parfrey LW, Knight R. The impact of the gut microbiota on human health: an integrative view. Cell. 2012;148(6):1258–70. doi: 10.1016/j.cell.2012.01.035. [DOI] [PMC free article] [PubMed] [Google Scholar]
- 4.Berer K, Mues M, Koutrolos M, Rasbi ZA, Boziki M, Johner C, Wekerle H, Krishnamoorthy G. Commensal microbiota and myelin autoantigen cooperate to trigger autoimmune demyelination. Nature. 2011;479(7374):538–41. doi: 10.1038/nature10554. [DOI] [PubMed] [Google Scholar]
- 5.Human Microbiome Project, C. Structure, function and diversity of the healthy human microbiome. Nature. 2012;486(7402):207–14. doi: 10.1038/nature11234. [DOI] [PMC free article] [PubMed] [Google Scholar]
- 6.Turnbaugh PJ, Hamady M, Yatsunenko T, Cantarel BL, Duncan A, Ley RE, Sogin ML, Jones WJ, Roe BA, Affourtit JP, Egholm M, Henrissat B, Heath AC, Knight R, Gordon JI. A core gut microbiome in obese and lean twins. Nature. 2009;457(7228):480–4. doi: 10.1038/nature07540. [DOI] [PMC free article] [PubMed] [Google Scholar]
- 7.Dworzanski JP, Deshpande SV, Chen R, Jabbour RE, Snyder AP, Wick CH, Li L. Mass spectrometry-based proteomics combined with bioinformatic tools for bacterial classification. J. Proteome Res. 2006;5(1):76–87. doi: 10.1021/pr050294t. [DOI] [PubMed] [Google Scholar]
- 8.Tao L, Yu X, Snyder AP, Li L. Bacterial identification by protein mass mapping combined with an experimentally derived protein mass database. Anal. Chem. 2004;76(22):6609–17. doi: 10.1021/ac049391g. [DOI] [PubMed] [Google Scholar]
- 9.Norbeck AD, Callister SJ, Monroe ME, Jaitly N, Elias DA, Lipton MS, Smith RD. Proteomic approaches to bacterial differentiation. J. Microbiol. Methods. 2006;67(3):473–86. doi: 10.1016/j.mimet.2006.04.024. [DOI] [PubMed] [Google Scholar]
- 10.Xiong W, Giannone RJ, Morowitz MJ, Banfield JF, Hettich RL. Development of an enhanced metaproteomic approach for deepening the microbiome characterization of the human infant gut. J. Proteome Res. 2015;14(1):133–41. doi: 10.1021/pr500936p. [DOI] [PMC free article] [PubMed] [Google Scholar]
- 11.Tanca A, Palomba A, Pisanu S, Deligios M, Fraumene C, Manghina V, Pagnozzi D, Addis MF, Uzzau S. A straightforward and efficient analytical pipeline for metaproteome characterization. Microbiome. 2014;2(1):49. doi: 10.1186/s40168-014-0049-2. [DOI] [PMC free article] [PubMed] [Google Scholar]
- 12.Huang HJ, Chen WY, Wu JH. Total protein extraction for metaproteomics analysis of methane producing biofilm: the effects of detergents. Int. J. Mol. Sci. 2014;15(6):10169–84. doi: 10.3390/ijms150610169. [DOI] [PMC free article] [PubMed] [Google Scholar]
- 13.Khan MT, Duncan SH, Stams AJ, van Dijl JM, Flint HJ, Harmsen HJ. The gut anaerobe Faecalibacterium prausnitzii uses an extracellular electron shuttle to grow at oxic-anoxic interphases. ISME J. 2012;6(8):1578–85. doi: 10.1038/ismej.2012.5. [DOI] [PMC free article] [PubMed] [Google Scholar]
- 14.West NR, Powrie F. Immunotherapy Not Working? Check Your Microbiota. Cancer Cell. 2015;28(6):687–9. doi: 10.1016/j.ccell.2015.11.010. [DOI] [PubMed] [Google Scholar]
- 15.Zhu J, Nie S, Wu J, Lubman DM. Target proteomic profiling of frozen pancreatic CD24+ adenocarcinoma tissues by immuno-laser capture microdissection and nano-LC-MS/MS. J. Proteome Res. 2013;12(6):2791–804. doi: 10.1021/pr400139c. [DOI] [PMC free article] [PubMed] [Google Scholar]
- 16.He J, Zhu J, Liu Y, Wu J, Nie S, Heth JA, Muraszko KM, Fan X, Lubman DM. Immunohistochemical staining, laser capture microdissection, and filter-aided sample preparation-assisted proteomic analysis of target cell populations within tissue samples. Electrophoresis. 2013;34(11):1627–36. doi: 10.1002/elps.201200566. [DOI] [PMC free article] [PubMed] [Google Scholar]
- 17.Wu J, An Y, Pu H, Shan Y, Ren X, An M, Wang Q, Wei S, Ji J. Enrichment of serum low-molecular-weight proteins using C18 absorbent under urea/dithiothreitol denatured environment. Anal. Biochem. 2010;398(1):34–44. doi: 10.1016/j.ab.2009.10.047. [DOI] [PubMed] [Google Scholar]
- 18.Wu J, Xie X, Liu Y, He J, Benitez R, Buckanovich RJ, Lubman DM. Identification and confirmation of differentially expressed fucosylated glycoproteins in the serum of ovarian cancer patients using a lectin array and LC-MS/MS. J. Proteome Res. 2012;11(9):4541–52. doi: 10.1021/pr300330z. [DOI] [PubMed] [Google Scholar]
- 19.McIlroy S, Porter K, Seviour RJ, Tillett D. Simple and safe method for simultaneous isolation of microbial RNA and DNA from problematic populations. Appl. Environ. Microbiol. 2008;74(21):6806–7. doi: 10.1128/AEM.01047-08. [DOI] [PMC free article] [PubMed] [Google Scholar]
- 20.Salonen A, Nikkila J, Jalanka-Tuovinen J, Immonen O, Rajilic-Stojanovic M, Kekkonen RA, Palva A, de Vos WM. Comparative analysis of fecal DNA extraction methods with phylogenetic microarray: effective recovery of bacterial and archaeal DNA using mechanical cell lysis. J. Microbiol. Methods. 2010;81(2):127–34. doi: 10.1016/j.mimet.2010.02.007. [DOI] [PubMed] [Google Scholar]
- 21.Apajalahti JH, Sarkilahti LK, Maki BR, Heikkinen JP, Nurminen PH, Holben WE. Effective recovery of bacterial DNA and percent-guanine-plus-cytosine-based analysis of community structure in the gastrointestinal tract of broiler chickens. Appl. Environ. Microbiol. 1998;64(10):4084–8. doi: 10.1128/aem.64.10.4084-4088.1998. [DOI] [PMC free article] [PubMed] [Google Scholar]
- 22.Singh J, Rivenson A, Tomita M, Shimamura S, Ishibashi N, Reddy BS. Bifidobacterium longum, a lactic acid-producing intestinal bacterium inhibits colon cancer and modulates the intermediate biomarkers of colon carcinogenesis. Carcinogenesis. 1997;18(4):833–41. doi: 10.1093/carcin/18.4.833. [DOI] [PubMed] [Google Scholar]
- 23.Vieira AT, Teixeira MM, Martins FS. The role of probiotics and prebiotics in inducing gut immunity. Front. Immunol. 2013;4:445. doi: 10.3389/fimmu.2013.00445. [DOI] [PMC free article] [PubMed] [Google Scholar]
- 24.Lichtman JS, Marcobal A, Sonnenburg JL, Elias JE. Host-centric proteomics of stool: a novel strategy focused on intestinal responses to the gut microbiota. Mol. Cell. Proteomics. 2013;12(11):3310–8. doi: 10.1074/mcp.M113.029967. [DOI] [PMC free article] [PubMed] [Google Scholar]
Associated Data
This section collects any data citations, data availability statements, or supplementary materials included in this article.


