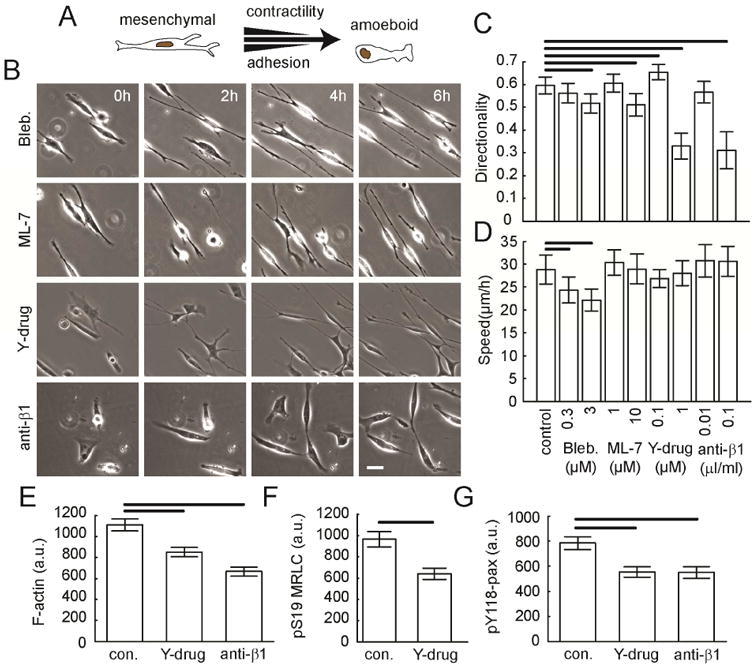
Figure 3. Migration after decreasing contraction or adhesion in a mesenchymal mode migrator.

MDA-MB-231 cells on aligned collagen fibrils in the presence of contractility inhibitors (blebbistatin, ML-7, Y-27632) or a β1 integrin adhesion inhibitor (P5D2 antibody). (A) Schematic of motility modes and contact guidance response. (B) Phase contrast images of MDA-MB-231 cells at different time points during migration in the presence of inhibitors. Calibration bar length = 30 μm. Migration (C) directionality and (D) speed of MDA-MB-231 cells in the presence of inhibitors (Nexperiments ≥ 3 and Ncells per experiment ≥ 60). MDA-MB-231 cells on aligned collagen fibrils and treated with either Y-27632 (1 μM) or P5D2 antibody (0.1 μl/ml) were stained for (E) F-actin, (F) pS19-MRLC and (G) pY118-Pax. Images were taken using epifluorescence microscopy. Whole cell average grey value was calculated. Error bars are 95% confidence intervals. Solid black lines indicate that the means are statistically significant (p < 0.05 using two-tailed student's t-test).
