Abstract
Elm (Ulmus) has a long history of use as a high-quality heavy hardwood famous for its resistance to drought, cold, and salt. It grows in temperate, warm temperate, and subtropical regions. This is the first report of Ulmaceae chloroplast genomes by de novo sequencing. The Ulmus chloroplast genomes exhibited a typical quadripartite structure with two single-copy regions (long single copy [LSC] and short single copy [SSC] sections) separated by a pair of inverted repeats (IRs). The lengths of the chloroplast genomes from five Ulmus ranged from 158,953 to 159,453 bp, with the largest observed in Ulmus davidiana and the smallest in Ulmus laciniata. The genomes contained 137–145 protein-coding genes, of which Ulmus davidiana var. japonica and U. davidiana had the most and U. pumila had the fewest. The five Ulmus species exhibited different evolutionary routes, as some genes had been lost. In total, 18 genes contained introns, 13 of which (trnL-TAA+, trnL-TAA−, rpoC1-, rpl2-, ndhA-, ycf1, rps12-, rps12+, trnA-TGC+, trnA-TGC-, trnV-TAC-, trnI-GAT+, and trnI-GAT) were shared among all five species. The intron of ycf1 was the longest (5,675bp) while that of trnF-AAA was the smallest (53bp). All Ulmus species except U. davidiana exhibited the same degree of amplification in the IR region. To determine the phylogenetic positions of the Ulmus species, we performed phylogenetic analyses using common protein-coding genes in chloroplast sequences of 42 other species published in NCBI. The cluster results showed the closest plants to Ulmaceae were Moraceae and Cannabaceae, followed by Rosaceae. Ulmaceae and Moraceae both belonged to Urticales, and the chloroplast genome clustering results were consistent with their traditional taxonomy. The results strongly supported the position of Ulmaceae as a member of the order Urticales. In addition, we found a potential error in the traditional taxonomies of U. davidiana and U. davidiana var. japonica, which should be confirmed with a further analysis of their nuclear genomes. This study is the first report on Ulmus chloroplast genomes, which has significance for understanding photosynthesis, evolution, and chloroplast transgenic engineering.
Introduction
Elm (Ulmus) has a wide distribution, from the tropics to cold temperate zones, and is mainly located in the former Soviet Central Asia, Kazakhstan, Siberia, Mongolia, Transbaikal, North Korea, and other countries in the Northern Hemisphere. There are 40 species worldwide, of which 25 are found in China, mainly to the north of the Yangtze River. Ulmus has resistance to drought, cold, and saline-alkali conditions, allowing it to grow in dry, barren dunes and chestnut soils [1–2]. Elm leaves are high in protein and can be used as animal feed and feed processing. Moreover, its fruit and bark can be used as medicine. Since Ulmus species have lush foliage, they are commonly grown in gardens.
The chloroplast is a semi-autonomous organelle in plant cells, and is one of three major genetic systems, the other two being the mitochondrion and the nucleus [3–5]. Chloroplasts are generally green, flat, and oval or spherical, and exist widely in the cytoplasmic matrix. Besides its role in photosynthesis, the chloroplast is closely associated with starch, fatty acid, pigment, and amino acid synthesis [6]. The chloroplast genome contains a large amount of genetic information. Due to its self-replication mechanism and relatively independent evolution, genetic information from the chloroplast is used to explore the occurrence, development, evolution of species and to develop the fields of plant genomics and bioinformatics [7]. In 1940, the first electron microscope image of chloroplasts was published by German scientists [8]. Then, Bedbrook and Bogorad [9] established the first chloroplast fingerprint of corn. Research on the chloroplast genome has gradually continued with the development of molecular biology and genomics. Scholars have found that, although the overall structure of the chloroplast genome is relatively conservative, it contains many mutations and some small structural changes among species, such as inversions, translocations, and insertion loss [10–12]. By now, over 700 plants have been sequenced, which has greatly improved chloroplast genome research. However, despite being one of the earliest trees to have been identified in the early third century, there is little genetic and genomic research on Ulmus. As a large plant branch, Ulmaceae comprises 230 elm species; however, there are no relevant reports on the elm chloroplast genome, which has hindered our understanding and progress of Ulmaceae evolution, species identification, genetic engineering, and other related research. Whatmore, there are still a lot of controversy about the taxonomic position of the Ulmaceae. In this report, we present the first complete chloroplast genomes of Ulmus by de novo sequencing. Using comparative genomics, we analyzed the characteristics of the chloroplast genomes of five Ulmus species and determined their phylogenetic positions.
Materials and methods
Test material
We collected test materials from the Black Dragon Mountain Nature Sanctuary in Zhangjiakou, PR China (charged by Zhangjiakou Forestry Bureau, the field studies did not involve endangered or protected species). We selected five native, wild species: Ulmus pumila L., Ulmus laciniata Mayr., Ulmus davidiana Planch., Ulmus davidiana Planch. var. japonica (Rehd.) Nakai, and Ulmus macrocarpa Hance. The leaves were cleaned, frozen in dry ice, and stored at -80°C refrigerator for subsequent analysis.
Chloroplast genome sequencing
We used a high-salt, low-pH method to extract chloroplast genomic DNA from the leaves [13]. First, leaf homogenate was filtered and purified to obtain chloroplasts. We examined the samples under a microscope to assess chloroplast integrity, and then used DNase to digest nuclear, mitochondrial, and other DNA to prevent interference. After adding lysis solution, the chloroplasts were fully cleaved to release chloroplast DNA (cpDNA), and the chloroplast genome DNA was obtained by centrifugation, extraction, and purification. After passing an inspection, we sent the cpDNA to a company (Beijing ORI-GENE science and technology co., LTD) for high-throughput sequencing.
De novo assembly and gap fillingand genome annotation
After filtering the raw data and removing of the impact of data quality (Phred score Cutoff-30), we obtained high-quality data. First, we used SOAPdenovo 2.01 (http://soap.genomics.org.cn/soapdenovo.html) [14] to perform the initial assembly and obtain the contig sequences. Then, we used BLAT 36 [15] (http://www.jurgott.org/linkage/LinkagePC.html) assembly to locate the long sequence of the near-edge species (Morus notabilis—KP939360.1, Morus mongolica- KM491711.2) of the chloroplast reference genome and obtain the relative positions of the contig sequences. According to the relative position of the contigs, we performed splicing and corrected assembly error. Finally, the whole framework maps of the chloroplast genomes were obtained.
We used the software GapCloser 1.12 (Gapcloser is part of software SOAPdenovo) (https://sourceforge.net/projects/soapdenovo2/files/GapCloser) to fill the gaps in the frame sequence diagram using high-quality short sequences, and then used generation sequencing to complement and confirm the remaining gaps and suspicious areas. Finally, we verified the long single copy section (LSC), short single copy section (SSC), and inverted repeat (IR) regional connectivity to obtain the ring-shaped complete chloroplast genome sequence. The chloroplast genome sequences were annotated with CpGAVAS [16] software (http://www.herbalgenomics.org/0506/cpgavas/analyzer/home) and DOGMA software, and then manually corrected.
Selection pressure, co-linear and phylogenetic analysis
To analyze the environmental pressure in the process of the evolution of different elms, KaKs_Calculator 2.0 [17] (https://sourceforge.net/projects/kakscalculator2) were used to calculate Ka, Ks value of genes that with SNP differences. The codon preference were analyzed and maped by R software. We conducted a co-linear analysis of the Ulmus chloroplast genomes with published chloroplast genomes of other plants, including tobacco (Nicotiana tabacum NC_007500.1), Arabidopsis thaliana (NC_000932), poplar (Populus NC_009143) and mulberry (Moraceae NC_025772) species by GSV [18] (http://cas-bioinfo.cas.unt.edu/gsv/homepage.php). Firstly, the sequences of all chloroplast sequences were pair-wise compared by BLAST (http://www.jurgott.org/linkage/LinkagePC.html). Then, screen comparison fragments that similarity were over than 80% and the matching length longer than 100 bp for drawing by GSV. To determine the phylogenetic positions of Ulmus species, we selected other 42 species published in NCBI and used the common chloroplast protein-coding genes to explore the evolution of the chloroplast genomes of Ulmus species and to verify their taxonomic status by MEGA 6.0 [19]. CGView Server (http://stothard.afns.ualberta.ca/cgview_server/index.html) were used to analyze the genetic variation of the chloroplast genome of five Ulmus species.
Results and analysis
Basic characteristics of the elm chloroplast
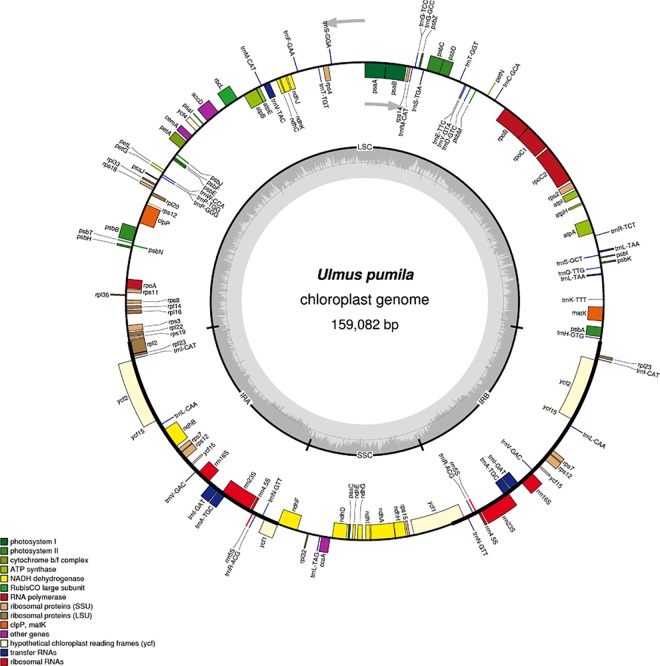
Similar to other higher plants, the chloroplast structures of the five Ulmus species (S1–S4 Figs) had a typical quadripartite structure consisting of two single-copy regions (LSC and SSC) separated by a pair of IRs (Fig 1) [20–21]. The lengths of the chloroplast genomes ranged from 158,953 to 159,453 bp (Table 1), of which U. davidiana had the largest and U. laciniata had the smallest. The guanine-cytosine (GC) contents of the five species were similar, around 35.57%. Meanwhile, the length of the LSC exhibited greater variation, ranging from 87,633 to 88,547 bp, of which U. macrocarpa had the longest, followed by U. davidiana var. japonica, U. pumila, U. laciniata, and U. davidiana. Compared with the LSC, the SSC exhibited smaller variation, ranging from 18,835 to 18,868 bp, the longest was U. davidiana var. japonica and the smallest was U. davidiana. However, the difference in length of the IR followed the opposite trend as the SSC, the longest was U. davidiana (26,492 bp) and the shortest was U. davidiana var. japonica (26,017 bp). The number of protein-coding genes ranged from 137 to 145, of which U. davidiana var. japonica had the most and U. pumila had the fewest. These results indicate that several genes have been lost during evolution and different Ulmus species followed different evolutionary routes due to natural selection.
Fig 1. Gene map of the U. pumila chloroplast genome.
Genes drawn inside the circle are transcribed clockwise, while genes outside are transcribed counterclockwise. Gene functional groups are color-coded.
Table 1. Statistics on the basic features of the chloroplast genomes of five Ulmus species.
| Ulmus pumila | Ulmus davidiana Planch. var. | Ulmus macrocarpa | Ulmus davidiana | Ulmus laciniata | |
|---|---|---|---|---|---|
| Length (bp) | 159082 | 159411 | 159439 | 159453 | 158953 |
| GC content (%) | 35.57 | 35.57 | 35.56 | 35.55 | 35.57 |
| AT content (%) | 64.43 | 64.43 | 64.44 | 64.45 | 64.43 |
| LSC length (bp) | 88103 | 88508 | 88547 | 87633 | 88032 |
| SSC length (bp) | 18850 | 18868 | 18853 | 18835 | 18846 |
| IR length (bp) | 26064 | 26017 | 26019 | 26492 | 26037 |
| Gene number | 137 | 145 | 142 | 143 | 139 |
| Gene number in IR regions | 37 | 39 | 39 | 40 | 37 |
| Protein-coding gene number | 83 | 89 | 88 | 88 | 85 |
| Protein-coding gene (%) | 60.58 | 61.38 | 61.97 | 61.54 | 61.15 |
| rRNA gene number | 8 | 8 | 8 | 8 | 8 |
| rRNA (%) | 5.84 | 5.52 | 5.63 | 5.59 | 5.76 |
| tRNA gene number | 46 | 48 | 46 | 47 | 46 |
| tRNA (%) | 33.58 | 33.1 | 32.39 | 32.87 | 33.09 |
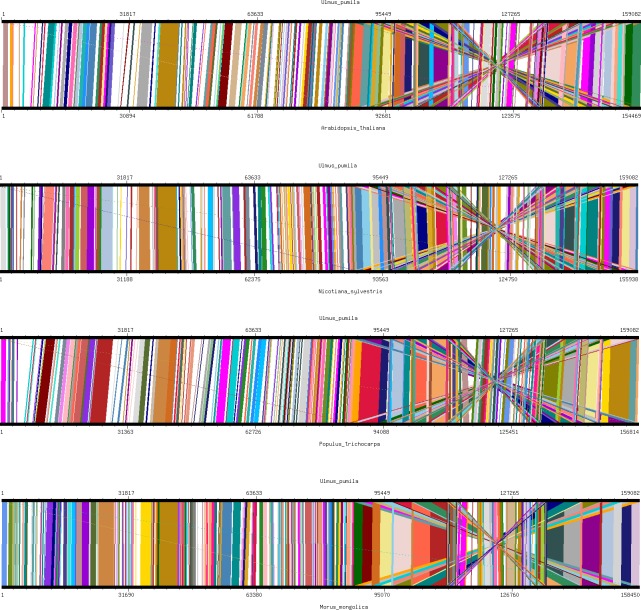
We used the co-linear method to analyze the chloroplast genomes of the five Ulmus species with their close relative Moraceae and other model plants (N. tabacum, A. thaliana, and Populus). The gene order of the chloroplast genomes of the five Ulmus species were highly conserved compared with that of other plants (Fig 2 and S5 Fig). Ulmaceae and Moraceae had the highest chloroplast genome homologies, while there were more common linear relationships among the other model plants. This demonstrates that the chloroplast genome has a high homology among various plants.
Fig 2. Co-linear analysis of various plant chloroplast genomes.
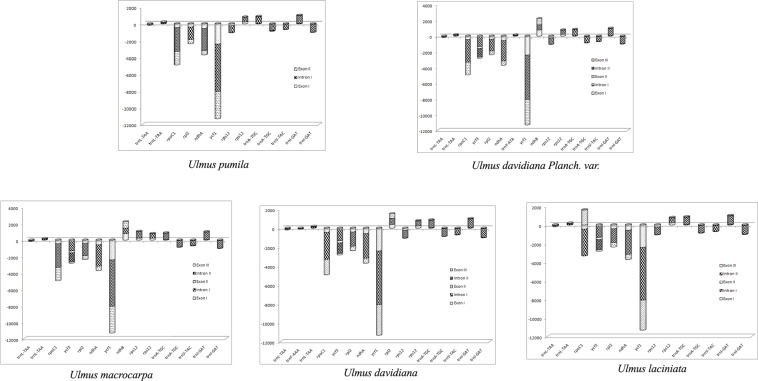
The results of the Ulmus chloroplast coding genes showed that they were similar to those of other plants, and most had no introns. In total, 18 genes contained introns (Table 2). Each Ulmus species had 13–18 of these genes: U. davidiana had 18 genes containing introns, followed by U. davidiana Planch. var. japonica (16), U. macrocarpa (16), U. laciniata (14) and U. pumila (13). All Ulmus species had 13 of the same intron-containing genes (trnL-TAA+, trnL-TAA−, rpoC1−, rpl2−, ndhA−, ycf1−, rps12−, rps12+, trnA-TGC+, trnA-TGC−, trnV-TAC−, trnI-GAT+, and trnI-GAT−), as well as the additional unique genes trnY-ATA and ndhB (U. davidiana var. japonica), ndhB (U. macrocarpa), and trnF-AAA and rpl2 (U. davidiana). All the above genes contained one intron, except ycf3, which had two introns. The intron of ycf1 was the longest (5,675 bp) while that of trnF-AAA was the smallest (53 bp) (Fig 3).
Table 2. Statistics of gene introns in the chloroplast genome of five Ulmus species.
| Gene | Strand | Ulmus pumila | Ulmus davidiana Planch. var. | Ulmus macrocarpa | Ulmus davidiana | Ulmus laciniata |
|---|---|---|---|---|---|---|
| trnL-TAA | - | √ | √ | √ | √ | √ |
| trnL-TAA | + | √ | √ | √ | √ | √ |
| trnF-AAA | - | × | × | × | √ | × |
| rpoC1 | - | √ | √ | √ | √ | √ |
| ycf3 | - | × | √ | √ | √ | √ |
| rpl2 | - | √ | √ | √ | √ | √ |
| ndhA | - | √ | √ | √ | √ | √ |
| trnY-ATA | + | × | √ | × | × | × |
| ycf1 | - | √ | √ | √ | √ | √ |
| ndhB | + | × | √ | √ | × | × |
| rpl2 | - | × | × | × | √ | × |
| rps12 | - | √ | √ | √ | √ | √ |
| rps12 | + | √ | √ | √ | √ | √ |
| trnA-TGC | + | √ | √ | √ | √ | √ |
| trnA-TGC | - | √ | √ | √ | √ | √ |
| trnV-TAC | - | √ | √ | √ | √ | √ |
| trnI-GAT | + | √ | √ | √ | √ | √ |
| trnI-GAT | - | √ | √ | √ | √ | √ |
| Total | 13 | 16 | 16 | 17 | 14 |
Fig 3. Intron length in the chloroplast genomes of five Ulmus species.
Chloroplast gene gain-loss events
Although the structure and composition of the chloroplast genomes of higher plants is relatively conserved, some species have structural variations and gene loss or metastasis due to evolution. In this study, we compared the five Ulmus species with proximal Moraceae, Cannabaceae species and the model plants N. tabacum, A. thaliana, and Populus (Table 3 and Table 4), we determined that infA, lhbA, sprA, and ycf68 were readily lost during evolution, followed by psbL, rps16, rrn5S, petB, petD, rrn16S, rrn23S, rrn4.5S. The comparative results of five Ulmus species showed that U. davidiana had lost trnH compared with the other four elms. Moreover, U. laciniata had lost ndhC gene compared with the other four kinds of elms.
Table 3. Genes from the chloroplast genomes of various plant species.
| Name of species | atpF | infA | lhbA | ndhC | petB | petD | psbL | psbZ | rpl32 | rps12 | rps16 | rrn16S | rrn23S | rrn4.5S | rrn5S | sprA | trnA | trnC | trnD | trnE |
|---|---|---|---|---|---|---|---|---|---|---|---|---|---|---|---|---|---|---|---|---|
| Ulmus davidiana | + | - | - | + | - | - | - | + | + | + | - | + | + | + | + | - | + | + | + | + |
| Arabidopsis thaliana | + | - | - | + | + | + | + | + | + | + | + | + | + | + | - | - | + | + | + | + |
| Ulmus pumila | - | - | - | + | - | - | - | + | + | + | - | + | + | + | + | - | + | + | + | + |
| Populus trichocarpa | + | + | - | + | + | + | + | + | - | + | - | - | - | - | - | - | + | - | - | - |
| Ulmus laciniata | + | - | - | - | - | - | - | + | + | + | - | + | + | + | + | - | + | + | + | + |
| Morus mongolica | + | - | - | + | + | + | + | + | + | + | + | - | - | - | - | - | + | + | + | + |
| Cannabis sativa cultivar Carmagnola | + | - | + | + | + | + | + | - | + | + | + | - | - | - | - | - | + | + | + | + |
| Ficus racemosa | + | - | - | + | + | + | - | + | + | - | + | + | + | + | + | - | - | + | + | + |
| Morus notabilis | + | - | - | + | + | + | + | + | + | + | + | - | - | - | - | - | + | + | + | + |
| Morus indica | + | - | - | + | + | + | + | + | + | + | + | + | + | + | + | - | + | + | + | + |
| Ulmus davidiana Planch. var. japonica (Rehd.) Nakai | + | - | - | + | - | - | - | + | + | + | - | + | + | + | + | - | + | + | + | + |
| Ulmus macrocarpa | + | - | - | + | - | - | - | + | + | + | - | + | + | + | + | - | + | + | + | + |
| Nicotiana sylvestris | + | - | - | + | + | + | + | + | + | + | + | + | + | + | + | + | + | + | + | + |
| Cannabis sativa cultivar Yoruba Nigeria | + | - | - | + | + | + | + | + | + | + | + | - | - | - | - | - | + | + | + | + |
| Total number of missing gene | 1 | 13 | 13 | 1 | 5 | 5 | 6 | 1 | 1 | 1 | 6 | 5 | 5 | 5 | 6 | 13 | 1 | 1 | 1 | 1 |
Table 4. Genes from the chloroplast genomes of various plant species.
| Name of species | trnF | trnG | trnH | trnI | trnK | trnL | trnM | trnN | trnP | trnQ | trnR | trnS | trnT | trnV | trnW | trnY | ycf1 | ycf15 | ycf3 | ycf68 |
|---|---|---|---|---|---|---|---|---|---|---|---|---|---|---|---|---|---|---|---|---|
| Ulmus davidiana | + | + | - | + | + | + | + | + | + | + | + | + | + | + | + | + | + | + | + | - |
| Arabidopsis thaliana | + | + | + | + | + | + | + | + | + | + | + | + | + | + | + | + | + | - | + | - |
| Ulmus pumila | + | + | + | + | + | + | + | + | + | + | + | + | + | + | + | + | + | + | - | - |
| Populus trichocarpa | - | - | - | + | + | - | - | - | - | - | - | - | - | - | - | - | - | - | + | - |
| Ulmus laciniata | + | + | + | + | + | + | + | + | + | + | + | + | + | + | + | + | + | + | + | - |
| Morus mongolica | + | + | + | + | + | + | + | + | + | + | + | + | + | + | + | + | + | - | + | - |
| Cannabis sativa cultivar Carmagnola | + | + | + | + | + | + | + | + | + | + | + | + | + | + | + | + | + | + | + | + |
| Ficus racemosa | + | + | - | - | - | + | + | + | + | + | + | + | + | + | + | + | + | + | + | - |
| Morus notabilis | + | + | + | + | + | + | + | + | + | + | + | + | + | + | + | + | + | - | + | - |
| Morus indica | + | + | + | + | + | + | + | + | + | + | + | + | + | + | + | + | + | - | + | - |
| Ulmus davidiana Planch. var. japonica (Rehd.) Nakai | + | + | + | + | + | + | + | + | + | + | + | + | + | + | + | + | + | + | + | - |
| Ulmus macrocarpa | + | + | + | + | + | + | + | + | + | + | + | + | + | + | + | + | + | + | + | - |
| Nicotiana sylvestris | + | + | + | + | + | + | + | + | + | + | + | + | + | + | + | + | + | - | + | - |
| Cannabis sativa cultivar Yoruba Nigeria | + | + | + | + | + | + | + | + | + | + | + | + | + | + | + | + | + | - | + | - |
| Total number of missing gene | 1 | 1 | 3 | 1 | 1 | 1 | 1 | 1 | 1 | 1 | 1 | 1 | 1 | 1 | 1 | 1 | 1 | 7 | 1 | 13 |
This gene loss phenomenon had also occurred in other plants. For example, the ndh gene family has been lost in the Pinus chloroplast genome [22]. Some of the genes ycfL, ycf2, RPL23, infA, and rpsl6 have been lost in some angiosperms, and even all have been lost in some legumes [23]. The gene loss phenomenon may caused by the following two points: one side, different plants were subjected of different environmental pressures. The genes beneficial to plant growth were preserved, while some unimportant genes were lost in the long-term evolution. For example, most genes related to photosynthesis have been lost in parasitic plants (e.g., E. virginiana, O. gracilis, and P. purpurea). Another important reason may be due to gene transfer. A number of studies have reported that the gene migration phenomenon were occurred between the chloroplast, mitochondria and nuclear genomes, and this genes transfer has been continuing. For example, there are a large number of sequences from the chloroplast and its ancestral Cyanobacteria were found in the nuclear genome of arabidopsis, rice and tobacco [24–27].
Codon preference analysis
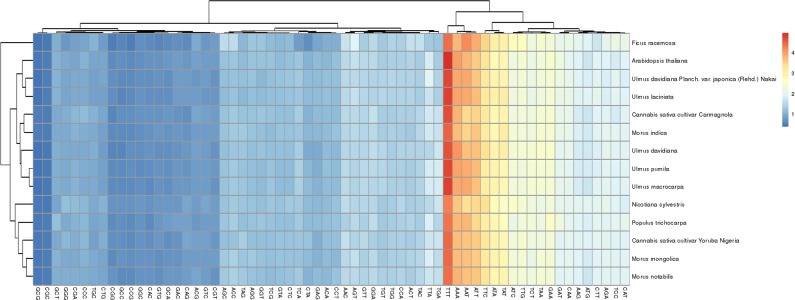
In the Ulmus chloroplast genomes, 62% of the sequences were gene-coding regions, in which the vast majority of the sequences were protein-coding sequences. Based on the statistical analysis of all protein-coding genes and codons, we determined that all analytic varieties showed obvious codon preferences, and that the amino acids of proteins in the five Ulmus species were similar, of which TTT, AAT, AAA, ATT, and TTC had the highest frequencies (Fig 4). There was a high A/T preference in the third codon, which is very common in the chloroplast genomes of higher plants [28–32].
Fig 4. Codon distribution of all merged protein-coding genes.
Color key: Red indicates a higher frequency and blue indicates a lower frequency.
Codon degeneracy, whereby one amino acid has two or more codons, is very common. It is important biologically, as it can reduce the effects of harmful mutations in plants. If there were no selective pressure or mutation preference, nucleotide mutations in each amino acid site would be random, and the probability of synonymous codon usage would be the same. However, synonymous codon use is not random, and various genes in some species tend to use certain synonymous codons, which is known as synonymous codon usage bias. The relative synonymous codon usage (RSCU) is the ratio between the frequency of use and the expected frequency of a particular codon, and is an effective index to measure the degree of codon preference [33]. According to the RSCU (0.09–1.92) [34], synonymous codon preference can be partitioned into four models artificially: no preference (RSCU ≤ 1.0), low preference (1.0 < RSCU < 1.2), moderate preference (1.2 ≤ RSCU ≤ 1.3), and high preference (RSCU > 1.3).
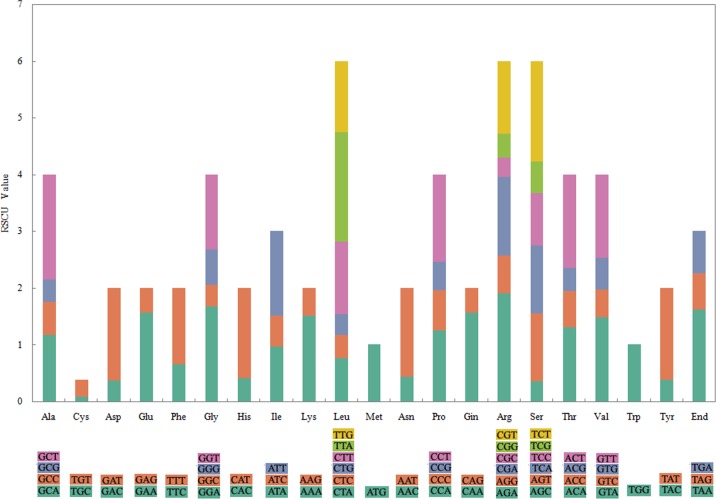
There were 64 codons encoding 20 amino acids in the chloroplast protein-coding genes of the five Ulmus species (Fig 5), and most of the amino acid codons, except methionine and tryptophan, had preferences; in total, we identified 31 codon preferences involving 18 amino acids and one stop codon. According to the synonymous codon preference partitions, 83.34% and 12.35% of all preferred codons exhibited high and moderate preferences, respectively. High codon preference is very common in chloroplast genes of higher plants, and is the main reason for the relative conservation of chloroplast genes.
Fig 5. Codon content of 20 amino acid and stop codons in all protein-coding genes.
Selection pressure analysis of evolution
In genetics, Ka/Ks represents the ratio of non-synonymous substitution (Ka) to synonymous substitution (Ks). This ratio can determine whether selective pressure is acting on a particular protein-coding gene. In evolutionary analyses, it is important to understand the rate of synonymous and non-synonymous mutations. It is generally believed that mutations are not affected by natural selection, but that non-synonymous mutations are affected by natural selection. If Ka/Ks > 1, the gene is affected by positive selection, if Ka/Ks = 1, the gene is affected by neutral evolution, and if Ka/Ks < 1, the gene is affected by negative selection.
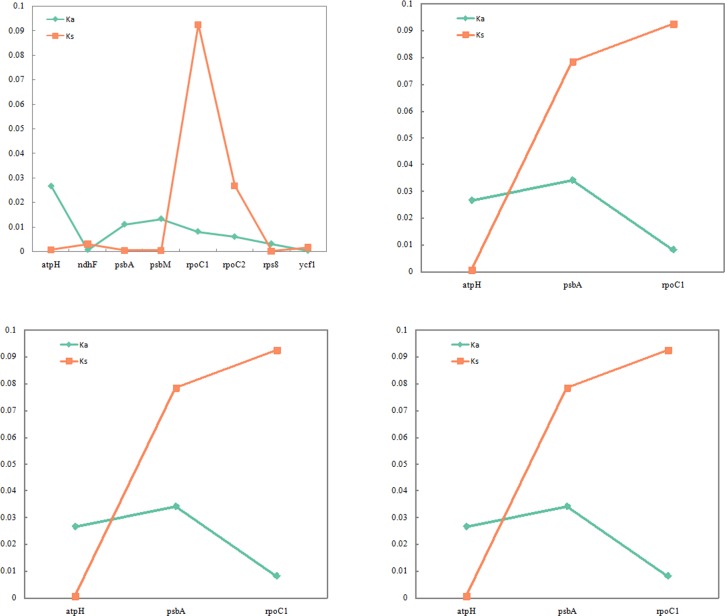
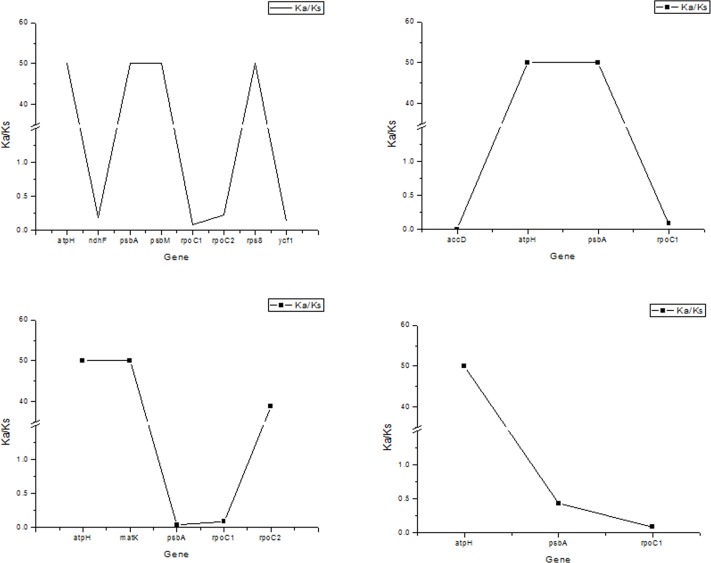
We found 8, 4, 5, and 3 protein-coding genes that exhibited single nucleotide polymorphisms, with the most observed in U. davidiana var. japonica and the fewest in U. laciniata (Fig 6). The Ka and Ks values of all Ulmus species were low (< 0.1), indicating that the Ulmus chloroplast protein-coding genes are relatively well conserved. Further analysis of Ka/Ks was used to determine whether selective pressure has acted on protein-coding genes. The genes atpH, psbA, psbM, and rps8 in U. davidiana var. japonica were subjected positive selective pressure, whereas ndhF, rpoC1, rpoC2, and ycf1 were subjected negative selection (Fig 7). Similarly, atpH and psbA were subjected to positive selective pressure, accD and rpoC1 were subjected to negative selection in U. macrocarpa. Moreover, atpH, matK, and ropC2 were subjected to positive selective pressure, psbA and rpoC1 were subjected to negative selection in U. davidiana. Finally, atpH was subjected to positive selective pressure, psbA and rpoC1 were subjected to negative selection in U. laciniata. All above indicated that the evolutionary route of chloroplast genes were different among different elms. For example, compared with U. pumila, psbA gene was subjected positive selective pressure in U. davidiana var. japonica and U. macrocarpa, whereas psbA gene was subjected negative selection in U. davidiana and U. laciniata. This indicates that the Ulmus chloroplast genomes have been influenced by different environmental pressures during evolution and this may the main reason for the difference of genes number in five Ulmus species.
Fig 6. The Ka and Ks values of five Ulmus species.
A–D represent the Ka and Ks values of U. davidiana var. japonica, U. macrocarpa, U. davidiana, and U. laciniata with respect to U. pumila.
Fig 7. Ka/Ks values of five Ulmus species.
A–D represent the Ka/Ks values of U. davidiana var. japonica, U. macrocarpa, U. davidiana, and U. laciniata with respect to U. pumila.
IR contraction analysis
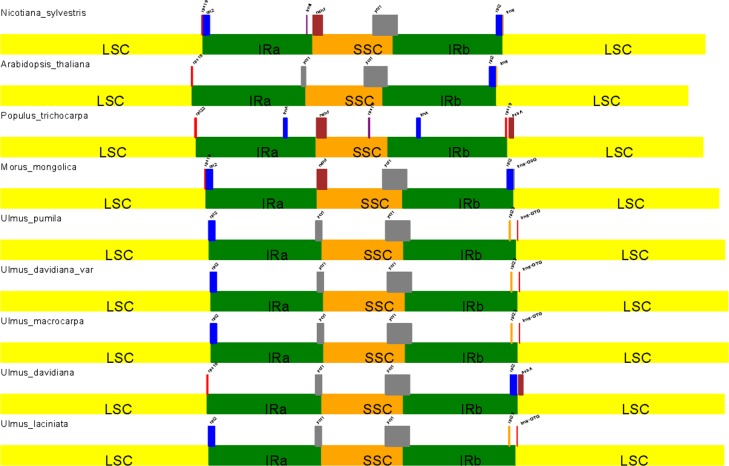
Although the IR region of the chloroplast genome is considered to be the most conserved region, border region contraction and expansion is common during evolution and is the main driver of chloroplast genome length variability. In this study, we compared the IR-LSC and IR-SSC boundary conditions of the five Ulmus species with those of Moraceae, N. tabacum, A. thaliana, and Populus (Fig 8). The IRa/LSC boundaries of U. pumila, U. laciniata, U. davidiana var. japonica, U. macrocarpa, Moraceae, and N. tabacum all expanded and extended into rpl2. However, rpl2 gene did not exist in U. davidiana, N. tabacum, Populus, and the IRa/LSC boundary expansion extended into rps19 and rps22, respectively. The IRa/SSC regions of the five elms and A. thaliana all expanded into ycf1. The IRb/SSC boundaries of all plants extended into ycf1, although Populus had lost the ycf1 gene. IRb/LSC boundaries of all Ulmus species extended into rpl23, with the trnH located downstream, except in U. davidiana. However, the IRb/LSC boundaries of U. davidiana, N. tabacum, A. thaliana, and Moraceae extended into rpl12.
Fig 8. IR contraction analysis of various plant species.
Phylogenetic analysis
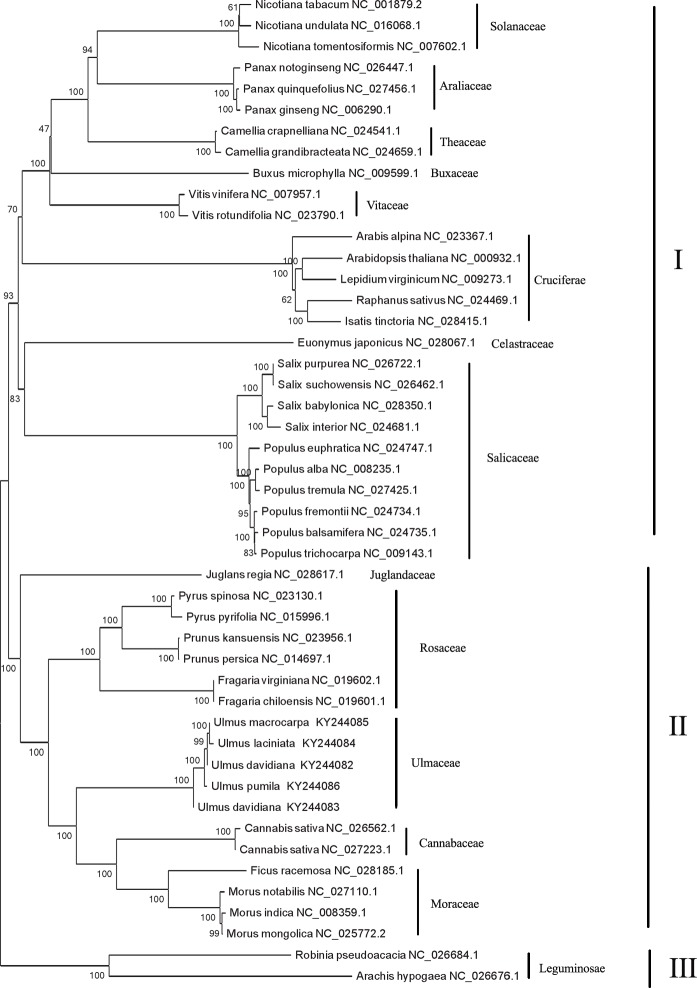
To determine the phylogenetic positions of Ulmus species, we performed a phylogenetic analysis using 52 common chloroplast protein-coding genes from 42 species published in NCBI. The clusters were well supported and the test scores of most of the branch nodes reached 100%, indicative of high reliability. From the analysis, all 47 plants were divided into three classes; the first class consisted of 27 species in Solanaceae, Araliaceae, Theaceae, Buxaceae, Vitaceae, Cruciferae Celastraceae, and Salicaceae, while the second class consisted of 18 species in Juglandaceae, Rosaceae, Ulmaceae, and Moraceae. The third class only consisted of two species that Robinia pseudoacacia and Arachis hypogaea (Fig 9).
Fig 9. The ML phylogenetic tree of the Ulmaceae clade based on same protein-coding genes.
Numbers above or below the nodes are bootstrap support values.
The first class can also be subdivided into two categories. In the first category, the phylogenetic relationship of Salicaceae and Celastraceae were closer. Furthermore, Populus and Salix could be distinguished completely in Salicaceae. It is demonstrated that P. alba and P. tremula belong to white poplar and have the closest phylogenetic relationship inside the Populus, whereas P. euphratica have rather distant phylogenetic relationships that separated into an independent branch. In the second category, Solanaceae, Araliaceae, Theaceae, Buxaceae and Vitaceae have closer relationship, while Cruciferae have more distant relatives. The second class can also be subdivided into 3 categories and almost all of the test scores of the branch nodes reached 100%. Compared with other plants, Juglans regia had a further genetic relationship and were separated into an independent category. In the Rosaceae family (the second category), Pyrus (P. spinosa, P. pyrifolia) had closer relationship with Amygdalus (P. persica, P. kansuensis), while Strawberry (F. virginiana, F. chiloensis) had further relationship. The third category were consisted of Ulmaceae, Moraceae, and Cannabaceae, in addition, all plants belonged to Urticales. Therefore, the resulting phylogenetic topologies analysis were with high bootstrap supports and provided the evolutionary placement and relationship of Ulmaceae. The results strongly support the position of Ulmaceae as a member of the order Urticales. Finally, Robinia pseudoacacia and Arachis hypogaea (Leguminosae) had further relationship with other 45 plants and separated into an independent branch.
As the primitive group of Urticales, previous studies on the phylogeny of Ulmus mainly focused on its phenotypic traits (e.g., petals, pollen, epidermal micromorphology, embryology, anatomy, and pericarp) and chromosome, which lacked molecular evidence. However, due to the convergence of some characteristics and simplification of its flower structure, it is difficult to classify Ulmus. Ulmaceae classification has been a focus debate among taxonomists, including the position of Ulmaceae and the relationship between Ulmus species with other Urticales species. The clustering results showed that Moraceae and Cannabaceae were closest to Ulmaceae, followed by Rosaceae. Wiegrefe [35] obtained the same conclusion from an analysis of a chloroplast DNA restriction enzyme map of Ulmaceae. Ulmaceae, Cannabaceae, and Moraceae all belonged to Urticales, and the chloroplast genome clustering results were consistent with their traditional taxonomies. The results strongly support the position of Ulmaceae as a member of the order Urticales. However, some of the chloroplast genome classifications of the five Ulmus species were inconsistent with traditional taxonomy. In particular, traditional taxonomy places the phylogenetic relationship of U. davidiana and U. davidiana var. japonica closer together, and there may be other errors that need to be identified.
Traditional taxonomy is more dependent on plant phenotype to distinguish species; however, phenotypic traits, such as samara and leaf shape, are frequently influenced by the environment. Therefore, there are many homonyms and synonyms in classical taxonomy that are inconsistent with their origin. With a relatively independent evolutionary path, the chloroplast genome is widely used to analyze genetic evolution and identify plant species. However, the chloroplast genome is smaller and contains less genetic information. To determine whether there are errors in the traditional taxonomy of U. davidiana and U. davidiana var. japonica, further analyses using their nuclear genomes should be conducted.
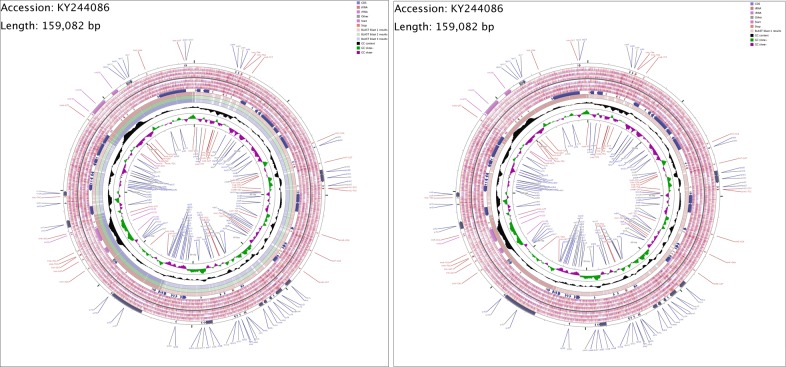
To analyze the genetic variation of the Ulmus species, we used the chloroplast genome of U. pumila as a reference and analyzed single nucleotide variations (SNV) and indel variations in their chloroplast genomes using the GCView Server (http://stothard.afns.ualberta.ca/cgview_server/index.html) (Fig 10). U. davidiana var. japonica had the most mutation sites (total, 360; SNV, 286; indel, 74), followed by U. davidiana (total, 351; SNV, 296; indel, 55), U. laciniata (total, 318; SNV, 260; indel, 58), and U. macrocarpa (total, 297; SNV, 251; indel, 46) (S1 Table). Due to maternal inheritance of the chloroplast genome, most of the genes in the chloroplast were conserved, except for small portions of genes. Most of the mutations were located between genes, whereas eight genes in U. davidiana var. japonica, six in U. davidiana and U. macrocarpa, and seven in U. laciniata contained variations. The gene rpoC1 had the most variation sites.
Fig 10. Comparison of chloroplast genome of five Ulmus species.
Fig 10A and Fig 10B were take U pumila L as contrast, In Fig 10A blast 1 to blast 3 were U. davidiana Planch.var. japonica (Rehd.) Nakai, U. macrocarpa Hance., and U. davidiana Planch. Fig 10B blast 1 was U. laciniata Mayr. Ring 1: Forward strand features from Ulmus pumila L. Rings 2,3,4: Forward strand start and stop codons in reading frames 3,2,1. Rings 5,6,7: Reverse strand start and stop codons in reading frames 1,2,3. Ring 8: Forward strand features from U. pumila L. Rings 9,10,11: Blast result of chloroplast genome 1,2,3. Ring 12: GC content of U. pumila L.
Conclusions
In this study, we report five Ulmus species chloroplast genomes by de novo sequencing. The lengths of the chloroplast genomes from five Ulmus species ranged from 158,953 to 159,453 bp, with the largest in U. davidiana and the smallest in U. laciniata. The number of protein-coding genes ranged from 137 to 145, of which U. davidiana var. japonica and U. pumila had the most and U. laciniata had the fewest. Almost all protein-coding sequences and amino acid codons showed obvious codon preferences. Selection pressure analysis indicated that different Ulmus chloroplast genomes have been influenced by different environmental pressures during long-term evolution and this may the main reason for the difference of genes number in five Ulmus species. The phylogenetic analysis results strongly supported the position of Ulmaceae as a member of the order Urticales. However, we found a potential error in the traditional taxonomies of U. davidiana and U. davidiana var. japonica, which should be confirmed with a further analysis of their nuclear genomes. This study is the first report on the chloroplast genome of Ulmus and has significance for research on photosynthesis, evolution, and chloroplast transgenic engineering.
Supporting information
Genes drawn inside the circle are transcribed clockwise, while genes outside are transcribed counterclockwise. Gene functional groups are color-coded.
(TIF)
Genes drawn inside the circle are transcribed clockwise, while genes outside are transcribed counterclockwise. Gene functional groups are color-coded.
(TIF)
Genes drawn inside the circle are transcribed clockwise, while genes outside are transcribed counterclockwise. Gene functional groups are color-coded.
(TIF)
Genes drawn inside the circle are transcribed clockwise, while genes outside are transcribed counterclockwise. Gene functional groups are color-coded.
(TIF)
(TIF)
(XLS)
Data Availability
All sequencing data underlying the study can be found at NCBI with the following accession numbers: Ulmus macrocarpa (KY244085), Ulmus laciniata (KY244084), Ulmus davidiana (KY244082), Ulmus pumila (KY244086), Ulmus davidiana (KY244083). All other relevant data is within the manuscript and its Supporting Information files.
Funding Statement
The funders had no role in study design, data collection and analysis, decision to publish, or preparation of the manuscript.
References
- 1.Dias MC, Monteiro C, Moutinho-Pereira J, Correia C, Gonçalves B, Santos C (2013) Cadmium toxicity affects photosynthesis and plant growth at different levels. Acta Physiologiae Plantarum 35: 1281–1289. [Google Scholar]
- 2.Conde P, Sousa A, Costa A, Santos C (2008) A protocol for Ulmus minor Mill. micropropagation and acclimatization. Plant Cell Tissue and Organ Culture 92: 113–119. [Google Scholar]
- 3.Leliaert F, Smith DR, Moreau H, Herron MD, Verbruggen H, Delwiche CF, et al. (2012) Phylogeny andMolecular Evolution of the Green Algae Crit Rev Plant Sci 31: 1–46. [Google Scholar]
- 4.Wolfe KH, Li WH, Sharp PM (1987) Rates of nucleotide substitution vary greatly among plant mitochondrial, chloroplast, and nuclear DNAs. Proceedings of the National Academy ofSciences 84(24): 9054–9058. [DOI] [PMC free article] [PubMed] [Google Scholar]
- 5.Bremer B, Bremer K, Heidari N, Erixon P, Olmstead RG, Anderberg AA. et al. (2002) Phylogenetics of asterids based on 3 coding and 3non-coding chloroplast DNA markers and the utility of non-coding DNA at higher taxonomiclevels. Molecular phylogenetics and evolution 24(2): 274–301. [DOI] [PubMed] [Google Scholar]
- 6.Neuhaus HE and Ernes MJ (2000) Nonphotosyntiietic Metabolism in Plastids. Annual Review of Plant Physiology and Plant Molecular Biology 51: 111–140. 10.1146/annurev.arplant.51.1.111 [DOI] [PubMed] [Google Scholar]
- 7.Tian X and Li DZ (2002) Application of DNAsequences in plant phylogenetic study. Acta BotanicaYunnanica 24(2): 170–184. [Google Scholar]
- 8.Ris H and Plaut W (1962) Ultrastructure of DNA-containing areas in the chloroplast ofChlamydomonas. The Journal of cell biology 13:383–391. [DOI] [PMC free article] [PubMed] [Google Scholar]
- 9.Bedbrook JR and Bogorad L (1976) Endonuclease Recognition Sites Mapped on Zea-MaysChloroplast DNA. Proceedings of the National Academy of Sciences of the UnitedStates of America 73(12):4309–4313. [DOI] [PMC free article] [PubMed] [Google Scholar]
- 10.Hallick RB, Hong L, Drager RG, Favreau MR, Monfort A, Orsat B, et al. (1993) Complete sequence of Euglena gracilischloroplast DNA. Nucleic Acids Research 21(15): 3537–44. [DOI] [PMC free article] [PubMed] [Google Scholar]
- 11.Reith M and Munholland J (1995) Complete nucleotide sequence of the Porphyra purpureachloroplast genome. Plant Molecular Biology Reporter 13 (4): 333–335. [Google Scholar]
- 12.Magee AM, Aspinall S, Rice DW, Cusack BP, Sémon M, Perry AS, et al. (2010) Localized hypermutation and associatedgene losses in legume chloroplast genomes. Genome Research 20 (12):1700–10. 10.1101/gr.111955.110 [DOI] [PMC free article] [PubMed] [Google Scholar]
- 13.Gao LZ, Zhao YJ, Gao J, Huang H, Hu N, Shi C (2012) An improved chloroplast DNA extraction procedure for whole plastid genome sequencing. Plos one 7(2):e31468 10.1371/journal.pone.0031468 [DOI] [PMC free article] [PubMed] [Google Scholar]
- 14.Luo RB, Liu BH, Xie YL, Li ZY, Huang WH, Yuan JY, et al. (2012) SOAPdenovo2: an empirically improved memory-ecient short-read de novo assembler. Gigascience 1 (1): 18 10.1186/2047-217X-1-18 [DOI] [PMC free article] [PubMed] [Google Scholar]
- 15.Kent WJ (2002) BLAT–the BLAST-like alignment tool. Genome Research 12 (4): 656–664. 10.1101/gr.229202 [DOI] [PMC free article] [PubMed] [Google Scholar]
- 16.Liu C, Shi LC, Zhu YJ, Chen HM, Zhang JH, Lin XH, et al. (2012) CpGAVAS, anintegratedwebserverfortheannotation, visualization, analysis, and GenBank submission of completely sequenced chloroplast genome sequences. BMC Genomics 13: 715 10.1186/1471-2164-13-715 [DOI] [PMC free article] [PubMed] [Google Scholar]
- 17.Wang DP, Zhang YB, Zhang Z, Zhu J, Yu J (2010) KaKs_Calculator 2.0: a toolkit incorporating gamma-series methods and sliding window strategies. Genomics Proteomics Bioinformatics 8(1):77–80. 10.1016/S1672-0229(10)60008-3 [DOI] [PMC free article] [PubMed] [Google Scholar]
- 18.Revanna KV, Chiu CC, Bierschank E, Dong Q (2011) gsv: a web-based genome synteny viewer for customized data. BMC Bioinformatics 12(1):316. [DOI] [PMC free article] [PubMed] [Google Scholar]
- 19.Tamura K, Stecher G, Peterson D, Filipski A, Kumar S (2013) MEGA6: molecular evolutionary genetics analysis version 6.0. Mol. Biol. Evol. 30 (12): 2725–2729. 10.1093/molbev/mst197 [DOI] [PMC free article] [PubMed] [Google Scholar]
- 20.Ni LH, Zhao ZL, Xu HX, Chen SL, Dorje G (2016) The complete chloroplast genome of Gentiana straminea (Gentianaceae), an endemic species to the Sino-Himalayan subregion. Gene 577(2):281–288. 10.1016/j.gene.2015.12.005 [DOI] [PubMed] [Google Scholar]
- 21.Wang Y, Zhan DF, Jia X, Mei WL, Dai HF, Chen XT, et al. (2016) Complete chloroplast genome sequence of Aquilaria sinensis (Lour.) Gilg and evolution analysis within the malvales order. Frontiers in Plant Science 7:280–292. 10.3389/fpls.2016.00280 [DOI] [PMC free article] [PubMed] [Google Scholar]
- 22.Wakasugi T, Tsudzuki J, Ito S, Nakashima K, Tsudzuki T, Sugiura M. (1994) Loss of all ndh genes as determined bysequencing the entire chloroplast genome of the black pine Pinus thunbergii. Proceedings of the National Academy of Sciences 91 (21): 9794–9798. [DOI] [PMC free article] [PubMed] [Google Scholar]
- 23.Wolfe KH, Morden CW, Ems SC, Palmer JD (1992) Rapid evolution of the plastid translational apparatus in a nonphotosynthetic plant: loss or accelerated sequence evolution of tRNA and ribosomal protein genes. Journal of Molecular Evolution 35 (4): 304–17 [DOI] [PubMed] [Google Scholar]
- 24.Martin W, Rujan T, Richly E, Hansen A, Cornelsen S, Lins T, Leister D, et al. (2002) Evolutionary analysis of Arabidopsis, cyanobacterial, and chloroplast genomes reveals plastid phylogeny and thousandsof cyanobacterial genes in the nucleus. Proc Natl Acad Sci USA 99(19): 12246–12251. 10.1073/pnas.182432999 [DOI] [PMC free article] [PubMed] [Google Scholar]
- 25.Matsuo M, Ito Y, Yamauchi R, Obokataa J (2005) The rice nuclear genome continuouslyintegrates, shuffles,and eliminates the chloroplast genome to cause chloroplast-nuclear DNA flux. Plant Cell 17 (3): 665–675. 10.1105/tpc.104.027706 [DOI] [PMC free article] [PubMed] [Google Scholar]
- 26.Stegemann S, Bock R (2006) Experimental reconstruction of functional gene transferfrom the tobacco plastid genome to the nucleus. Plant Cell 18 (11):2869–2878. 10.1105/tpc.106.046466 [DOI] [PMC free article] [PubMed] [Google Scholar]
- 27.Goremykin VV, Lockhart PJ, Viola R, Velasco1 R (2012) The mitochondrial genome of Malusdomestica and the import-driven hypothesis of mitochondrial genome expansionin seed plants. Plant Journal 71(4): 615–626. 10.1111/j.1365-313X.2012.05014.x [DOI] [PubMed] [Google Scholar]
- 28.Clegg MT, Gaut BS, Leam GH, Morton BR (1994) Rates and patterns of chloroplast DNA evolution. Proc Natl Acad Sci USA 91(15): 6795–6801. [DOI] [PMC free article] [PubMed] [Google Scholar]
- 29.Yang M, Zhang XW, Liu GM, Yin YX, Chen KF, Yun QZ, et al. (2010) The complete chloroplast genome sequence ofdate palm (Phoenix dactylifera L.). PLoS One 5 (9): el2762. [DOI] [PMC free article] [PubMed] [Google Scholar]
- 30.Nie XJ, Lv SZ, Zhang YX, Du XH, Wang L, Biradar SS, et al. (2012) Complete chloroplast genome sequence of a major invasive species, crofton weed (Ageratina adenophord). PLos One 7(5): e36869 10.1371/journal.pone.0036869 [DOI] [PMC free article] [PubMed] [Google Scholar]
- 31.Tangphatsomruang S, Sangsrakru D, Chanprasert J, Uthaipaisanwong P, Yoocha T, Jomchai N, et al. (2010) The chloroplast genomesequence of mungbean (Vigna radiatd) determined by high-throughputpyrosequencing: structural organization and phylogenetic relationships. DNAResearch, 17(1): 11–22. [DOI] [PMC free article] [PubMed] [Google Scholar]
- 32.Yi DK and Kim KJ. (2012) Complete chloroplast genome sequences of important oilseedcrop Sesamum indicum L. PLos One 7(5): e35872 10.1371/journal.pone.0035872 [DOI] [PMC free article] [PubMed] [Google Scholar]
- 33.Sharp PM and Li WH (1987) The codon Adaptation Index-a measure of directional synonymous codon usage bias, and its potential applications. Nucleic Acids Res 15(3): 1281–1295. [DOI] [PMC free article] [PubMed] [Google Scholar]
- 34.Zhao JJ, Qi B, Ding LJ, Tang XQ (2010) Based on RSCU and QRSCU research codon bias of F/10 and G/11 Xylanase. Journal of Food Science and Biotechnology 29(5):755–764. [Google Scholar]
- 35.Wiegrefe SJ, Sytsma KJ, Guries RP (1998) The Ulmaceae, one family or two? Evidence from chloroplast DNA restriction site mapping. PlSyst Evol 210:249–270. [Google Scholar]
Associated Data
This section collects any data citations, data availability statements, or supplementary materials included in this article.
Supplementary Materials
Genes drawn inside the circle are transcribed clockwise, while genes outside are transcribed counterclockwise. Gene functional groups are color-coded.
(TIF)
Genes drawn inside the circle are transcribed clockwise, while genes outside are transcribed counterclockwise. Gene functional groups are color-coded.
(TIF)
Genes drawn inside the circle are transcribed clockwise, while genes outside are transcribed counterclockwise. Gene functional groups are color-coded.
(TIF)
Genes drawn inside the circle are transcribed clockwise, while genes outside are transcribed counterclockwise. Gene functional groups are color-coded.
(TIF)
(TIF)
(XLS)
Data Availability Statement
All sequencing data underlying the study can be found at NCBI with the following accession numbers: Ulmus macrocarpa (KY244085), Ulmus laciniata (KY244084), Ulmus davidiana (KY244082), Ulmus pumila (KY244086), Ulmus davidiana (KY244083). All other relevant data is within the manuscript and its Supporting Information files.


