

Single-parent expression genes are nonsyntenic and stable throughout fluctuating water availability, underscoring their role in the early developmental manifestation of heterosis in maize.
Abstract
Heterosis is the superior performance of F1 hybrids compared with their homozygous, genetically distinct parents. In this study, we monitored the transcriptomic divergence of the maize (Zea mays) inbred lines B73 and Mo17 and their reciprocal F1 hybrid progeny in primary roots under control and water deficit conditions simulated by polyethylene glycol treatment. Single-parent expression (SPE) of genes is an extreme instance of gene expression complementation, in which genes are active in only one of two parents but are expressed in both reciprocal hybrids. In this study, 1,997 genes only expressed in B73 and 2,024 genes only expressed in Mo17 displayed SPE complementation under control and water deficit conditions. As a consequence, the number of active genes in hybrids exceeded the number of active genes in the parental inbred lines significantly independent of treatment. SPE patterns were substantially more stable to expression changes by water deficit treatment than other genotype-specific expression profiles. While, on average, 75% of all SPE patterns were not altered in response to polyethylene glycol treatment, only 17% of the remaining genotype-specific expression patterns were not changed by water deficit. Nonsyntenic genes that lack syntenic orthologs in other grass species, and thus evolved late in the grass lineage, were significantly overrepresented among SPE genes. Hence, the significant overrepresentation of nonsyntenic genes among SPE patterns and their stability under water limitation might suggest a function of these genes during the early developmental manifestation of heterosis under fluctuating environmental conditions in hybrid progeny of the inbred lines B73 and Mo17.
Maize (Zea mays) is a fundamental source of food, feed, and energy (Persson et al., 2009). Maize displays a remarkable degree of structural intraspecific genomic diversity, which is likely unparalleled among higher eukaryotes (Springer et al., 2009; Swanson-Wagner et al., 2010). The divergence between different maize genotypes is the consequence of copy number variation, presence/absence variation (PAV), single-nucleotide polymorphisms (SNPs), and insertion-deletion polymorphisms. Between the widely used inbred lines B73 and Mo17, thousands of structural variations (Springer et al., 2009; Swanson-Wagner et al., 2010), differences in total genome size (Laurie and Bennett, 1985), and content of repetitive DNA (Kato et al., 2004) have been detected, underscoring their high degree of intraspecific variation. Syntenic genes are defined by their preserved colocalization on chromosomes of different species. A syntenic comparison of the genomes of grass species demonstrated that the lineage leading to maize experienced a whole-genome duplication about 5 to 12 million years ago (Blanc and Wolfe, 2004; Swigonová et al., 2004). Comparisons of the duplicated genome of modern maize with orthologous regions of its unduplicated progenitor sorghum (Sorghum bicolor) revealed that many of the duplicated maize genes disappeared in the course of evolution (Haberer et al., 2005). Nevertheless, 3,000 to 5,000 pairs of paralogs are retained in modern maize (Schnable et al., 2011). The synteny to sorghum allows a subdivision of the maize genome into two distinct subgenomes. Each of these subgenomes originally contained a complete set of genomic information. Thus, the gene complement of modern maize can be divided into three categories: (1) pairs of duplicate genes that are shared by both subgenomes; (2) single-copy genes present in only one of the two subgenomes; and (3) genes that cannot be assigned to any subgenome. This third class of genes is characterized by a lack of syntenic orthologs in the genomes of other grass species. Most of these nonsyntenic genes emerged by single-gene duplication mechanisms, most likely after the last genome duplication of maize (Woodhouse et al., 2010).
Heterosis or hybrid vigor denotes the superior performance of heterozygous F1 plants compared with their genetically distinct, homozygous parents (for review, see Falconer and Mackay, 1996). Hybrid vigor was monitored for traits such as biomass and grain yield but also resistance to environmental cues, such as drought stress (Araus et al., 2010). The phenomenon of heterosis is often associated with transcriptional variation between inbred lines and hybrids (Hochholdinger and Hoecker, 2007). For instance, gene expression in hybrids that is significantly different from the average of the parental inbred lines (midparent value) is described as nonadditive (Birchler et al., 2003; Stupar and Springer, 2006). Moreover, in maize primary roots and their tissues, hundreds of genes were expressed exclusively in only one of the two parental inbred lines, whereas these genes were expressed in both reciprocal hybrids. This pattern, which is an extreme instance of complementation at the gene expression level, was termed single-parent expression (SPE; Paschold et al., 2012, 2014). As a consequence of SPE, hybrids display hundreds of more active genes than each of their parents.
In global agriculture, drought leads to more yield loss in crops such as maize than any other stress (Boyer, 1982). Global warming alters precipitation patterns, and the anticipated world population of nine billion by 2050 requires an estimated increase in crop production by 70% (Tester and Langridge, 2010). Water shortage severely influences many physiological and developmental aspects of plants (for review, see de Oliveira et al., 2013). For instance, continuous primary root elongation at low water potentials is an important adaptive trait in maize to access deeper water layers (Sharp et al., 1988). In rice (Oryza sativa), the recently characterized protein DEEPER ROOTING1 leads to enhanced downward directed root growth and avoidance of drought stress (Uga et al., 2013). The maintenance of root growth is mediated by the plant hormone abscisic acid. Abscisic acid prevents excessive ethylene production and growth inhibition by promoting the transport of Pro to the root apex (for review, see Yamaguchi and Sharp, 2010). Pro contributes to osmotic adjustment by protecting cellular turgor. Consequently, water influx into cells is enabled by a more negative water potential compared with the outside medium (for review, see Yamaguchi and Sharp, 2010). In contrast to these physiological processes, little is known about the metabolic and molecular networks involved in drought adjustment (Spollen et al., 2008; Krasensky and Jonak, 2012). Drought stress occurring in drying soil can be simulated by polyethylene glycol (PEG) treatment of plants (Zheng et al., 2004; Opitz et al., 2014, 2016). Simulation of moderate, naturally occurring drought conditions is of great agronomic importance, as such drought conditions are frequent and reduce yield (Sinclair, 2011; O’Geen, 2012). It was hypothesized that maize hybrids are better adapted to environmental stresses such as drought than their parental inbred lines, possibly as a result of improved water use efficiency (Araus et al., 2010).
To understand the differences in their transcriptomic response to drought, we subjected young primary roots of the maize hybrids B73xMo17 and Mo17xB73 and their parental inbred lines B73 and Mo17 to global gene expression experiments by RNA sequencing (RNA-seq). Our experiments revealed robust SPE patterns, which were significantly less susceptible to water deficit treatment than other genotype-specific gene activity patterns.
RESULTS
The Influence of Genotype and Water Deficit Treatment on Differential Gene Expression in Primary Root Transcriptomes of Maize Inbred Lines and Their Hybrid Progeny
The transcriptomic landscape of maize primary roots grown under control or water deficit conditions simulated by PEG treatment was determined in the inbred lines B73 and Mo17 and their reciprocal hybrid progeny B73xMo17 and Mo17xB73 by RNA-seq. Each genotype-by-treatment combination was surveyed in four biological replicates. After quality control and stacked read removal (see “Materials and Methods”), on average, 14 million reads of the 32 cDNA libraries (67%) mapped uniquely to the maize reference genome (Supplemental Table S1). On average, 77% of these sequences mapped to the 39,656 high-confidence gene models of the maize filtered gene set (FGSv2; Supplemental Table S1).
The relationship of the 32 sequenced transcriptomes is summarized in a multidimensional scaling (MDS) plot indicating the overall relationship of the different RNA-seq samples (Fig. 1A). Samples representing control and water deficit conditions for each of the four genotypes clustered closely together, illustrating their high transcriptomic correlation. The similarity between the reciprocal hybrids B73xMo17 and Mo17xB73, which contain identical nuclear genomes, was much higher than that between their parental inbred lines B73 and Mo17.
Figure 1.

Sample relationship and differential gene expression. A, MDS plot illustrating the level of similarity of the transcriptomes of the four genotypes after control and water deficit treatments. B, Four-way Venn diagram of the number and distribution of genes differentially expressed between control water deficit conditions and overlap of these genes between the different genotypes. The four genotypes are color coded as indicated by the color of the genotype labels. To facilitate interpretation, the eight boxes per genotype are encircled by the corresponding genotype color. Hence, the central field, which represents the intersection of all four genotypes, comprises genes consistently up- or down-regulated by drought stress in all four genotypes. False discovery rate (FDR) ≤ 5%, log2 fold change > 1; top number, up-regulated under water deficit; bottom number, down-regulated under water deficit. C, Number of differentially expressed genes (DEGs; FDR ≤ 5%, log2 fold change > 1) between individual genotypes after control and water deficit conditions (percentages indicate overlapping DEGs). B, B73; BM, B73xMo17; M, Mo17; MB, Mo17xB73.
In the four genotypes, between 229 (140 up + 89 down; Mo17) and 902 (582 up + 320 down; B73xMo17) genes were regulated by water deficit stress (Fig. 1B). Between 61% (Mo17) and 67% (Mo17xB73) of these genes were up-regulated upon water deficit treatment (top numbers below each genotype), while the remaining genes were down-regulated upon drought stress (bottom numbers below each genotype). Remarkably, a substantial number of drought-regulated genes displayed genotype-specific regulation. In particular, between 46% (Mo17xB73) and 59% (B73xMo17) of genes regulated in the reciprocal hybrids were only regulated in hybrids but not in their parental inbred lines (Fig. 1B, red numbers).
The number of differentially expressed genes between the four genotypes was determined in six pairwise comparisons that were performed for control and water deficit-treated samples separately (Fig. 1C). The highest number of differentially expressed genes for both treatments was observed between the genetically distinct parental inbred lines B73 and Mo17, and the lowest number was detected between the reciprocal hybrids B73xMo17 and Mo17xB73 (Fig. 1C). In all six comparisons, differential gene expression patterns were highly conserved up to 86% (B73 versus Mo17) irrespective of the treatment (Fig. 1C, light colors on the base of the bars). Nevertheless, hundreds of genes were differentially expressed only under control conditions and stable under water deficit stress or vice versa.
Nonadditive Gene Expression Is Often Conserved between Reciprocal Hybrids
To determine gene expression patterns in hybrids relative to their parents, nine expression categories were defined (Table I). These expression classes were based on three pairwise Student’s t tests to estimate genes differentially expressed between the hybrid and the lower (low-parent) and higher (high-parent) expressing inbred lines. According to this classification scheme, most genes were assigned to classes 1 to 4, in which hybrid expression is between the parental inbred lines. Nevertheless, hundreds of genes displayed extreme expression levels in hybrids above the high parent (classes 5 and 6) or below the low parent (classes 7 and 8). The majority of these genes (4,469) displayed below low-parent expression, whereas 1,968 genes revealed above high-parent expression in the reciprocal hybrids under control and water deficit conditions. The remaining genes, which were not covered by the criteria defined for classes 1 to 8, were summarized in class 9. Within the nine expression classes, a subset of genes exhibited nonadditive gene expression (i.e. expression levels in a hybrid that were significantly different from the average of the parental values [midparent value]). In summary, in the hybrid B73xMo17, 17% (4,549) of genes under control and 38% (10,144) of genes under water deficit conditions displayed nonadditive expression. Similarly, in the hybrid Mo17xB73, 27% (7,185) of genes were significantly different from the midparent value under control conditions, whereas 35% (9,230) of genes displayed nonadditive expression under water deficit. The overlap of 2,192 (48%; expected 317) nonadditively expressed genes in the hybrid B73xMo17 under both conditions and 3,344 (47%; expected 490) in Mo17xB73 significantly exceeded the expected numbers by 7-fold in both genotypes (P ≤ 0.01; Table I), suggesting a biological relevance of these patterns.
Table I. Determination of nonadditive expression classes in reciprocal maize hybrids under control and water deficit conditions.
| Classa | Expression Pattern | Criteria |
Total No. of Genes |
No. of Nonadditive Genesb |
||||||||||||||||
|---|---|---|---|---|---|---|---|---|---|---|---|---|---|---|---|---|---|---|---|---|
| LP ≠ H | HP ≠ H | LP ≠ HP | B73xMo17 |
Overlapc |
Mo17xB73 |
Overlapc |
B73xMo17 |
Overlapc |
Mo17xB73 |
Overlapc |
||||||||||
| C | WD | E | O | C | WD | E | O | C | WD | E | O | C | WD | E | O | |||||
| 1 | LP < H < HP | Y | Y | Y | 3,783 | 3,109 | 440 | 2,398* | 3,325 | 3,187 | 396 | 2,351* | 1,179 | 1,196 | 53 | 829* | 1,154 | 1,119 | 48 | 832* |
| 2 | LP = H < HP | Y | Y | Y | 3,175 | 3,751 | 445 | 1,519* | 4,400 | 3,724 | 613 | 2,110* | 581 | 1,475 | 32 | 209* | 1,556 | 1,273 | 74 | 508* |
| 3 | LP < H = HP | Y | N | Y | 5,845 | 5,599 | 1,224 | 3,179* | 5,856 | 5,276 | 1,156 | 3,468* | 1,437 | 3,180 | 171 | 754* | 3,254 | 2,207 | 269 | 1,309* |
| 4 | LP = HP = H | N | N | N | 8,559 | 7,224 | 2,313 | 4,821* | 6,960 | 8,555 | 2,227 | 4,839* | 3 | 84 | 0 | 0 | 55 | 44 | 0 | 0 |
| 5 | LP < HP < H | Y | Y | Y | 47 | 267 | 0 | 9* | 148 | 65 | 0 | 17* | 47 | 267 | 0 | 9* | 148 | 65 | 0 | 17* |
| 6 | LP = HP < H | Y | Y | N | 199 | 641 | 5 | 81* | 342 | 259 | 3 | 92* | 199 | 641 | 5 | 81* | 342 | 259 | 3 | 92* |
| 7 | H < LP < HP | Y | Y | Y | 134 | 343 | 2 | 49* | 260 | 265 | 3 | 72* | 134 | 343 | 2 | 49* | 260 | 265 | 3 | 72* |
| 8 | H < LP = HP | Y | Y | N | 430 | 1,202 | 19 | 189* | 1,022 | 813 | 31 | 322* | 430 | 1,202 | 19 | 189* | 1,022 | 813 | 31 | 322* |
| 9 | Ambiguous | 4,565 | 4,601 | 786 | 1,158* | 4,424 | 4,593 | 760 | 1,225* | 539 | 1,756 | 35 | 72* | 1,439 | 1,140 | 61 | 192* | |||
| Total | 26,737 | 26,737 | 5,234 | 13,403* | 26,737 | 26,737 | 5,189 | 14,496* | 4,549 | 10,144 | 317 | 2,192* | 9,230 | 7,185 | 490 | 3,344* | ||||
The classification of the relative expression of hybrids (H) compared to their parental inbred lines (HP, high parent; LP, low parent) is based on the three pairwise tests listed in the Criteria columns (N, no; Y, yes). bNonadditively expressed genes were determined relative to their midparent value. cExpected (E) values were calculated as (number of nonadditive genes in B73×Mo17 × number of nonadditive genes in Mo17×B73)/number of all expressed genes. The number of all expressed genes is the sum of classes 1 to 9. C, Control; O, observed; WD, water deficit. The numbers of expected and observed overlapping genes were compared using a χ2 test. Significant values are indicated by asterisks: P ≤ 0.01.
Treatment-Dependent Overlap of Genes Exhibiting Allelic Expression Ratios in Hybrids Different from Their Parental Ratio
For genes expressed in all four genotypes (see “Materials and Methods”), the expression ratio of the two parental alleles for each gene was determined in control and water deficit-treated hybrids and compared with the allelic expression ratio of the two parental alleles in the inbred lines. In total, between 491 (B73xMo17 control) and 563 (B73xMo17 water deficit) genes displayed allelic ratios in hybrids significantly different from the expression ratio of the parental inbred lines (Fig. 2). Genes of the reciprocal hybrids displaying allelic expression different from their parental ratio in a defined treatment significantly overlapped and exceeded the expected values by 13-fold (water deficit; 437:32) to 15-fold (control; 418:27; Supplemental Table S2). Similarly, the number of genes with allelic ratios different from their parental values significantly exceeded the parental ratios by 6-fold (Mo17xB73; 188:29) to 7-fold (B73xMo17; 177:27) when comparing the same hybrids at different treatments. Between 25% (125; B73Mo17 control) and 60% (324; Mo17xB73 water deficit) of the genes, which displayed allelic ratios in hybrids different from the allelic ratios of their parental inbred lines, also showed nonadditive gene expression (Supplemental Table S2). Again, the observed overlap of nonadditively expressed genes between the reciprocal hybrids under the same condition and the same hybrids under water deficit versus control conditions significantly exceeded the expected values by 20- to 23-fold (163:8 and 93:4) and 11- to 13-fold (89:8 and 52:4), respectively.
Figure 2.

Distribution of genes exhibiting allelic expression ratios in hybrids different from their parental ratios under control and water deficit conditions.
The genes displaying allelic ratios in hybrids deviating from the allelic ratios of the parental inbred lines were compared between the reciprocal hybrids and both treatments. The results are summarized in a four-way Venn diagram (Fig. 2). This comparison indicated that 23% and 25% of the genes showing allelic ratios different from their parental lines were conserved in the two reciprocal hybrids after control and water deficit treatment, respectively. In contrast, only 0.5% and 0.6% of such genes overlapped exclusively between the same hybrids under different conditions, indicating a strong treatment effect rather than a reciprocal effect.
Determination of the Activity Status of Genes
An extreme instance of differential gene expression is activity versus inactivity of a gene in different genotype-by-treatment combinations. The activity status (active/inactive) of individual genes between genotypes and treatments was determined by a generalized linear mixed model (see “Materials and Methods”). Water deficit treatment (bottom numbers under the genotypes) resulted in 53 (B73xMo17, 25,620 to 25,567) to 148 (B73, 24,803 to 24,655) more active genes in all four genotypes compared with control conditions (Fig. 3A). The vast majority (85%) of active genes were expressed in all four genotypes (B73, Mo17, B73xMo17, and Mo17xB73) under control (Fig. 3A, top numbers) or water deficit (Fig. 3A, bottom numbers) conditions. Among the genes not active in all genotypes, the majority displayed SPE (red numbers). SPE is an extreme instance of complementation in which genes are only active in one of the two parental inbred lines but in both reciprocal hybrid progeny. Under control conditions, 853 SPE_B genes active in B73 and both reciprocal hybrids but not in Mo17 and 1,144 SPE_M genes transcribed only in Mo17 and both hybrids but not in B73 were detected (Fig. 3A, top red numbers). In primary roots subjected to water deficit stress, 841 SPE_B and 1,183 SPE_M genes were identified (Fig. 3A, bottom red numbers). Among the 853 genes displaying SPE_B under control treatment, 643 (75%) genes also displayed SPE under water deficit conditions (Fig. 3A). Only a small fraction of 2.5% to 15% of 1,051 SPE_B patterns (see Venn diagram in Fig. 3A) are conditioned by genomic PAV (i.e. lack of these genes in the Mo17 genome; Supplemental Table S4). Similarly, among the 1,144 genes showing SPE_M under control conditions, 857 (75%) displayed the SPE pattern under water deficit stress as well. A detailed list indicating the genotype-specific activity status of each of the 29,986 genes active in at least one genotype is provided in Supplemental Data Set S1.
Figure 3.

Distribution of SPE genes under control and water deficit conditions. A, Four-way Venn diagram summarizing gene activity (on/off) patterns in primary roots of the different genotypes and their overlap, after control (top numbers) and water deficit (bottom numbers) treatments. Genotype-specific color coding is as in Figure 1B. SPE genes are indicated in red. Overlap of SPE_M (expression in Mo17 and both hybrids) and SPE_B (expression in B73 and both hybrids) genes among control and water deficit-treated samples is shown in additional two-way Venn diagrams below the four-way Venn diagram. B, Ratio of stable genes (identical genotype-specific expression under control and water deficit treatments) to dynamic genes (variable genotype-specific expression pattern in control versus water deficit conditions). The binary code on the x axis explains the activity status of the four genotypes in the order B73-Mo17-B73xMo17-Mo17xB73. 0, Inactive; 1, active. Lowercase letters a and b illustrate significant differences to the ratios of all other genotype-specific gene expression profiles, according to an Edwards-Berry test at a family-wise type I error rate of α = 5% (Piepho, 2012).
SPE Patterns Are Less Susceptible to Alterations by Water Deficit Than Other Genotype-Specific Expression Profiles
The stability of genotype-specific activity patterns upon water deficit treatment is reported in Supplemental Table S3. The diagonal green line highlights stable activity patterns unaltered under changing water availability (Supplemental Table S3), while the yellow fields indicate patterns that display different genotype-specific activity patterns upon water deficit. Subsequently, for each of the genotype-specific activity patterns, the ratio of stable (green) expression patterns versus dynamic (yellow) expression patterns was determined (Fig. 3B). As an example, in Supplemental Table S3, the dynamic expression patterns for the SPE genes are highlighted by a green frame while the stable expression patterns are highlighted by a dark green background. Significantly, among all genotype-specific expression patterns, only SPE patterns were highly stable under changing water availability (Fig. 3B). While, on average, 75% of all SPE patterns were unaltered in response to PEG treatment, only 17% of the remaining genotype-specific expression patterns were not affected by water deficit. This highlights the superior robustness of SPE patterns compared with other genotype-specific expression patterns.
Nonsyntenic Genes Are Highly Overrepresented, While Classical Maize Genes Are Significantly Underrepresented among SPE Genes
To survey the evolutionary origin of SPE genes, the frequency of syntenic and nonsyntenic genes was determined. Syntenic genes are defined by their preserved colocalization on chromosomes of different species. In maize, these genes emerged after the last whole-genome duplication of a maize progenitor and display synteny to the unduplicated genome of sorghum, a close but unduplicated relative of maize. In contrast, genes that evolved after this whole-genome duplication are nonsyntenic to sorghum genes. Among the 39,656 genes of the FGSv2, 51% (20,291 of 39,656) were declared nonsyntenic (Schnable et al., 2011; Fig. 4A). In total, 38% (10,382 of 27,274) of all expressed genes, 39% (10,427 of 26,866) of the genes expressed under control conditions, and 40% (10,843 of 26,974) of the genes expressed after water deficit treatment were nonsyntenic. The relative number of expressed nonsyntenic genes under both conditions (39% and 40%) was significantly lower than the relative frequency of all nonsyntenic genes of FGSv2 (51%), suggesting that nonsyntenic genes are expressed less frequently in roots than expected by their abundance in the genome. By contrast, 74% (1,470 of 1,997) and 75% (1,511 of 2,024) of the SPE genes identified in control and water deficit-treated roots were nonsyntenic (Fig. 4A). This suggests that most of the SPE genes are evolutionarily younger and without synteny to sorghum genes. Moreover, 78% (1,170 of 1,500) of all stable SPE genes and 59% (604 of 1,016) of dynamic SPE genes were nonsyntenic.
Figure 4.

Distribution of nonsyntenic genes (A) and classical maize genes (B) among all expressed genes and genes displaying SPE. Significant differences (α ≤ 5%) compared with expressed genes are indicated: **, P ≤ 0.001. C, Control; WD, water deficit stress.
In maize, a set of 3,946 hand-curated classical genes with experimentally determined functions has been defined (Schaeffer et al., 2011; Schnable and Freeling, 2011). Among the genes of the FGSv2, 10% (3,927 of 39,656) are classical maize genes. Similar proportions were observed among all genes expressed in control (11%; 3,008 of 26,866) and water deficit (11%; 3,037 of 26,974; Fig. 4B) conditions. In contrast, significantly fewer classical maize genes were identified among SPE genes observed under control (6%; 126 of 1,997) and drought stress (6%; 120 of 2,024) conditions. A similar number of classical maize genes was detected among the stable SPE genes (5%; 76 of 1,500), whereas 9% (93 of 1,016) of the dynamic SPE genes were assigned to classical genes. These findings underline the predominant classification of stable SPE genes to the set of nonsyntenic genes, representing classical genes to a lesser extent than syntenic genes.
DISCUSSION
Maize displays an exceptional degree of intraspecific genome diversity compared with other higher eukaryotes (Springer et al., 2009; Swanson-Wagner et al., 2010; Marroni et al., 2014). High-throughput sequencing technologies such as RNA-seq allow monitoring how this genotype-specific genomic diversity is reflected by the transcriptomic landscape of maize (Hansey et al., 2012; Hirsch et al., 2014). In this study, RNA-seq was applied to compare the primary root transcriptomes of B73, Mo17, and their reciprocal hybrids B73xMo17 and Mo17xB73 under control and water deficit conditions. Primary roots were selected as a model because they are the first line of defense against water deficit. Moreover, they display a simple organization, and heterosis is manifested in primary roots within 3 to 4 d after germination (Hoecker et al., 2006). An MDS plot illustrated that transcriptomic differences between genotypes were more pronounced than those between control and water deficit treatments in maize primary roots (Fig. 1A). Similarly, in a previous study, the transcriptomic disparity between four different maize root tissues was larger than the transcriptomic differences of the individual tissues under control and water deficit conditions (Opitz et al., 2016).
The sample relationships in the MDS plot (i.e. smaller distances between treatments than by genotypes) also were reflected by the smaller number of water deficit-regulated genes (Fig. 1B) compared with the large number of differentially expressed genes between the distantly related parental genotypes B73 and Mo17 (Fig. 1C).
In this study, the majority of genes differentially expressed in response to water deficit (Fig. 1B) was up-regulated (61%–67%), suggesting that limited water availability tends to activate gene expression. Previous studies displayed similar trends of preferentially up-regulated genes upon water deficit treatment, with 81% in whole B73 primary roots (Opitz et al., 2014) and between 68% and 88% in four different root tissues (Opitz et al., 2016). A higher number of drought-induced than drought-repressed genes also has been reported for the whole maize root system of the inbred line SRG-200 (Humbert et al., 2013) and maize seedling roots of the inbred line Han21 (Zheng et al., 2004).
Six pairwise comparisons of gene expression levels in the four genotypes revealed a large number of differentially expressed genes between the distantly related parental inbred lines B73 and Mo17 (Lorenz and Hoegemeyer, 2013), which was highly conserved (86%) in control and water deficit treatment (Fig. 1C). In contrast, only a small number of differentially expressed genes were detected between the genetically identical reciprocal hybrids (Fig. 1C). Independent of treatment, comparisons of gene expression in hybrids versus inbred lines, which share 50% genomic identity, revealed intermediate numbers of differentially expressed genes (Fig. 1C). Hence, the degree of genomic difference correlates with differential gene expression (Paschold et al., 2012; Baldauf et al., 2016). Similar genotype-associated trends of differential expression have been reported previously in these four maize genotypes on the transcriptome level (Stupar and Springer, 2006; Paschold et al., 2012; Baldauf et al., 2016) and the proteome level (Marcon et al., 2013). Likewise, in Arabidopsis (Arabidopsis thaliana), the number of differentially expressed genes between three landraces significantly exceeded that of the corresponding reciprocal hybrids (Vuylsteke et al., 2005).
Nonadditively expressed genes display expression values in the hybrid that are significantly different from the average midparent value of the parent (Paschold et al., 2012). Such genes have been suggested to be associated with heterosis (Swanson-Wagner et al., 2006; Hoecker et al., 2008). In this study, thousands of genes displayed nonadditive expression under control (9,230) and water deficit (7,185) treatment. Notably, the overlap of nonadditively expressed genes between the two treatments (47%) by far exceeded the expected values (Table I). This implies that a major proportion of nonadditively expressed genes in hybrids is robust against water deficit stress and, therefore, might be of relevance for the early developmental manifestation of heterosis.
Allelic gene expression ratios in the hybrids deviating from the expression ratio of the corresponding parental alleles in the inbred lines were determined in this study (Fig. 2). In total, 614 and 676 genes (Supplemental Table S2) under control and water deficit conditions were identified for which the expression ratio of the parental inbred lines was different from that of the reciprocal hybrids. In whole maize primary roots (Paschold et al., 2012) and root tissues (Baldauf et al., 2016), 840 and 739 genes, respectively, were reported that show allelic expression ratios in hybrids deviating from the expression ratios of the parental alleles in the inbred lines. In a pioneering study for a set of 15 maize genes, allelic expression variation was observed in response to drought stress, indicating an unequal function of the parental alleles in hybrids (Guo et al., 2004). Such expression patterns could, at least in part, be the result of epigenetic regulation and be associated with heterosis. In Arabidopsis hybrids, it was shown that reduced levels of 24-nucleotide small RNAs in comparison with the parental inbred lines change the epigenetic landscape of hybrids, leading to the formation of heterotic phenotypes (Groszmann et al., 2011).
In a qualitative analysis of gene expression, transcriptionally active and inactive genes were determined for each genotype/treatment combination by a generalized linear mixed model approach. In this study, 27,274 genes were declared active in at least one genotype/treatment combination (Supplemental Data Set S1). Similar numbers of 27,438 active genes were detected in root tissues of B73 (Opitz et al., 2016) and 27,347 genes in maize seedling root tissues of the same genotypes as used in this study (Paschold et al., 2014). SPE patterns denote gene expression in only one parental inbred line but in both reciprocal hybrids (Paschold et al., 2012). For SPE_B patterns (i.e. for genes active only in B73 but not in Mo17), it has been determined that only 2.5% to 15% of these patterns are conditioned by PAV (i.e. the lack of these genes in the Mo17 genome; Supplemental Table S4). This is in line with previous observations where 18% of SPE_B genes in roots were considered PAVs (Paschold et al., 2012). On the level of gene expression, SPE represents a special instance of complementation, which results in several hundred more active genes in hybrids (Fig. 3A). In previous analyses, we also observed hundreds of more genes active in primary roots (Paschold et al., 2012) and in distinct primary root tissues (Paschold et al., 2014) of hybrids. It has been discussed that the activity of additional genes might be advantageous for hybrid plants (Paschold et al., 2012, 2014), because SPE genes encode rather redundant functions that could help to make biological processes more robust against unfavorable changes of environmental conditions (Paschold et al., 2014). This is substantiated by our finding here that, among all genotype- and treatment-specific expression profiles, SPE genes were exceptionally robust against changing water availability (Fig. 3B; Supplemental Table S3; i.e. that these expression patterns are not susceptible to alterations by water deficit conditions).
A whole-genome duplication ∼5 to 12 million years ago (Blanc and Wolfe, 2004; Swigonová et al., 2004) separated maize from its close relative sorghum (Paterson et al., 2009). In modern maize, genes with synteny to sorghum resulted from this polyploidization event, while nonsyntenic genes evolved after this last whole-genome duplication (Woodhouse et al., 2010; Schnable et al., 2011), such as by transposition of existing genes (Freeling et al., 2008), by modular rearrangement of protein-encoding domains (Kersting et al., 2012), or by exon shuffling from transposons resulting in fusion genes (Barbaglia et al., 2012). In total, 51% of all maize genes are nonsyntenic (Fig. 4A). Among all genes expressed under control or water deficit conditions, ∼40% were nonsyntenic (Fig. 4A). Thus, nonsyntenic genes were less frequently expressed compared with their genomic proportion. Similar observations were made in primary root tissues, in which only 36% of all expressed genes were of nonsyntenic descent (Paschold et al., 2014). However, nonsyntenic genes were significantly overrepresented among SPE genes (Fig. 4A) and made up 74% and 75% under control and water deficit conditions, respectively. A similar overrepresentation of SPE patterns also has been observed in a transcriptome study of root tissues (Paschold et al., 2014). An even higher proportion of genes with stable SPE expression patterns under control and water deficit conditions were nonsyntenic (78%) compared with SPE genes displaying treatment-dependent expression changes (59%). The overrepresentation and stability of nonsyntenic SPE genes might be an adaptation to cope with selective fluctuating environments such as water deficit.
As expected, classical maize genes, among which syntenic genes are enriched (Schnable and Freeling, 2011; Paschold et al., 2014), were significantly underrepresented among SPE genes in this study (Fig. 4B).
CONCLUSION
In summary, hundreds of nonadditive, allelic, and SPE patterns were observed under control and water deficit conditions in maize primary roots of the inbred lines B73 and Mo17 and their hybrid progeny. The majority of SPE genes were nonsyntenic and stable throughout changing water availability, suggesting a role of these SPE patterns in the developmental manifestation of heterosis in maize under fluctuating environmental conditions.
MATERIALS AND METHODS
Plant Material and Growth Conditions
Seeds of the inbred maize (Zea mays) lines B73 and Mo17 and the two reciprocal hybrids B73xMo17 and Mo17xB73 were germinated in paper rolls in distilled water as described previously (Hoecker et al., 2006). Four to 5 d after germination in a 16-h-light (28°C) and 8-h-dark (21°C) regime, seedlings with a primary root length of 2 to 4 cm were transferred to new paper rolls and incubated in a PEG solution (PEG8000; Mr of 7,300–9,000; Roth) with a water potential of −0.8 MPa or in distilled water as a control. The water potential of the PEG8000 solution was determined as described previously (Opitz et al., 2014). The seedlings were incubated in aerated PEG solution or distilled water for 6 h. Subsequently, per biological replicate, 10 primary roots were harvested, immediately frozen in liquid nitrogen, and stored at −80°C until RNA isolation. Four biological replicates per control and PEG treatment were analyzed for each of the 32 samples.
RNA Isolation and Sequencing Library Construction
RNA was isolated from pools of primary roots pulverized in liquid nitrogen according to an established protocol (Winz and Baldwin, 2001). RNA quality was determined by agarose gel electrophoresis and by a Bioanalyzer using an Agilent RNA 6000 Nano Chip (Agilent Technologies). All RNA samples were of excellent quality with RNA integrity number (Schroeder et al., 2006) values of 9.1 or greater. cDNA libraries for Illumina sequencing were constructed according to the protocol of the manufacturer (TruSeq RNA Sample Preparation; Illumina). For sequencing, four libraries were pooled in one lane of a flow cell. One of the adapters AR001, AR008, AR010, or AR011 (Supplemental Table S1) indexed each library per lane. The indexed libraries were loaded onto a flow cell according to a split-plot design (https://www.vsni.co.uk/software/cycdesign/) assigning conditions (water deficit stress versus control) to lanes (main plots), with two adjacent lanes forming a complete block and assignments of genotypes to lanes regarded as subplots. Cluster preparation and single-read sequencing (100 bp) were performed according to the manufacturer’s instructions (HiSeq 2000; Illumina).
Analysis of Sequencing Data and Read Mapping
Raw sequencing reads generated by the Illumina HiSeq 2000 system were processed and quality trimmed with SHORE (http://1001genomes.org/software/shore.html). Reads with more than two or five bases having quality scores of 3 or less in the first 12 or 25 bases, respectively, were rejected. Bases with quality scores of 5 or less at the 3′ end were trimmed until two succeeding bases had higher quality scores. Reads with two or more mismatches in adapter sequences were excluded. Only reads of 40 bp or greater were retained for subsequent analyses. Finally, adapter sequences were removed. Resulting reads had a length of 40 to 100 bp (60% or greater of all reads were 100 bp long) and quality scores of 26 or higher at all base positions.
Read mapping was performed with CLC Genomics Workbench (version 7.0; http://www.clcbio.com/products/clc-genomics-workbench/). All high-quality reads were mapped to the maize B73 reference genome sequence version 2 (RefGen_v2; http://ftp.maizesequence.org/current/; Schnable et al., 2009), allowing gaps of up to 50 kb to span introns. At least 75% of each read had to fit with 90% identity to the reference sequence to be included in the mapping. Stacked reads (i.e. redundant reads sharing the same start and end coordinates), sequencing direction, and sequence were merged into one. The remaining reads were projected to the filtered gene set (FGSv2; http://ftp.maizesequence.org/current/; release 5b.60) of the B73 reference genome, allowing a maximum of two mismatches for reads of 56 bp or less. Longer reads had to fit at least with 80% of their length and an identity of 90% or greater. Only those reads uniquely mapping to the reference data set were subsequently used for analyses.
An MDS plot was produced by the Bioconductor package limma (Smyth, 2005) in R (version 3.1.1 2014-07-10) using normalized expression values on the log2 scale, resulting from the function voom. The MDS plot illustrates and compares sample relationships.
Statistical Procedure to Determine Gene Activity or Inactivity
After excluding genes with an average of less than one read per replicate of each genotype-by-treatment combination, 29,986 genes remained for analysis (Supplemental Data Set S1). As described by Opitz et al. (2016), a generalized linear mixed model with a negative binomial response was used to model gene-wise read counts. The negative binomial dispersion parameter was assumed to be constant within each gene. Using a log link function, the linear predictor was taken to be the sum of a normalization factor, a linear function of random effects that account for experimental design, and a linear function of fixed effects specific to each combination of genotype and condition. Each normalization factor was calculated by adding the log of the trimmed mean of M values normalization factor (Robinson and Oshlack, 2010) for each sample to a term accounting for gene length. The data were considered as coming from a split-plot design. The whole-plot part is organized as a randomized complete block design with four blocks, with the sequencing lane acting as the whole-plot experimental unit and condition as the whole-plot factor. Finally, the genotype is the split-plot factor and the unique Illumina adapter used for multiplexing is an additional blocking factor. The principles of a Latin square were used to match each adapter with a genotype within each block. Correspondingly, the vector of random effects for each gene consists of a random effect for each lane, a random effect for each block, and a random effect for each adapter. The log of the negative binomial dispersion parameter and vectors of fixed and random effects combine to form a vector that was assumed to have a multivariate Gaussian distribution. Each fixed effect and the log of the negative binomial dispersion were assumed to be independent of other parameters and assigned a normal distribution with unknown mean and variance. The precisions of the random effects were assigned γ-distributions, and the parameters for the effects corresponding to block and adapter were specified to create vague distributions. The unknown hyperparameters in the distributions of the fixed effects, negative binomial dispersion, and precision of the lane effects were estimated using an empirical Bayes procedure via the R package ShrinkBayes (Van De Wiel et al., 2013). Integrated nested Laplace approximation (Rue et al., 2009) was used to approximate Pijk(T), the posterior probability that the linear combination of fixed effects for gene i, genotype j, and condition k was larger than a selected threshold represented by T. Gene i was called active for genotype j and condition k if Pijk(T) > 0.5 and inactive otherwise. Using posterior distributions to classify genes as active or inactive has the advantage of accounting for sequencing differences from sample to sample, accounting for gene length differences, and borrowing information across genes via the empirical Bayes procedure. For these data, the selected threshold T resulted in calling a gene active if the expected number of reads per thousand bases of gene length was three or more for a sample with trimmed mean of M normalization factor equal to 1.
Statistical Procedures for Analyzing Differential Allele-Specific Expression and Differential and Nonadditive Gene Expression
The maize reference genome sequence (RefGen_v2; Schnable et al., 2009) was indexed using Bowtie2 (http://bowtie-bio.sourceforge.net/bowtie2/index.shtml, version 2.2.2), and raw sequence reads were mapped to the RefGen_v2 with TopHat2 (http://ccb.jhu.edu/software/tophat/manual.shtml, version 2.1.0). Transcript assembly and the quantification of aligned reads were performed with Cufflinks (http://cole-trapnell-lab.github.io/cufflinks/, version 2.2.1), and assembled transcripts uniquely projected onto the FGS_v2 (http://ftp.maizesequence.org/current/, release 5b.60) were extracted. For calculation of gene expression levels, the R package cummeRbund (http://compbio.mit.edu/cummeRbund/index.html, version 2.7.2) was used.
Aligned reads in Pileup format were generated from the TopHat2 alignments using samtools (http://samtools.sourceforge.net/, version 0.1.19). To estimate differences in allele-specific expression, a set of 106,335 SNPs identified between the B73 and Mo17 genotypes were extracted as described (Xin et al., 2013). B73-Mo17 SNPs were checked against the TopHat2 alignments using a customized Perl script (http://cropbio.uni-bonn.de). Only SNPs with a coverage of at least five in at least one sample of each parent, B73 and Mo17, that further showed the expected allele in at least 80% of reads in all parental samples with a coverage of at least five, were used for subsequent analysis. SNPs overlapping with the FGSv2 were extracted using bedtools intersect (https://github.com/arq5x/bedtools2/, version 2.19.1). Allele counts per gene were summed across all SNPs within exons with a coverage of at least 10 reads using a customized Perl script (http://cropbio.uni-bonn.de; Supplemental Data Set S2).
To determine the number of genes in hybrids that exhibit allelic ratios deviating from their parental ratios, genes represented by a minimum of five mapped allele-specific reads in all four replicates of at least one genotype/treatment combination were selected. This filtering step was applied separately to the control and PEG-treated samples. The raw allele-specific read counts were RPKM normalized by sequencing depth and log2 transformed to meet the assumptions of linear models. Furthermore, the mean variance relationship within the count data were estimated, and precision weights for each observation were computed using limma in R (version 3.16.7; Law et al., 2014). To test the hypothesis that the allelic expression ratio of the parental alleles in the hybrids is equal to the allelic expression ratio in the parents, this test was performed separately for both reciprocal hybrids and each treatment. The resulting P values were FDR adjusted (Benjamini and Hochberg, 1995).
To identify differential and nonadditive gene expression, genes represented by a minimum of five mapped reads in all four replicates of at least one genotype/treatment combination were selected (Supplemental Data Set S3). An empirical Bayes approach was used in which the mean variance trend for log2 counts was estimated and then a weight was assigned to each observation based on its predicted variance. The weights were then used in the linear modeling process to adjust for heteroscedasticity (Law, 2013). To borrow strength across genes in the estimation of the residual error variance, an empirical Bayes approach (Smyth, 2004) implemented in the Bioconductor package limma in R were used. Applying a moderated t statistic (Smyth, 2004) makes use of all estimated sample variances, which are shrunk to a pooled estimate. Especially in cases where rather few replicates are available, inference is far more stable in comparison with the ordinary t statistic (Smyth, 2004). We fit the linear model
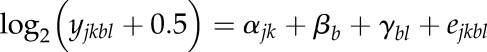 |
for each feature, where yjkbl is the RPKM normalized read count on the RNA level of the jth genotype and kth treatment in the blth lane and bth block, αjk is the fixed effect of the jth genotype for the kth treatment, βb is the fixed effect of the bth block, γbl is the random effect of the lth lane in the bth block, assumed to be independently and identically distributed as N(0,σ2l), and ejkbl is the corresponding residual, assumed to be independently and identically distributed as N(0,σ2). Pairwise contrasts were calculated, and resulting P values of each contrast were corrected for multiplicity using an FDR approach (Benjamini and Yekutieli, 2001). This correction extends the method of Benjamini and Hochberg (1995) by controlling the FDR for general dependency structures.
Accession Numbers
Raw sequencing data are stored at the Sequence Read Archive (http://www.ncbi.nlm.nih.gov/sra) with the accession number SRP058750.
Supplemental Data
The following supplemental materials are available.
Supplemental Table S1. Overview of sample distribution within the flow cell, biological replication, RNA-seq output, and mapping results.
Supplemental Table S2. Genes whose allelic expression levels in hybrids differ from the expected values after control and water deficit treatments.
Supplemental Table S3. Genotype- and treatment-specific activities of expressed genes.
Supplemental Table S4. PAV in SPE genes could explain between 2.5% and 15% of SPE_B expression patterns.
Supplemental Data Set S1. List of active and inactive genes by genotype and treatment.
Supplemental Data Set S2. List of allele counts per gene.
Supplemental Data Set S3. Overview of the number of mapped reads of 26,737 expressed genes, represented by at least five reads per replicate in at least one genotype/treatment combination.
Supplementary Material
Glossary
- PAV
presence/absence variation
- SNPs
single-nucleotide polymorphisms
- SPE
single-parent expression
- PEG
polyethylene glycol
- RNA-seq
RNA sequencing
- MDS
multidimensional scaling
- FDR
false discovery rate
Footnotes
This work was supported by the Deutsche Forschungsgemeinschaft (grant no. HO2249-9/1 to F.H. and grant no. PI 377/12-1 to W.A.M. and H.-P.P.) and by the European Union’s Seventh Framework Programme (FP7/2007-2013; grant no. 289300.27 to F.H.).
Articles can be viewed without a subscription.
References
- Araus JL, Sánchez C, Cabrera-Bosquet L (2010) Is heterosis in maize mediated through better water use? New Phytol 187: 392–406 [DOI] [PubMed] [Google Scholar]
- Baldauf JA, Marcon C, Paschold A, Hochholdinger F (2016) Nonsyntenic genes drive tissue-specific dynamics of differential, nonadditive, and allelic expression patterns in maize hybrids. Plant Physiol 171: 1144–1155 [DOI] [PMC free article] [PubMed] [Google Scholar]
- Barbaglia AM, Klusman KM, Higgins J, Shaw JR, Hannah LC, Lal SK (2012) Gene capture by Helitron transposons reshuffles the transcriptome of maize. Genetics 190: 965–975 [DOI] [PMC free article] [PubMed] [Google Scholar]
- Benjamini Y, Hochberg Y (1995) Controlling the false discovery rate: a practical and powerful approach to multiple testing. J R Stat Soc Ser B Stat Methodol 57: 289–300 [Google Scholar]
- Benjamini Y, Yekutieli D (2001) The control of the false discovery rate in multiple testing under dependency. Ann Stat 29: 1165–1188 [Google Scholar]
- Birchler JA, Auger DL, Riddle NC (2003) In search of the molecular basis of heterosis. Plant Cell 15: 2236–2239 [DOI] [PMC free article] [PubMed] [Google Scholar]
- Blanc G, Wolfe KH (2004) Widespread paleopolyploidy in model plant species inferred from age distributions of duplicate genes. Plant Cell 16: 1667–1678 [DOI] [PMC free article] [PubMed] [Google Scholar]
- Boyer JS. (1982) Plant productivity and environment. Science 218: 443–448 [DOI] [PubMed] [Google Scholar]
- de Oliveira AB, Alencar NLM, Gomes-Filho E (2013) Comparison between the water and salt stress effects on plant growth and development. InTechOpen 4: 67–94 [Google Scholar]
- Falconer DS, Mackay TFC (1996) Introduction to Quantitative Genetics, Ed 4 Longman Harlow, Essex, UK [Google Scholar]
- Freeling M, Lyons E, Pedersen B, Alam M, Ming R, Lisch D (2008) Many or most genes in Arabidopsis transposed after the origin of the order Brassicales. Genome Res 18: 1924–1937 [DOI] [PMC free article] [PubMed] [Google Scholar]
- Groszmann M, Greaves IK, Albertyn ZI, Scofield GN, Peacock WJ, Dennis ES (2011) Changes in 24-nt siRNA levels in Arabidopsis hybrids suggest an epigenetic contribution to hybrid vigor. Proc Natl Acad Sci USA 108: 2617–2622 [DOI] [PMC free article] [PubMed] [Google Scholar]
- Guo M, Rupe MA, Zinselmeier C, Habben J, Bowen BA, Smith OS (2004) Allelic variation of gene expression in maize hybrids. Plant Cell 16: 1707–1716 [DOI] [PMC free article] [PubMed] [Google Scholar]
- Haberer G, Young S, Bharti AK, Gundlach H, Raymond C, Fuks G, Butler E, Wing RA, Rounsley S, Birren B, et al. (2005) Structure and architecture of the maize genome. Plant Physiol 139: 1612–1624 [DOI] [PMC free article] [PubMed] [Google Scholar]
- Hansey CN, Vaillancourt B, Sekhon RS, de Leon N, Kaeppler SM, Buell CR (2012) Maize (Zea mays L.) genome diversity as revealed by RNA-sequencing. PLoS ONE 7: e33071. [DOI] [PMC free article] [PubMed] [Google Scholar]
- Hirsch CN, Foerster JM, Johnson JM, Sekhon RS, Muttoni G, Vaillancourt B, Peñagaricano F, Lindquist E, Pedraza MA, Barry K, et al. (2014) Insights into the maize pan-genome and pan-transcriptome. Plant Cell 26: 121–135 [DOI] [PMC free article] [PubMed] [Google Scholar]
- Hochholdinger F, Hoecker N (2007) Towards the molecular basis of heterosis. Trends Plant Sci 12: 427–432 [DOI] [PubMed] [Google Scholar]
- Hoecker N, Keller B, Muthreich N, Chollet D, Descombes P, Piepho HP, Hochholdinger F (2008) Comparison of maize (Zea mays L.) F1-hybrid and parental inbred line primary root transcriptomes suggests organ-specific patterns of nonadditive gene expression and conserved expression trends. Genetics 179: 1275–1283 [DOI] [PMC free article] [PubMed] [Google Scholar]
- Hoecker N, Keller B, Piepho HP, Hochholdinger F (2006) Manifestation of heterosis during early maize (Zea mays L.) root development. Theor Appl Genet 112: 421–429 [DOI] [PubMed] [Google Scholar]
- Humbert S, Subedi S, Cohn J, Zeng B, Bi YM, Chen X, Zhu T, McNicholas PD, Rothstein SJ (2013) Genome-wide expression profiling of maize in response to individual and combined water and nitrogen stresses. BMC Genomics 14: 3. [DOI] [PMC free article] [PubMed] [Google Scholar]
- Kato A, Lamb JC, Birchler JA (2004) Chromosome painting using repetitive DNA sequences as probes for somatic chromosome identification in maize. Proc Natl Acad Sci USA 101: 13554–13559 [DOI] [PMC free article] [PubMed] [Google Scholar]
- Kersting AR, Bornberg-Bauer E, Moore AD, Grath S (2012) Dynamics and adaptive benefits of protein domain emergence and arrangements during plant genome evolution. Genome Biol Evol 4: 316–329 [DOI] [PMC free article] [PubMed] [Google Scholar]
- Krasensky J, Jonak C (2012) Drought, salt, and temperature stress-induced metabolic rearrangements and regulatory networks. J Exp Bot 63: 1593–1608 [DOI] [PMC free article] [PubMed] [Google Scholar]
- Laurie DA, Bennett MD (1985) Nuclear-DNA content in the genera Zea and Sorghum: intergenetic, interspecific and intraspecific variation. Heredity 55: 307–313 [Google Scholar]
- Law C. (2013) Precision weights for gene expression analysis. PhD thesis. University of Melbourne, Melbourne, Australia [Google Scholar]
- Law CW, Chen Y, Shi W, Smyth GK (2014) voom: precision weights unlock linear model analysis tools for RNA-seq read counts. Genome Biol 15: R29. [DOI] [PMC free article] [PubMed] [Google Scholar]
- Lorenz A, Hoegemeyer T (2013) The phylogenetic relationships of US maize germplasm. Nat Genet 45: 844–845 [DOI] [PubMed] [Google Scholar]
- Marcon C, Lamkemeyer T, Malik WA, Ungrue D, Piepho HP, Hochholdinger F (2013) Heterosis-associated proteome analyses of maize (Zea mays L.) seminal roots by quantitative label-free LC-MS. J Proteomics 93: 295–302 [DOI] [PubMed] [Google Scholar]
- Marroni F, Pinosio S, Morgante M (2014) Structural variation and genome complexity: is dispensable really dispensable? Curr Opin Plant Biol 18: 31–36 [DOI] [PubMed] [Google Scholar]
- O’Geen A. (2012) Soil water dynamics. Nature Education Knowledge 3: 12 [Google Scholar]
- Opitz N, Marcon C, Paschold A, Malik WA, Lithio A, Brandt R, Piepho HP, Nettleton D, Hochholdinger F (2016) Extensive tissue-specific transcriptomic plasticity in maize primary roots upon water deficit. J Exp Bot 67: 1095–1107 [DOI] [PMC free article] [PubMed] [Google Scholar]
- Opitz N, Paschold A, Marcon C, Malik WA, Lanz C, Piepho HP, Hochholdinger F (2014) Transcriptomic complexity in young maize primary roots in response to low water potentials. BMC Genomics 15: 741. [DOI] [PMC free article] [PubMed] [Google Scholar]
- Paschold A, Jia Y, Marcon C, Lund S, Larson NB, Yeh CT, Ossowski S, Lanz C, Nettleton D, Schnable PS, et al. (2012) Complementation contributes to transcriptome complexity in maize (Zea mays L.) hybrids relative to their inbred parents. Genome Res 22: 2445–2454 [DOI] [PMC free article] [PubMed] [Google Scholar]
- Paschold A, Larson NB, Marcon C, Schnable JC, Yeh CT, Lanz C, Nettleton D, Piepho HP, Schnable PS, Hochholdinger F (2014) Nonsyntenic genes drive highly dynamic complementation of gene expression in maize hybrids. Plant Cell 26: 3939–3948 [DOI] [PMC free article] [PubMed] [Google Scholar]
- Paterson AH, Bowers JE, Bruggmann R, Dubchak I, Grimwood J, Gundlach H, Haberer G, Hellsten U, Mitros T, Poliakov A, et al. (2009) The Sorghum bicolor genome and the diversification of grasses. Nature 457: 551–556 [DOI] [PubMed] [Google Scholar]
- Persson T, Garcia y Garcia A, Paz J, Jones J, Hoogenboom G (2009) Maize ethanol feedstock production and net energy value as affected by climate variability and crop management practices. Agric Syst 100: 11–21 [Google Scholar]
- Piepho HP. (2012) A SAS macro for generating letter displays of pairwise mean comparisons. Communications in Biometry and Crop Science 7: 4–13 [Google Scholar]
- Robinson MD, Oshlack A (2010) A scaling normalization method for differential expression analysis of RNA-seq data. Genome Biol 11: R25. [DOI] [PMC free article] [PubMed] [Google Scholar]
- Rue H, Martino S, Chopin N (2009) Approximate Bayesian inference for latent Gaussian models using integrated nested Laplace approximations. J R Stat Soc Ser B Stat Methodol 71: 319–392 [Google Scholar]
- Schaeffer ML, Harper LC, Gardiner JM, Andorf CM, Campbell DA, Cannon EK, Sen TZ, Lawrence CJ (2011) MaizeGDB: curation and outreach go hand-in-hand. Database (Oxford) 2011: bar022. [DOI] [PMC free article] [PubMed] [Google Scholar]
- Schnable JC, Freeling M (2011) Genes identified by visible mutant phenotypes show increased bias toward one of two subgenomes of maize. PLoS ONE 6: e17855. [DOI] [PMC free article] [PubMed] [Google Scholar]
- Schnable JC, Springer NM, Freeling M (2011) Differentiation of the maize subgenomes by genome dominance and both ancient and ongoing gene loss. Proc Natl Acad Sci USA 108: 4069–4074 [DOI] [PMC free article] [PubMed] [Google Scholar]
- Schnable PS, Ware D, Fulton RS, Stein JC, Wei F, Pasternak S, Liang C, Zhang J, Fulton L, Graves TA, et al. (2009) The B73 maize genome: complexity, diversity, and dynamics. Science 326: 1112–1115 [DOI] [PubMed] [Google Scholar]
- Schroeder A, Mueller O, Stocker S, Salowsky R, Leiber M, Gassmann M, Lightfoot S, Menzel W, Granzow M, Ragg T (2006) The RIN: an RNA integrity number for assigning integrity values to RNA measurements. BMC Mol Biol 7: 3. [DOI] [PMC free article] [PubMed] [Google Scholar]
- Sharp RE, Silk WK, Hsiao TC (1988) Growth of the maize primary root at low water potentials. I. Spatial distribution of expansive growth. Plant Physiol 87: 50–57 [DOI] [PMC free article] [PubMed] [Google Scholar]
- Sinclair TR. (2011) Challenges in breeding for yield increase for drought. Trends Plant Sci 16: 289–293 [DOI] [PubMed] [Google Scholar]
- Smyth GK. (2004) Linear models and empirical Bayes methods for assessing differential expression in microarray experiments. Stat Appl Genet Mol Biol 3: Article3. [DOI] [PubMed] [Google Scholar]
- Smyth GK. (2005) Limma: linear models for microarray data. In Gentleman W, Carey R, Dudoit V, Irizarry S, Huber R, eds, Bioinformatics and Computational Biology Solutions Using R and Bioconductor. Springer, New York, pp 397–420 [Google Scholar]
- Spollen WG, Tao W, Valliyodan B, Chen K, Hejlek LG, Kim JJ, Lenoble ME, Zhu J, Bohnert HJ, Henderson D, et al. (2008) Spatial distribution of transcript changes in the maize primary root elongation zone at low water potential. BMC Plant Biol 8: 32. [DOI] [PMC free article] [PubMed] [Google Scholar]
- Springer NM, Ying K, Fu Y, Ji T, Yeh CT, Jia Y, Wu W, Richmond T, Kitzman J, Rosenbaum H, et al. (2009) Maize inbreds exhibit high levels of copy number variation (CNV) and presence/absence variation (PAV) in genome content. PLoS Genet 5: e1000734. [DOI] [PMC free article] [PubMed] [Google Scholar]
- Stupar RM, Springer NM (2006) Cis-transcriptional variation in maize inbred lines B73 and Mo17 leads to additive expression patterns in the F1 hybrid. Genetics 173: 2199–2210 [DOI] [PMC free article] [PubMed] [Google Scholar]
- Swanson-Wagner RA, Eichten SR, Kumari S, Tiffin P, Stein JC, Ware D, Springer NM (2010) Pervasive gene content variation and copy number variation in maize and its undomesticated progenitor. Genome Res 20: 1689–1699 [DOI] [PMC free article] [PubMed] [Google Scholar]
- Swanson-Wagner RA, Jia Y, DeCook R, Borsuk LA, Nettleton D, Schnable PS (2006) All possible modes of gene action are observed in a global comparison of gene expression in a maize F1 hybrid and its inbred parents. Proc Natl Acad Sci USA 103: 6805–6810 [DOI] [PMC free article] [PubMed] [Google Scholar]
- Swigonová Z, Lai J, Ma J, Ramakrishna W, Llaca V, Bennetzen JL, Messing J (2004) Close split of sorghum and maize genome progenitors. Genome Res 14: 1916–1923 [DOI] [PMC free article] [PubMed] [Google Scholar]
- Tester M, Langridge P (2010) Breeding technologies to increase crop production in a changing world. Science 327: 818–822 [DOI] [PubMed] [Google Scholar]
- Uga Y, Sugimoto K, Ogawa S, Rane J, Ishitani M, Hara N, Kitomi Y, Inukai Y, Ono K, Kanno N, et al. (2013) Control of root system architecture by DEEPER ROOTING 1 increases rice yield under drought conditions. Nat Genet 45: 1097–1102 [DOI] [PubMed] [Google Scholar]
- Van De Wiel MA, Leday GG, Pardo L, Rue H, Van Der Vaart AW, Van Wieringen WN (2013) Bayesian analysis of RNA sequencing data by estimating multiple shrinkage priors. Biostatistics 14: 113–128 [DOI] [PubMed] [Google Scholar]
- Vuylsteke M, van Eeuwijk F, Van Hummelen P, Kuiper M, Zabeau M (2005) Genetic analysis of variation in gene expression in Arabidopsis thaliana. Genetics 171: 1267–1275 [DOI] [PMC free article] [PubMed] [Google Scholar]
- Winz RA, Baldwin IT (2001) Molecular interactions between the specialist herbivore Manduca sexta (Lepidoptera, Sphingidae) and its natural host Nicotiana attenuata. IV. Insect-induced ethylene reduces jasmonate-induced nicotine accumulation by regulating putrescine N-methyltransferase transcripts. Plant Physiol 125: 2189–2202 [DOI] [PMC free article] [PubMed] [Google Scholar]
- Woodhouse MR, Schnable JC, Pedersen BS, Lyons E, Lisch D, Subramaniam S, Freeling M (2010) Following tetraploidy in maize, a short deletion mechanism removed genes preferentially from one of the two homologs. PLoS Biol 8: e1000409. [DOI] [PMC free article] [PubMed] [Google Scholar]
- Xin M, Yang R, Li G, Chen H, Laurie J, Ma C, Wang D, Yao Y, Larkins BA, Sun Q, et al. (2013) Dynamic expression of imprinted genes associates with maternally controlled nutrient allocation during maize endosperm development. Plant Cell 25: 3212–3227 [DOI] [PMC free article] [PubMed] [Google Scholar]
- Yamaguchi M, Sharp RE (2010) Complexity and coordination of root growth at low water potentials: recent advances from transcriptomic and proteomic analyses. Plant Cell Environ 33: 590–603 [DOI] [PubMed] [Google Scholar]
- Zheng J, Zhao J, Tao Y, Wang J, Liu Y, Fu J, Jin Y, Gao P, Zhang J, Bai Y, et al. (2004) Isolation and analysis of water stress induced genes in maize seedlings by subtractive PCR and cDNA macroarray. Plant Mol Biol 55: 807–823 [DOI] [PubMed] [Google Scholar]
Associated Data
This section collects any data citations, data availability statements, or supplementary materials included in this article.