

Abstract
Purpose
To develop a new computer-aided diagnosis (CAD) scheme that computes visually sensitive image features routinely used by radiologists to develop a machine learning classifier and distinguish between the malignant and benign breast masses detected from digital mammograms.
Methods
An image dataset including 301 breast masses was retrospectively selected. From each segmented mass region, we computed image features that mimic five categories of visually sensitive features routinely used by radiologists in reading mammograms. We then selected five optimal features in the five feature categories and applied logistic regression models for classification. A new CAD interface was also designed to show lesion segmentation, computed feature values and classification score.
Results
Areas under ROC curves (AUC) were 0.786±0.026 and 0.758±0.027 when to classify mass regions depicting on two view images, respectively. By fusing classification scores computed from two regions, AUC increased to 0.806±0.025.
Conclusion
This study demonstrated a new approach to develop CAD scheme based on 5 visually sensitive image features. Combining with a “visual aid” interface, CAD results may be much more easily explainable to the observers and increase their confidence to consider CAD generated classification results than using other conventional CAD approaches, which involve many complicated and visually insensitive texture features.
Keywords: Computer-aided diagnosis (CAD), Classification of mammographic masses, Quantification of visually sensitive image features, Quantitative image feature selection in CAD
I. Introduction
Mammography is the most popular imaging modality for population-based breast cancer screening. However, due to the large heterogeneity of the suspicious breast lesions (e.g., soft tissue masses) and random overlapping of the dense fibro-glandular tissues, accurate classification of suspicious breast masses detected on the mammograms is a quite difficult task for radiologists in reading and interpreting screening mammograms. As a result, although the cancer detection yield of screening mammography is typically less than 0.5 to 1%, the recall rates often reach 10% or higher in current clinical practice [1]. Thus, the majority of recalls and/or biopsies are proved to be benign. The higher false-positive recall rates add anxiety with potentially long-term psychosocial consequences and physical harms to many cancer-free women who participate in screening mammography [2]. Hence, improving specificity of breast cancer screening has high clinical impact. For example, since studies have shown that digital breast tomosynthesis (DBT) might help reduce recall rates by 16 to 30% as comparing to digital mammography [3], developing, optimizing and testing new DBT technology has attracted extensive research interest recently [4, 5]. However, adding a new imaging test, such as DBT, may increase radiation dose, screening costs and imaging reading time.
In order to help radiologists improve diagnostic specificity by reducing false-positive recall rates, developing and using computer-aided diagnosis (CAD) schemes is also an approach that has been attracting extensive research interest in the last two decades [6]. The goal of developing CAD based classification schemes is to analyze each suspicious lesion detected by radiologists on the mammograms and compute a likelihood score of the lesion being malignant, which aims to assist radiologists in making more accurate recall decisions. Unlike the commercially available CAD based detection schemes of mammograms, which detect and cue locations of the suspicious lesions on mammograms [7], developing CAD based classification schemes to classify between malignant and benign lesions still faces multiple challenges in both technical development and clinical application. In this article, we only discuss CAD based classification schemes.
Table 1 summarizes several most representative CAD schemes reported in the literature [8-15], which include size of training/testing datasets, lesion segmentation methods, type of the selected image features, machine learning classifiers, and classification performance levels namely, the areas under the receiver operating characteristic (ROC) curves (AUC). From these previously reported results, CAD schemes could yield promising performance of classifying between mammographic masses compared to the high false-positive recall rates in current clinical practice. However, previous studies have shown and discussed that without providing an intelligible reasoning process, radiologists are typically reluctantly to accept any recommendations generated by CAD schemes using a “black-box” type approach in the scheme's decision-making process [16, 17]. In most of the previous CAD schemes, (1) the meaning of the majority of the computed image texture features are unexplainable to the human vision system or the variations of those features are also insensitive to the human eyes, and (2) the working mechanisms of the machine learning classifiers (e.g. artificial neural networks) are very complex and thus the relationship or correlation between the image features and the phenotypes of cancer development is also difficult to be understandable. As a result, no CAD based classification scheme is currently used in clinical practice.
Table 1. Summary of eight previously reported CAD schemes for breast lesion classification.
| Authors | Number of cases | Segmentation method | Image Features | Classifier | AUC |
|---|---|---|---|---|---|
| Mudigonda et al. [8] (2000) | 38 | Manual segmentation | Combination of 2 gradient based features and 7 Gray Level Co-occurrence Matrix (GLCM) based texture features | 7M step-wise discriminant analysis | 0.84 |
| Hadjiiski et al. [9] (1999) | 348 | Rectangular ROI | 520 spatial gray-level dependence (SGLD) and 20 RLS texture features | Hybrid ART2LDA classifier | 0.81 |
| Huo et al. [10] (2000) | 110 | Region growing | 4 features including spiculation, margin sharpness and two density-related measures | Artificial neural network | 0.82 |
| Lim et al. [11] (2004) | 343 | Manual segmentation | 7 features including mean and variance of gray level, skewness, contrast, entropy, homogeny and correlation | Generalized dynamic fuzzy neural network | 0.87 |
| Varela et al. [12] (2006) | 1076 | Dynamic programming | 13 sharpness features, 5 microlobulation features, 54 textures features, 4 interior features and two outer features | Three-layer feed-forward neural network | 0.83 |
| Liu et al. [13] (2010) | 309 | Level-Set algorithm | 28 GLCM based texture features | Support vector machine with a RBF kernel | 0.70 |
| Tan et al. [14] (2014) | 1200 | Region growing | 154 features including shape, fat calcification, texture, spiculation, contrast and isodensity features | Support vector machine with a RBF kernel | 0.81 |
| Midya et al. [15] (2014) | 443 | Manual segmentation | 1512 Multi-resolution ACM and GLCM features | Artificial neural network | 0.86 |
To potentially increase radiologists' confidence in accepting mass classification results made by CAD schemes, we in this study, developed and tested a new CAD concept and scheme that only uses 5 simple but visually sensitive image features, which are routinely evaluated by the radiologists in reading and interpreting mammograms, as well as a simple and explainable linear classifier (i.e. logistic regression). Using this new CAD scheme and the accompanying image display (“visual aid”) tool, the classification logic and decision reasoning can then be better understandable by the human observers. The detailed experimental procedures and study results, along with the discussion, to test our hypothesis are presented in the following sections of this article.
II. Materials and Methods
2.1 A testing image dataset
From the retrospectively collected de-identified full-field digital mammography (FFDM) image data in our laboratory, we assembled a reference dataset for developing and testing a new proposed CAD scheme in this study. The dataset includes FFDM images acquired from 301 women who were recalled by the radiologists during the original image reading and interpretation due to the detection of suspicious soft tissue masses on the mammograms. The biopsy was performed on each suspicious mass and the pathological reports indicated that 152 masses were malignant and the remaining 149 masses were benign. In addition, each lesion involved in this dataset was detectable in both craniocaudal (CC) and mediolateral oblique (MLO) view images. The center locations of all masses were previously marked by the radiologists on the corresponding digital mammograms.
2.2 Overview of CAD scheme
Figure 1 shows the flowchart of developing the proposed CAD scheme. In reading a mammogram, if a suspicious mass region is detected, an observer (a radiologist) clicks the seed point around the center of the lesion in the image display workstation. CAD scheme first applies a modified region-growing based algorithm to segment the mass region from the background. Subsequently, 14 features describing five visually sensitive characteristics of segmented lesions (i.e. size, shape, contrast, homogeneity and spiculation) are calculated and extracted. In CAD development stage, in order to identify an optimal approach to represent each of 5 visually sensitive features, student t-tests are then performed to select one optimal feature computation method in each of the five features groups. Lastly, a logistic regression classifier is trained to fuse the information from the five optimal features and generate a likelihood score indicating the probability of malignancy.
Figure 1.
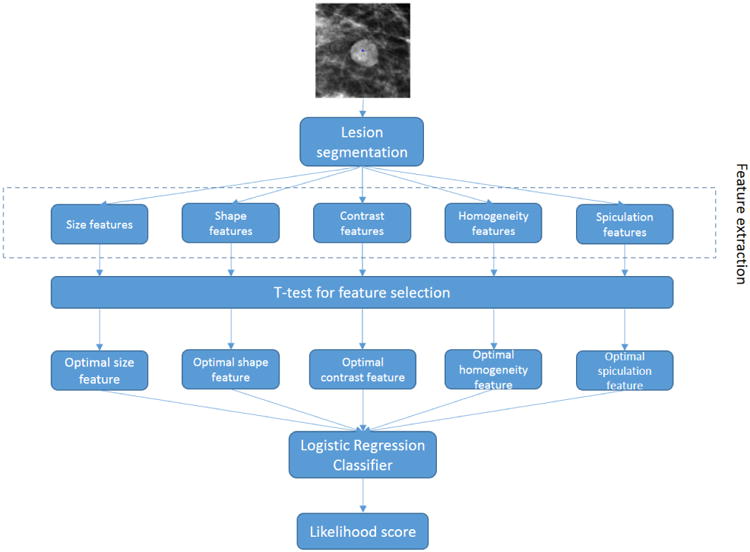
Flowchart of the proposed CAD scheme.
2.3 A lesion segmentation algorithm
The first step of our CAD scheme is to segment the suspicious mass region depicting on the mammogram. By comparing a large number of previously developed algorithms for segmenting breast masses depicting on mammograms [18], we modified a unique region growing technique that was reported in a previous study [19] and develop a new mass segmentation algorithm implemented in our new CAD scheme. Specifically, an initial growth seed was placed at the mass center location (μx, μy), which had been marked by the radiologists. Based on the a priori knowledge that breast masses tend to be compact and convex, a two-dimensional Gaussian function centered at the seed point (μx, μy) with variance σ2 was used to limit the pixels far away from the seed point. A Gaussian-constraint image was generated by the multiplication of the original image and the Gaussian function. Subsequently, a conventional region growing algorithm was applied on the Gaussian-constraint image to define the mass region. The region growing algorithm starts from the initial seed point and grows iteratively according to some similarity criterions. Here we included a parameter t to define the criterion: the candidate pixel is included in the mass region if and only if the pixel value is greater than the following threshold:
| (1) |
Where Ī is the average pixel gray value inside the current segmented mass region and t is the predefined parameter.
The next step is to determine the two parameters (σ and t) involved in the algorithm. σI and tj are denoted as candidate values for σ and t, which are sampled from a predefined range. A two-dimensional grid search method was used to apply every possible pair (σI, tj) in the region growing algorithm to define a segmented mass region, and then compute the cost function of the specific pair. The cost function is defined as:
| (2) |
where circ is the standard deviation of the distances from the boundary pixels to the center pixel, which is used to measure the circularity of the segmented region; grad is the average gradient vector magnitude of the boundary pixels, which is used to measure the sharpness of the segmented boundary; and w is a predefined weighting factor which was determined by subjective evaluation based on our experimental results. The cost function is constructed based on the a priori information that the mass region tends to have a circular shape and a sharp boundary. Finally, the (σI, tj) pair generating the smallest cost function was considered as the parameter to segment the mass region. The segmentation results are not quite sensitive to the selection of weight factor w; simple averaging (i.e. w=1) can get satisfactory results.
This algorithm was first applied to segment each suspicious mass region. Since a previous comprehensive review study [18] has shown that no breast mass segmentation algorithm is perfect or always superior to others, the automated segmentation result of each lesion was visually inspected. Manual correction was applied to adjust parameters used in the region growing algorithm or directly modify part of the mass boundary contour, if significant error was observed, which typically happens in approximately less than 15% of mass regions. Hence, this is an interactive CAD scheme to maintain high accuracy and reliability in computing image features. The similar mass segmentation scheme has been used and successfully tested in an interactive CAD workstation to process and analyze the suspicious mammographic masses queried by radiologists [20].
2.4 Quantitative image feature computation
After mass region segmentation, we investigated and computed a set of image features that are easily caught by (or sensitive to) human eyes and routinely evaluated (or rated) by the radiologists in reading and interpreting mammograms. These features are computed to characterize mass size, shape, contrast, homogeneity and spiculation. Since different image features can be defined to represent each of these mass characteristics, we first computed a number of image features using different definitions or methods in each category. We then analyzed the correlation and compared their discriminatory power to select one optimal feature to represent each of these five mass characteristics. The following are brief descriptions of the computed features.
1. Mass size
We computed 3 image features in this category. The first one is the mass area, which is computed by automatically counting the total number of pixels inside the segmented mass region, and then multiplying the pixel size (or spatial resolution of mammogram). In addition, since in clinical practice, radiologists use the radial length of the lesion to measure mass size (based on RECIST guidelines [21]), we computed the second feature that is the normalized mean radiant length computed by the mean radial length divide by the total number of pixels inside the mass region, and the third feature that is the maximum radial length.
2. Mass shape
Radiologists typically rate mass shape into round, oval, or irregular. To quantify these ratings, we computed two most commonly used shape-related features [22]. The first one is a shape factor ratio defined as P2/A, where P and A are the perimeter and area of a lesion region, respectively. The second one is a radiant length coefficient of variation. Using the radial length (ri) that is the distance between the mass center and pixel (i) located at the mass boundary, this feature is defined as the coefficient of variation of ri, which can be computed by standard deviation of ri divided by mean value of ri.
3. Mass contrast
In order to compute the contrast related features, different types of mass outside surrounding area can be selected, which will have different impact on the computational results [23]. In this study, we used the method reported by te Brake et al [24] to define the mass surrounding area. First, a morphological dilation operation with a spherical kernel of size 0.6R was performed on the segmented mass region, where R is the mean radial length (r̄) of the mass region. Then the pixels inside the dilated region but outside the mass region were labelled as “outside surrounding area.” Figure 2 shows an example of the outside surrounding area that was used to compute the contrast features. Next, three contrast related features were defined and computed. The first one is computed by the difference between the average pixel values inside the segmented mass region and its surrounding (outside) area. The second one is computed based on a distance measure between the two pixel intensity histograms, which can be computed as:
Figure 2.
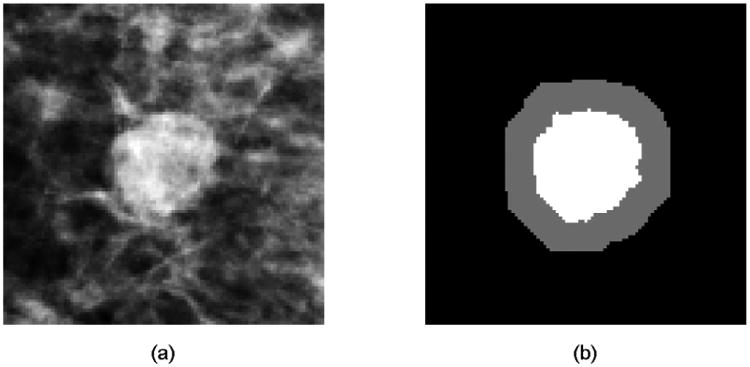
An example of a suspicious mass (a) and computed mass outside surrounding area (b), where the gray area is the outside surrounding area and the white area is the segmented mass area.
| (3) |
Where I is denoted as the set of pixels in the mass region, O is denoted as the set of pixels in the outside surrounding area. The last contrast related feature is computed based on the average gradient vector magnitude of the boundary pixels, which is related to the sharpness of the boundary.
4. Mass homogeneity
The degree of mass density heterogeneity phenotypes contains biologically important tumor development patterns including the degree of tumor stiffness variation and necrosis. To quantify mass density homogeneity, we computed four features. These are 1) standard deviation of pixel intensities inside the mass region. 2) Kurtosis of pixel intensities inside the mass region. 3) Average local pixel intensity fluctuation in the mass region as defined in our previous study [22], where the local pixel intensity fluctuation of a pixel is defined as the maximum absolute difference between the pixel intensity and the intensity of pixels inside a 5×5 square kernel centered at that pixel. 4) Standard deviation of the local pixel intensity fluctuation inside the segmented mass region.
5. Mass speculation
The degree of mass boundary spiculation is another primary characteristic indicating mass malignancy. In this study, we used two radial edge-gradient analysis based features to measure the spiculation of a segmented mass. First, a 3×3 mean filtering was performed on the mammogram as a preprocessing step. A morphological dilation and erosion operation was then applied to the segmented mass region, respectively. The difference between the dilated and eroded image was extracted as the “lesion boundary area.” For each pixel inside the lesion boundary area, the maximum gradient at that pixel and the radial direction from the mass center to the boundary pixel were computed, respectively. Next, the “radial angle” was obtained by the angle between the two vectors (i.e. maximum gradient and radial direction). The radial angles of all pixels in the lesion boundary were collected to form a radial angle histogram. Based on the a priori knowledge that if a mass boundary is not spiculated, the radial angle histogram will tend to be compact and accumulate near 0°, we extracted the kurtosis of the distribution as the first spiculation-related feature. Then the number of pixels whose radial angles were between 60° and 120° or -60° and -120° were counted as “spiculated” pixel number. The spiculated pixel number divided by total pixel number inside the mass boundary area was calculated as the second feature. Figure 3 shows two examples of radial angle histograms, where the first one is from a less-spiculated mass and the second one is from a spiculated mass.
Figure 3.
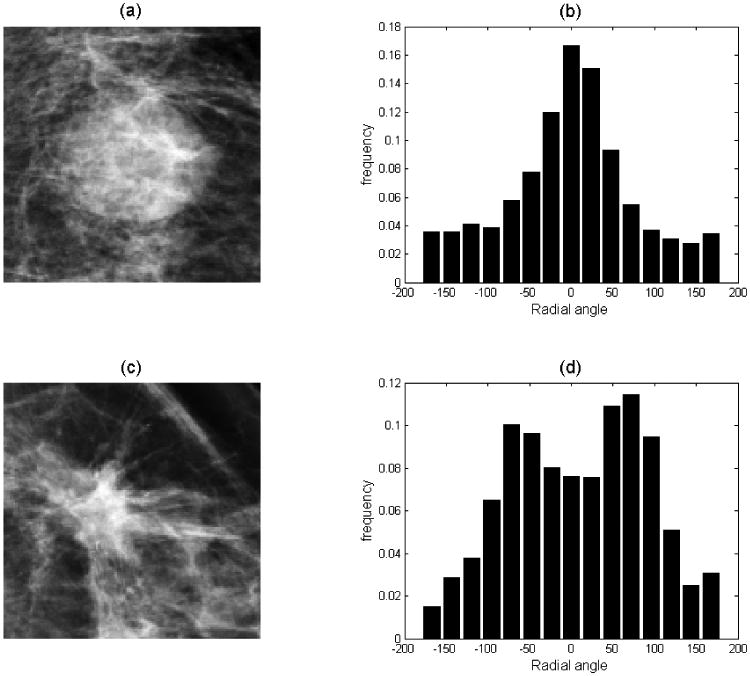
Example of radial angle histogram of two mammographic masses where (a) shows a less-spiculated mass with its radial angle histogram (b); while (c) shows a spiculated mass with its radial angle histogram (d).
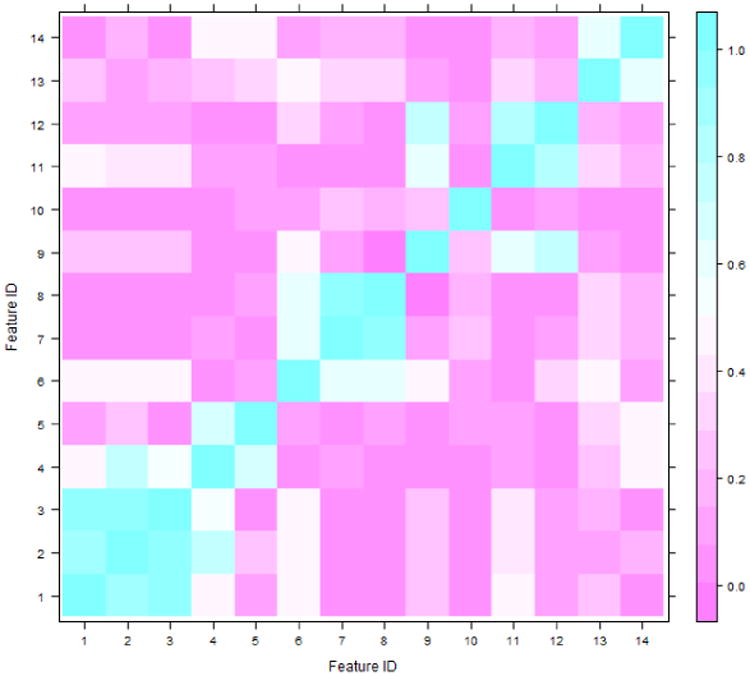
In summary, a total of 14 image features were computed to quantify and represent 5 types of mass characteristics. All values in each of 14 image features were normalized with mean equal to zero and standard deviation equal to one. Figure 4 shows an example of the Spearman's correlation matrix of 14 features, which was generated using all segmented mass regions depicting on the CC view images. The figure shows that the features belonging to the same feature group typically have higher correlation coefficients. Selecting an optimal feature in each mass characteristic group can reduce the redundancy of corresponding features and increase the robustness of the classifier developed in the following step. Hence, our goal in the next step is to identify 5 optimal features (one for each mass characteristic).
Figure 4. Spearsman's correlation coefficients matrix of all 14 extracted features using the segmented masses from CC view mammograms.
2.5 Classification and evaluation
The last step of our CAD scheme applies a machine learning model to classify the lesion by generating a likelihood score of the segmented mass region associating with a malignant mass based on 5 optimally selected image features (one in each category as discussed in section 2.3). In order to make reasoning and internal relationship (or linkage) of the classifier easy explainable or understandable, we trained and implemented a logistic regression classifier into the CAD scheme. Logistic regression is a relatively simple “linear” classifier because its output is only determined by the linear combination of the selected features. The working mechanism of the logistic regression classifier is transparent to the users as the optimized weights of the linear combination can reflect how the features contribute to the classification process.
Next, we embedded the feature selection process into a leave-one-case-out (LOCO) training and testing method to evaluate classifier performance, which enables to minimize both feature selection and classifier training/testing bias due to the limited image dataset [25]. The logistic regression based classifier was built using publically available R project for statistical computing (https://www.r-project.org/). Specifically, in each training and testing cycle of the LOCO, 300 cases were arranged as the training set. Using these 300 cases, the scheme identified one optimal feature with highest discriminatory power among all the features in the same mass characteristic group. For this purpose, a Student's t-test was performed with the null hypothesis that the mean of feature values in the benign case group is identical to that in the malignant case group. The p-values of the t-test for all features in the same feature group were computed and ranked. The feature with smallest p-value was selected as an optimal (or “best representative”) feature of this lesion characteristic group. The classifier was then trained using the five selected features (one in each feature group) over the training dataset of 300 cases. The trained classifier was applied to the remaining case (testing case) to compute a classification score. The classification scores range from 0 to 1, indicating the probability of the mass regions associated with malignant masses. This procedure was iteratively performed 301 times using different training and testing datasets. As a result, each of 301 cases in our dataset was used as a testing case once and obtained a classification score. Subsequently, the classification scores of all cases were processed by a publically available receiver operating characteristic (ROC) curve fitting program based on the use of a maximum likelihood data analysis method (ROCKIT, http://www.xray.bsd.uchicago.edu/krl/roc_soft.htm, University of Chicago). AUC was used as the performance assessment index to evaluate the performance of our CAD scheme.
Since FFDM images are two-dimensional projection images and the image features computed from the same mass depicting on the CC and MLO view images may not be the same due to difference of overlapping breast tissue, we trained and tested two sets of logistic regression based machine learning classifiers using the image features computed from the segmented mass regions depicted on either CC or MLO view mammograms, respectively, in this study. The AUC values of two classifiers were also separately computed and evaluated. Finally, we applied and tested a simple fusion method to combine two classification scores of the same lesion depicted on two CC and MLO view mammograms [26]. Thus, we generated a mass-based classification score for all 301 lesions in our dataset. The mass-based classification performance level (AUC) was also computed and compared with the AUC values generated using a single mass region depicting on either CC or MLO view mammograms.
Finally, in order to make the decision-making process more transparent to the users, we also designed a graphic user interface (GUI). In this way, GUI will display the seed point inside the mass region by marked or clicked by the user, automatically segmented mass boundary contour, the computed feature values, and the classification score. The examples of this interface can be found in the following Results section of this article.
3 Results
Based on the CAD-generated mass segmentation results, the average size of benign masses was 10.37±16.39 mm2 for MLO views and 9.13±18.12 mm2 for CC views, while the average lesion size of benign masses was 13.69±11.15 mm2 for MLO views and 11.94±12.20 mm2 for CC views. The results indicated that (1) the differences between the malignant mass sizes and benign mass sizes are not statistically significant in CC view images of our testing dataset (p = 0.115); while the malignant masses are significantly larger than benign masses in MLO view images (p=0.041), and (2) due to the projection difference, the size of a mass may be different in CC and MLO view images. Figure 5 shows an interface of our CAD scheme displayed on the computer workstation with two examples. One includes a benign mass region and one depicts a malignant mass region. For each detected (or queried) suspicious mass region, our CAD scheme provides the observers (e.g., radiologists) the segmented mass boundary contour, 5 normalized values in 5 image feature categories to show the quantitative levels of computed mass size, shape, contrast, homogeneity and spiculation, as well as the classification score (the probability of being malignant).
Figure 5. Illustration of CAD interface with two mass segmentation examples, the quantitative characteristic feature rating and a classification score for one benign mass (a) and one malignant mass region (b).
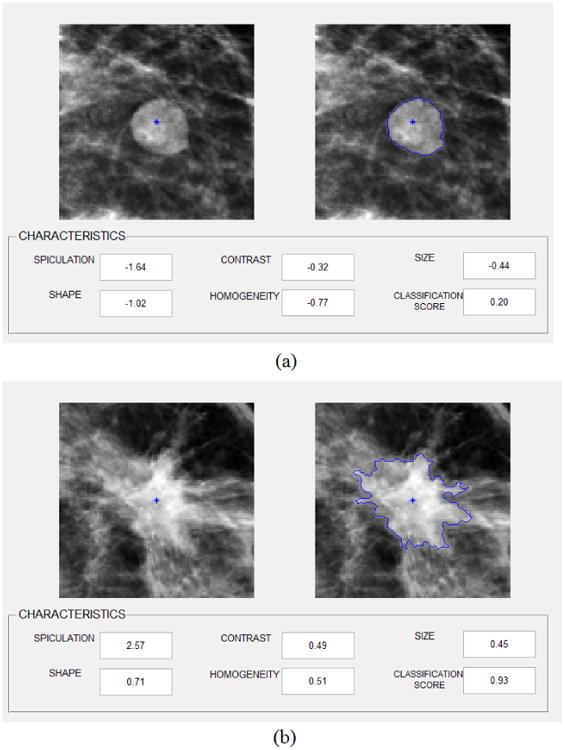
Table 2 summarizes the frequency of the image features selected in the LOCO training and testing process using segmented regions from either CC view or MLO view. It indicates that except one feature in Spiculation category of CC view images, the exactly same (or consistent) combination of 5 optimal features were selected (i.e. feature 1, 4, 6, 9 and 14) in all 301 LOCO training and testing cycles. Table 3 summarizes and compares the discriminatory power (or AUC value) of using each of the 5 most frequently selected mass characteristic features. The results show that all of these 5 visually sensitive features can make contribution to classify between the malignant and benign mass regions with the AUC values that are significantly greater than a random guess (AUC = 0.5). Figure 6 displays and compares two ROC curves generated using the logistic regression classifiers that integrate the 5 selected image features and LOCO training/testing using the mass regions segmented from the MLO and CC view mammograms respectively. The AUC value of 0.758 with 95% confidence interval of (0.702, 0.808) was obtained from the classifier using MLO view mammograms and it is significantly greater than the AUC values obtained from each of the five single optimal features using MLO view mammograms shown in Table 3. For the classifier using CC view mammograms, AUC = 0.786 with 95% confidence interval of (0.732 0.833); it is significantly greater than the AUC values obtained from four of the five single optimal features (i.e. feature 1, 4, 9, 14) using CC view images and the difference is not significant for the remaining one (i.e. feature 6). Two AUC values (i.e. obtained from the classifier using MLO and CC view mammograms respectively) were not statistically significantly different (with a 2-tailed p-value of 0.370 computed using ROCKIT program). The results show that using a simple machine learning classifier enables to further increase the classification performance than using a single image feature (Table 3).
Table 2. Frequency of features computed from the segmented mass regions using the MLO and CC view mammograms selected as “optimal features” by t-tests.
| Feature group | Feature ID | Feature Name | Frequency of selection | |
|---|---|---|---|---|
| MLO | CC | |||
| Size | 1 | Norm mean of RL | 301/301 | 301/301 |
| 2 | Maximum RL | 0/301 | 0/301 | |
| 3 | Mass area | 0/301 | 0/301 | |
| Shape | 4 | Shape factor | 301/301 | 301/301 |
| 5 | RL coefficient of variation | 0/301 | 0/301 | |
| Contrast | 6 | Average intensity difference | 301/301 | 301/301 |
| 7 | Distance based contrast | 0/301 | 0/301 | |
| 8 | Average gradient magnitude | 0/301 | 0/301 | |
| Homogeneity | 9 | Pixel standard deviation | 301/301 | 301/301 |
| 10 | Pixel kurtosis | 0/301 | 0/301 | |
| 11 | Local pixel fluctuation mean | 0/301 | 0/301 | |
| 12 | Local pixel fluctuation STD | 0/301 | 0/301 | |
| Spiculation | 13 | Radial angle kurtosis | 0/301 | 1/301 |
| 14 | Spiculated pixel ratio | 301/301 | 300/301 | |
Table 3. Summarization of AUC values and corresponding 95% confidence intervals (CI) when using each individual feature which is most frequently selected to classify between malignant and benign mass regions in our testing dataset.
| View | Feature | Feature Name | AUC | 95% CI for mean |
|---|---|---|---|---|
| MLO | 1 | Norm mean of RL | 0.655 | (0.592, 0.713) |
| 4 | Shape factor | 0.577 | (0.513, 0.640) | |
| 6 | Average intensity difference | 0.657 | (0.594, 0.7167) | |
| 9 | Pixel standard deviation | 0.582 | (0.517, 0.644) | |
| 14 | Spiculated pixel ratio | 0.634 | (0.570, 0.694) | |
| CC | 1 | Norm mean of RL | 0.666 | (0.603, 0.724) |
| 4 | Shape factor | 0.589 | (0.525, 0.652) | |
| 6 | Average intensity difference | 0.761 | (0.705, 0.811) | |
| 9 | Pixel standard deviation | 0.583 | (0.519, 0.646) | |
| 14 | Spiculated pixel ratio | 0.603 | (0.538, 0.664) |
Figure 6.
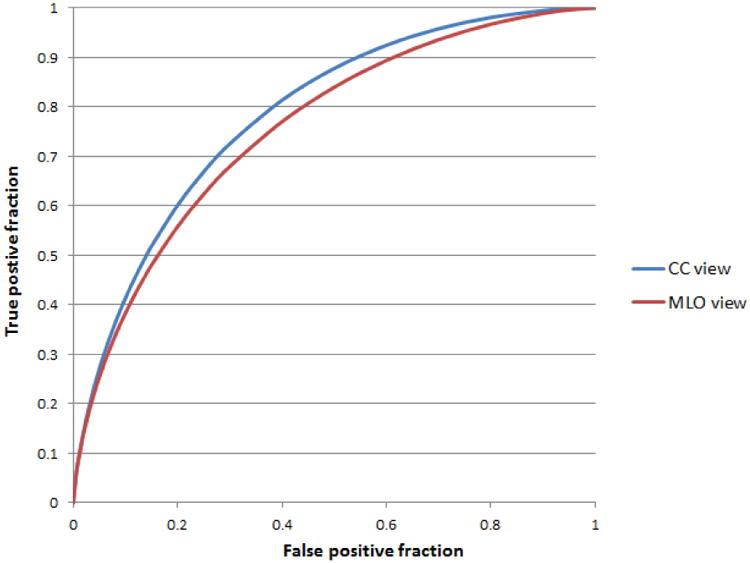
Two ROC curves of two classifiers trained and tested using the mass regions segmented from CC and MLO view images. The AUC values are 0.786±0.026 and 0.758±0.027, respectively.
Table 4 includes two confusion matrices of the classification results of two classifiers that were trained/tested using MLO and CC view images when applying a threshold of 0.5 (at the middle point in the range of the classification scores) to divide between malignant and benign case groups. The results show that applying the new CAD scheme to our testing dataset, 70.1% (211/301) of the mass regions depicted on either MLO view image or CC view images were correctly classified.
Table 4. Two confusion matrices of prediction results for classifying mass regions segmented from MLO and CC view images, respectively.
| MLO view | CC view | |||
|---|---|---|---|---|
| Prediction | Benign | Malignant | Benign | Malignant |
| Benign cases | 99 | 50 | 104 | 45 |
| Malignant cases | 40 | 112 | 45 | 107 |
Table 5 summarizes and compares the classification performance levels (AUC values) of applying 3 simple and direct fusion methods to combine the classification scores of two mass regions depicted on CC and MLO view mammograms. It shows that by using the average classification score between two mass regions, the fused mass-based classification performance level yielded a “best” AUC = 0.806±0.025. It is significantly higher than the AUC value yielded using a logistic regression based classifier optimized using the mass regions depicted on MLO view images (with the computed 2-tailed p = 0.006); while the difference between AUCs obtained by average fusing and by using logistic regression optimized by the CC view mammograms are not statistically significant (p = 0.344).
Table 5. Comparison of mass-based classification performance levels using 3 fusion methods to combine classification results generated by two classifiers using CC and MLO view images.
| MAX | MIN | Average | |
|---|---|---|---|
| AUC | 0.775 | 0.805 | 0.806 |
| Standard deviation | 0.027 | 0.025 | 0.025 |
| 95% Confidence Interval for AUC | (0.720, 0.823) | (0.753, 0.850) | (0.754, 0.851) |
4 Discussion
This study is part of our continuing effort to develop and evaluate computer-aided quantitative image feature analysis schemes to assist predicting cancer risk [27], improving tumor detection [28] and diagnosis [29, 30], and assessing patient prognosis or treatment efficacy [31-33]. Among them, developing a more effective CAD tool to assist classifying between malignant and benign soft breast tissue masses is also important to help increase efficacy of screening mammography. Although great research effort has been made in developing CAD schemes aiming to better classify suspicious mammographic masses, due to the difference between human vision and computer vision, the confidence level of radiologists to accept or consider the classification results generated by the “black-box” type CAD schemes is quite low [16, 17] because classification accuracy is not the only objective in many machine learning applications whereas interpretability is also an important one [34]. In order to help solve this application problem, we in this study explored a new approach to develop and test CAD scheme. Although a large number of texture features can be computed from mammograms and applied to develop CAD schemes, these features are typically not visually sensitive or easily explainable to the observers. The new CAD scheme presented in this study uses 5 simple and visually sensitive image features. Using these image features, we aim to mimic and quantify 5 important characteristics of mammographic masses, which are routinely used by radiologists to interpret or assess the likelihood of a detected suspicious breast mass being malignant. The potential advantage of this new approach is not limited to only increasing the confidence of radiologists on the CAD results as these features are visually sensitive and understandable, but also eliminates the inter-observer variability in rating these features.
Although we cannot directly compare the classification performance of our CAD schemes with the performance levels of previously reported CAD schemes (e.g., Table 1) due to the use of different testing image datasets, we demonstrated the feasibility of applying a new CAD scheme optimized using a set of simple and visually sensitive image features to yield a comparable performance level of the CAD schemes that are optimized using much more complicated texture features and machine learning classifiers (i.e., artificial neural networks). In this way, under a comparable CAD performance level, using our CAD scheme can provide radiologists not only a classification score, but also the segmented mass boundary contour along with 5 quantitative image features that are routinely visually assessed or rated in the current clinical practice (as shown in Figure 5). This is a new “visual aided” CAD based classification approach, which enables us to provide radiologists with a new computer-assisted mammogram reading and interpretation environment in future observer performance studies, which is always an important task in medical imaging reading and diagnosis field [35].
In our study, we also compared the classification performance levels using different image feature sets and classifiers. First, we tested another feature selection method using a non-parametric (or Wilcoxon) rank sum test and re-evaluated the logistic regression classifier using the same LOCO training and testing method. The results showed that AUC values of 0.758±0.027 and 0.736±0.028 were obtained from the MLO and CC view image based classifier, respectively. Comparing to the AUC values yielded using the Student's t-test based feature selection (as shown in Figure 6), we observed when using Wilcoxon rank sum test based feature selection, the classifier that was trained and tested using MLO view images yielded the same classification performance (p = 1.0) as the same features were selected. In contrast, different features were selected using the Wilcoxon rank sum test for the classifier trained and tested using CC view images, which yielded a significantly lower performance (p = 0.02). This indicates that overall, using Student's t-tests outperformed Wilcoxon rank sum tests for the feature selection tasks in this study.
Second, we also evaluated two logistic regression classifiers that were trained and tested using a total of 14 features (as shown in Table 2) from the mass regions depicting on either MLO or CC view images, respectively. The results show that AUC values of 0.730±0.029 and 0.776±0.026 were obtained using the two MLO and CC view image based classifiers that were trained and tested using the same LOCO cross-validation method embedded with feature selection. Statistically significant differences were detected between the logistic regression classifier using all 14 features and the 5 optimal features computed from the mass regions from MLO view images (p< 0.05); while for CC view images, the AUC value obtained using the 14 features based classifier was lower than using the optimal features based classifier, but the difference is not significant (p = 0.48). This indicates that removing redundant image features may potentially improve classifier performance and robustness of the classifier in future tests using new independent image datasets.
In addition, we have made a number of new observations from our study results. First, in medical image processing, many different methods or formulas can be used to compute and quantify the same category of features (i.e., contrast and spiculation). In this study, we tested several different methods to compute or quantify the 5 categories of mass features. The comparison results show that using one optimal feature in each of the 5 categories can yield better classification performance level compared to using all 14 extracted features, which indicates that the non-optimal or redundant features can be filtered out and removed by the Student's t-test based feature selection method. Therefore, we demonstrated that an optimal feature with highest discriminatory power in one category might be easily selected by applying a simple Student's t-test based feature selection method and can potentially improve the performance level of the classifier. Second, since mammograms are two-dimensional projection images, the image features computed from two mass regions depicting on CC and MLO view images may have substantial variation, which also affects the two classification scores. Hence, using a fusion method to combine the two classification scores yielded from two mass regions to generate a final mass-based classification score also has potential to significantly increase the classification performance level compared to using a single mass region based scheme.
In summary, we developed a new CAD scheme for classification between malignant and benign mammographic mass regions using 5 visually sensitive image features and a straightforward logistic regression model based classifier. We demonstrated that by more closely mimicking how the radiologists classify mammographic lesions, a new and simple scheme can yield a comparable classification performance as compared to other previously developed and reported schemes (e.g., Table I). Meanwhile, due to its simplicity and more transparent reasoning of the feature selection and case classification process, using this new CAD scheme has potential to help increase radiologists' confidence to accept or consider the CAD-generated classification results. However, despite the encouraging study results, this is a preliminary study with a number of limitations. First, this study only used a relatively small image dataset, which may not represent general breast masses in a diverse screening mammography practice. Thus, performance and robustness of the CAD scheme needs to be further tested using new larger and more diverse image databases. Second, this is only a technology development study with a proposed new CAD based classification method. How to use this new CAD scheme and GUI method to help increase radiologists' confidence in CAD generated classification results and improve their decision-making in classifying between malignant and benign masses (i.e., reducing false-positive recalls) needs to be tested in future observer performance studies. Therefore, more research work is still needed to optimize and test the performance and robustness of this new type of CAD scheme.
Acknowledgments
This work is supported in part by Grants of R01CA160205 and R01CA197150 from the National Cancer Institute, National Institutes of Health. The authors would also like to acknowledge the support from the Peggy and Charles Stephenson Cancer Center, University of Oklahoma as well.
References
- 1.Schell MJ, Yankaskas BC, Ballard-Barbash R, et al. Evidence-based target recall rates for screening mammography. Radiology. 2007;243:681–689. doi: 10.1148/radiol.2433060372. [DOI] [PubMed] [Google Scholar]
- 2.Brodersen J, Siersma VD. Long-term psychosocial consequences of false-positive screening mammography. Ann Fam Med. 2013;11:106–15. doi: 10.1370/afm.1466. [DOI] [PMC free article] [PubMed] [Google Scholar]
- 3.Gur D, Abrams GS, Chough DM, et al. Digital breast tomosynthesis: observer performance study. Am J Roentgenol. 2009;193:586–591. doi: 10.2214/AJR.08.2031. [DOI] [PubMed] [Google Scholar]
- 4.Malliori A, Bliznakova K, Bliznakov Z, et al. Breast tomosynthesis using the multiple projection algorithm adapted for stationary detectors. J Xray Sci Technol. 2016;24:23–41. doi: 10.3233/XST-160538. [DOI] [PubMed] [Google Scholar]
- 5.Kulkarni M, Dendere R, Nicolls F, Douglas TS. Monto-Carlo simulation of slot-scanning digital mammography system for tomosynthesis. J Xray Sci Technol. 2016;24:191–206. doi: 10.3233/XST-160543. [DOI] [PubMed] [Google Scholar]
- 6.Ayer T, Ayvaci MU, Liu ZX, Alagoz O, Burnside ES. Computer-aided diagnostic models in breast cancer screening. Imaging Med. 2010;2:313–323. doi: 10.2217/IIM.10.24. [DOI] [PMC free article] [PubMed] [Google Scholar]
- 7.Nishikawa RM, Gur D. CADe for early detection of breast cancer – current status and why we need to continue to explore new approaches. Acad Radiol. 2014;21:1320–1321. doi: 10.1016/j.acra.2014.05.018. [DOI] [PubMed] [Google Scholar]
- 8.Mudigonda NR, Rangayyan RM, Desautels J. Gradient and texture analysis for the classification of mammographic masses. IEEE Trans Med Imaging. 2000;19:1032–1043. doi: 10.1109/42.887618. [DOI] [PubMed] [Google Scholar]
- 9.Hadjiiski L, Sahiner B, Chan HP, Petrick N, Helvie M. Classification of malignant and benign masses based on hybrid art2lda approach. IEEE Trans Med Imaging. 1999;18:1178–1187. doi: 10.1109/42.819327. [DOI] [PubMed] [Google Scholar]
- 10.Huo Z, Giger ML, Vyborny CJ, Wolverton DE, Metz CE. Computerized classification of benign and malignant masses on digitized mammograms: A study of robustness. Acad Radiol. 2000;7:1077–1084. doi: 10.1016/s1076-6332(00)80060-4. [DOI] [PubMed] [Google Scholar]
- 11.Lim W, Er MJ. Classification of mammographic masses using generalized dynamic fuzzy neural networks. Med Phys. 2004;31:1288–1295. doi: 10.1118/1.1708643. [DOI] [PubMed] [Google Scholar]
- 12.Varela C, Timp S, Karssemeijer N. Use of border information in the classification of mammographic masses. Phys Med Biol. 2006;51:425–441. doi: 10.1088/0031-9155/51/2/016. [DOI] [PubMed] [Google Scholar]
- 13.Liu X, Liu J, Zhou D, Tang J. 4th International Conference on Bioinformatics and Biomedical Engineering (ICBBE) IEEE; 2010. A benign and malignant mass classification algorithm based on an improved level set segmentation and texture feature analysis. [DOI] [Google Scholar]
- 14.Tan M, Pu J, Zheng B. Optimization of breast mass classification using sequential forward floating selection (SFFS) and a support vector machine (SVM) model. International Journal of Computer Assisted Radiology and Surgery. 2014;9:1005–1020. doi: 10.1007/s11548-014-0992-1. [DOI] [PMC free article] [PubMed] [Google Scholar]
- 15.Midya A, Chakraborty J. 12th International Symposium on Biomedical Imaging (ISBI) IEEE; 2014. Classification of benign and malignant masses in mammograms using multi-resolution analysis of oriented patterns; pp. 411–414. [Google Scholar]
- 16.Wang XH, Zheng B, Good WF, King JL, Chang YH. Computer-assisted diagnosis of breast cancer using a data-driven Bayesian belief network. Int J Med Inform. 1999;54:115–126. doi: 10.1016/s1386-5056(98)00174-9. [DOI] [PubMed] [Google Scholar]
- 17.Zheng B, Abrams G, Britton CA, et al. Evaluation of an interactive computer-aided diagnosis system for mammography: A pilot study. Proc SPIE. 2007;6515:65151M. [Google Scholar]
- 18.Oliver A, Freixenet J, Marti J, et al. A review of automatic mass detection and segmentation in mammographic images. Med Image Analysis. 2010;14:87–110. doi: 10.1016/j.media.2009.12.005. [DOI] [PubMed] [Google Scholar]
- 19.Kupinski M, Giger ML. Automated seeded lesion segmentation on digital mammograms. IEEE Trans Med Imaging. 1998;17:510–517. doi: 10.1109/42.730396. [DOI] [PubMed] [Google Scholar]
- 20.Wang X, Li L, Liu W, Xu W, Lederman D, Zheng B. An interactive system for computer-aided diagnosis of breast masses. Journal of Digital Imaging. 2012;25:570–579. doi: 10.1007/s10278-012-9451-0. [DOI] [PMC free article] [PubMed] [Google Scholar]
- 21.Eisenhauer E, Therasse P, Bogaerts J, et al. New response evaluation criteria in solid tumors: Revised RECIST guideline (version 1.1) Euro J Cancer. 2009;45:228–247. doi: 10.1016/j.ejca.2008.10.026. [DOI] [PubMed] [Google Scholar]
- 22.Zheng B, Chang YH, Good WF, Gur D. Performance gain in computer-assisted detection schemes by averaging scores generated from artificial neural networks with adaptive filtering. Med Phys. 2001;28:2302–2308. doi: 10.1118/1.1412240. [DOI] [PubMed] [Google Scholar]
- 23.Zheng B, Chang Y, Gur D. On the reporting of mass contrast in CAD research. Med Phys. 1996;23:2007–2009. doi: 10.1118/1.597775. [DOI] [PubMed] [Google Scholar]
- 24.te Brake GM, Karssemeijer N, Hendriks JH. An automatic method to discriminate malignant masses from normal tissue in digital mammograms. Phys Med Biol. 2000;45:2843–2851. doi: 10.1088/0031-9155/45/10/308. [DOI] [PubMed] [Google Scholar]
- 25.Varma S, Simon R. Bias in error estimation when using cross-validation for model selection. BMC Bioinformatics. 2006;7:91. doi: 10.1186/1471-2105-7-91. [DOI] [PMC free article] [PubMed] [Google Scholar]
- 26.Wang X, Lederman D, Tan J, Wang XH, Zheng B. Computerized prediction of risk for developing breast cancer based on bilateral mammographic breast tissue asymmetry. Med Eng Phys. 2011;33:934–942. doi: 10.1016/j.medengphy.2011.03.001. [DOI] [PMC free article] [PubMed] [Google Scholar]
- 27.Tan M, Zheng B, Leader JK, Gur D. Association between changes in mammographic image features and risk for near-term breast cancer development. IEEE Trans Med Imaging. 2016;35:1719–1728. doi: 10.1109/TMI.2016.2527619. [DOI] [PMC free article] [PubMed] [Google Scholar]
- 28.Tan M, Pu J, Zheng B. Reduction of false-positive recalls using a computerized mammographic image feature analysis scheme. Phys Med Biol. 2014;59:4357–4373. doi: 10.1088/0031-9155/59/15/4357. [DOI] [PMC free article] [PubMed] [Google Scholar]
- 29.Yang Q, Li L, Zhang J, Shao G, Zheng B. A new quantitative image analysis method for improving breast cancer diagnosis using DCE-MRI examinations. Med Phys. 2015;42:103–109. doi: 10.1118/1.4903280. [DOI] [PMC free article] [PubMed] [Google Scholar]
- 30.Gundreddy RR, Tan M, Qiu M, Cheng S, Liu H, Zheng B. Assessment of performance and reproducibility of applying a content-based image retrieval scheme for classification of breast lesions. Med Phys. 2015;42:4241–4249. doi: 10.1118/1.4922681. [DOI] [PMC free article] [PubMed] [Google Scholar]
- 31.Wang Y, Qiu Y, Thai T, et al. Applying a computer-aided scheme to detect a new radiographic image marker for prediction of chemotherapy outcome. BMC Medical Imaging. 2016;16:52. doi: 10.1186/s12880-016-0157-5. [DOI] [PMC free article] [PubMed] [Google Scholar]
- 32.Emaminejad N, Qian W, Guan Y, et al. Fusion of quantitative image features and genomic biomarkers to improve prognosis assessment of early stage lung cancer patients. IEEE Transactions on Biomedical Engineering. 2016;63:1034–1043. doi: 10.1109/TBME.2015.2477688. [DOI] [PubMed] [Google Scholar]
- 33.Aghaei F, Tan M, Hollingsworth AB, Zheng B. Applying a new quantitative global breast MRI feature analysis scheme to assess tumor response to chemotherapy. Journal of Magnetic Resonance Imaging. 2016;44:1099–1106. doi: 10.1002/jmri.25276. [DOI] [PMC free article] [PubMed] [Google Scholar]
- 34.Ishibuchi H, Nojima Y. Analysis of interpretability-accuracy tradeoff of fuzzy systems by multiobjective fuzzy genetics-based machine learning. International Journal of Approximate Reasoning. 2007;44:4–31. [Google Scholar]
- 35.Chen M, Kalra MK, Yun W, et al. A mixed realty approach for stereo-tomographic quantification of lung nodules. J Xray Sci Technol. 2006;24:615–625. doi: 10.3233/XST-160578. [DOI] [PubMed] [Google Scholar]