

SUMMARY
Direct cell programming via overexpression of transcription factors (TFs) aims to control cell fate with the degree of precision needed for clinical applications. However, the regulatory steps involved in successful terminal cell fate programming remain obscure. We have investigated the underlying mechanisms by looking at gene expression, chromatin states, and transcription factor binding during the uniquely efficient Ngn2, Isl1, and Lhx3 motor neuron programming pathway. Our analysis reveals a highly dynamic process in which Ngn2 and the Isl1/Lhx3 pair initially engage distinct regulatory regions. Subsequently, Isl1/Lhx3 binding shifts from one set of targets to another, controlling regulatory region activity and gene expression as cell differentiation progresses. Binding of Isl1/Lhx3 to later motor neuron enhancers depends on the TFs Ebf and Onecut, which are induced by Ngn2 during the programming process. Thus, motor neuron programming is the product of two initially independent transcriptional modules that converge with a feedforward transcriptional logic.
Graphical abstract
eTOC SUMMARY
Mazzoni and colleagues show that transcription factor-directed programming of ESCs to motor neurons involves two distinct regulatory modules that converge when programming TFs are relocated by the activity of factors induced in the earlier stage of the process.
INTRODUCTION
Direct programming by the overexpression of transcription factors (TFs) promises to improve in vitro disease modeling and produce clinically relevant cell types for future cell replacement therapies. During embryonic development or in vitro directed differentiation, cells acquire their terminal fate by progressively transitioning through intermediate progenitor stages. Accordingly, the transcriptional profile and chromatin states are also progressively shaped until they reach the terminal state (Gifford et al., 2013). On the other hand, successful direct programming requires that the derived transcriptional network completely replaces the resident one without the benefit of transitioning through the developmental intermediate progenitor states. Thus, there are several unanswered questions about this abrupt transition. Are all terminal genes upregulated with the same kinetics and do they all follow similar chromatin trajectories? Do the programming TFs directly associate with terminal genes or do their binding targets change as programming progresses? What is the role of transcription factors induced at early programming stages? Without such guiding principles to help design direct programming strategies for generating cells that are copies of those found in vivo, most current direct programming protocols remain inefficient. Understanding the molecular mechanisms underlying such drastic cell fate transitions will be instrumental to improving the efficiency of direct programming protocols.
Programming TFs must activate cell-specific genes when expressed in cellular and epigenetic conditions alien to those they face during embryonic development. These cell-specific gene targets may not be accessible or expression-competent in the initial cell state. How programming TFs engage the genome was investigated during the programming of two diametrically opposite cell fates, leading to two alternative models. Soufi and co-workers proposed a dynamic model whereby the OSKM reprogramming factors cooperatively bind to a broad set of regulatory regions that are ultimately refined in cells that are successfully reprogrammed to a pluripotent state (Soufi et al., 2012). In a small percentage of the cells, the OSKM factors have the ability to bind to repressed chromatin domains and activate pluripotency gene expression (Soufi et al., 2012; Soufi et al., 2015). Alternatively, during programming of excitatory neurons from fibroblasts, Ascl1 is proposed to rapidly bind “on-target” to a set of terminal state regulatory regions (Wapinski et al., 2013). The contrasting programming TF behaviors (dynamic off-target versus static on-target) could be due to intrinsic differences when programming rapidly dividing pluripotent cells versus a postmitotic neuron. However, the low efficiency of most programming protocols to terminal fates precludes the investigation of chromatin and transcription factor dynamics at regulatory regions and genes without confounding signals from cells that are not following a productive programming path. Therefore, although the programming processes have begun to be delineated, the chromatin trajectories and functions of genes induced during such cellular conversions remain obscure.
In an extreme case of rapid and efficient direct programming, we have recently shown that the expression of Ngn2, Isl1, and Lhx3 TFs (the NIL factors) directly programs spinal motor neuron fate without the application of patterning signals (Mazzoni et al., 2013). When expressed in pluripotent cells, the NIL factors program motor neuron fate within 48 hours, bypassing all intermediate motor neuron progenitor states. The terminal motor neurons share cellular and molecular properties with motor neurons generated during development. The expression of the NIL factors in pluripotent stem cells has two clear advantages as a model of TF-mediated direct programming. First, NIL expression programs spinal motor neurons, a specific cell type that has a known correlate in vivo (Dasen and Jessell, 2009; Jessell, 2000) and is a desired programming target for clinical applications. Thus, it is possible to precisely measure the cellular outcome. Second, NIL programming is extremely efficient, above 90%, making it possible to study productive and effective direct programming without the confounding signals of cells that failed to achieve complete terminal fate.
To understand how cells transition from a rapidly dividing pluripotent stem cell to a postmitotic spinal motor neuron, we investigated the dynamics of the transcriptome, chromatin landscape, and programming TF binding during the first 48 hours after NIL expression (Figure 1A and S1A). Our results revealed that NIL-directed programming is the product of a transcriptional and chromatin multi-step cascade. We suggest that motor neuron programming is the result of two independent regulatory modules induced by Ngn2 and the Isl1/Lhx3 pair that converge with a feedforward regulatory logic by the activity of the Onecut and Ebf TF families.
Figure 1. NIL programming factors induce a transcriptional cascade driving a uni-directional cell fate transition from pluripotent cells to motor neurons.

A) Schematic overview of the experimental procedure. Spinal motor neurons (sMN) are obtained 48h after inducing the expression of Ngn2-Isl1-Lhx3 (NIL) transcription factors (TFs) in pluripotent cells. Cells collected at distinct time points after NIL induction were subjected to RNA-seq, ATAC-seq and ChIP-seq for histone modifications (H3K4me1/2/3 and H3K27ac/me3) and NIL TFs. B) Single cell RNA-seq time-course. Ordering each cell based on its pseudo-time reveals a uni-directional differentiation trajectory, with no branches or intermediate products. C) Promoter classes based on combinatorial histone modification dynamics at promoters (left) classified using a Bayesian Network model for time-course chromatin states (see Methods) and their corresponding gene expression levels (right). Histone ChIP-seq values displayed are averaged for each promoter region and linearly scaled so that different histone modifications are comparable. D) Detailed overview of gene expression dynamics for the different up- and down-regulated promoter classes. Gene FPKM values were scaled on the gene level to highlight gene expression dynamics. The height of the heat map of each promoter class is related to the number of genes that are unambiguously assigned to it (genes per class: P1=773, P2=1241, P3=1472, P4=2878, P5=1927, P6=1875, P7=1020, P8=1682, P9=1758, P10=2022, P11=2325).
RESULTS
Single cell RNA-seq reveals a rapid transcriptional cascade during direct programming
Direct programming is characterized by the activity of one or more regulators that force the establishment of a different transcriptional network and thus a new cell fate. We have previously reported the drastic transcriptional transformation that results from NIL expression in ESCs (Mazzoni et al., 2013). However, we did not analyze two important aspects of this transformation: the programming trajectory and the homogeneity of the terminal cell population. We thus investigated these aspects using single cell RNA-seq.
We performed single cell expression analysis before inducing the NIL factors and at 6, 12, 18, 24, 30, 36 and 48 hours (h) after treating the inducible NIL cells with Doxycycline and successfully sequenced a total of 368 cells. We used diffusion maps to estimate pseudo-time ordering for each cell into a differentiation progression path (Haghverdi et al., 2015). Organizing the cells by differentiation pseudo-time reveals a remarkably unidirectional trajectory with no apparent branching points or roadblocks to programming motor neurons within 48 hours (Figure 1B). Reassuring to our unsupervised path reconstruction and as expected from the differentiation protocol, the differentiation pseudo-time trajectory contains a unique starting point. Moreover, single cell expression analysis of a selected group of genes (n = 705) reveals different activation and repression kinetics during programming, also recovered with the cell population average observed in bulk RNA-seq (Figure S1B). Thus, NIL programming factors induce a series of transcriptional changes that directly programs postmitotic motor neuron fate from pluripotent cells through a single differentiation trajectory. Moreover, these results suggest that NIL programming dynamics can be assessed using population-wide assays like bulk RNA-seq and ChIP-seq without loss of temporal resolution.
NIL expression induces remodeling of chromatin at promoters
In stepwise cell differentiation, progressive chromatin changes at promoters restrict the differentiation potential as cells become more differentiated, while the chromatin landscape must be rapidly transformed to complete programming. To understand chromatin dynamics during motor neuron programming, we performed a ChIP-seq time series (0h, 12h, 24h, 48h after NIL induction) for histone H3 lysine 4 trimethylation (H3K4me3), and histone H3 lysine 27 trimethylation (H3K27me3) and acetylation (H3K27ac) (Figure 1A). To discover groups of promoters based on their histone modification time-course profiles, we designed a conditional Gaussian Bayesian Network model (Lauritzen and Wermuth, 1989; Pearl, 1988) that can learn and classify combinatorial time-course trajectories of multiple ChIP-seq datasets such that a given cluster represents the dynamic trajectories of all analyzed histone modifications together (Figure S1C). The model assumes that each histone modification is independent of all others given the cluster assignment, and operates on the fold changes between the time-points for each histone modification assuming that a given fold change value for a given histone modification is dependent upon the preceding fold change value (Figure S1C, see Methods).
We applied this model to cluster promoter regions based on the combinatorial trajectories of H3K4me3, H3K27ac and H3K27me3 histone modifications into 11 promoter classes (P1 to P11, Figure 1C, and Figure S1D). Grouping those promoter classes into three broad groups for upregulation, downregulation and no-change reveals that promoters follow multiple distinct activation and repression trajectories, which in turn correspond to distinct gene expression dynamics (Figure 1C). This is reflected in the extent of up- or downregulation as well as the slope of change in gene expression. Scaling the expression of each gene and visualizing the scaled values as a heat map shows that different promoter groups correspond to different up- and down-regulation kinetics (Figure 1D).
The highest promoter and transcription activation occurs in P1 promoters, which start in a bivalent H3K4me3/H3K27me3 state (Figure S1E) and resolve into an active H3K4me3/H3K27ac state (Bernstein et al., 2006; Hawkins et al., 2011). Gene Ontology (GO) (Gene Ontology, 2015) and Reactome pathway enrichment analysis (Croft et al., 2014; Milacic et al., 2012) shows that those genes are enriched in motor neuron differentiation and axonogenesis genes (Table S1). In contrast, P7 promoters show an opposite trend where they start in an active H3K4me3/H3K27ac state and switch to a repressed H3K27me3 state, also reflected in a strong and rapid decrease in gene expression. GO and Reactome analysis show enrichment for pluripotency genes in this group (Table S1). Similar to P1 promoters, P10 promoters start in a bivalent H3K4me3/H3K27me3 state (Figure S1E), but are not activated during differentiation. GO analysis indicates a general enrichment for cell fate specification showing that this group includes cell-fate specific genes that are not activated during motor neuron differentiation. The contrast between P1, P7 and P10 promoters suggests that during NIL induction pluripotency genes (e.g. Lin28a, Fgf4, Oct4 and Sox2) are repressed as stem cell fate is extinguished, presumably by the activity of the programming factors and culture conditions, while neuron (e.g. Tubb3) and motor neuron genes (e.g. Chat, Isl2 and Hb9) are activated, and genes related to other developmental pathways are unchanged (e.g. Tead4, Tbx5, GATA6) (Figure 1C-D).
Therefore, NIL induction in a chromatin environment distinct to that encountered during normal development results in significant promoter chromatin remodeling consistent with a motor neuron fate. Further, these results reveal that even without transitioning through progenitor stages, bivalent chromatin states at promoters get resolved in a lineage specific manner as they do during stepwise differentiation.
Ngn2 and Isl1/Lhx3 target distinct genomic loci during early motor neuron programming
How does the forced expression of Ngn2, Isl1 and Lhx3 control a unidirectional differentiation trajectory with multiple dynamic expression and chromatin changes? To answer this question, we investigated the binding pattern of Ngn2, Isl1 and Lhx3 after induction and deployed MultiGPS, an integrative machine-learning approach for profiling multi-condition ChIP-seq datasets (Mahony et al., 2014) (see Methods).
We found that Isl1 and Lhx3 co-occupy 98% of their bound regulatory regions at 12h post-induction (Figure 2A), consistent with what we previously reported at 48h (Mazzoni et al., 2013). However, only ~13% of Isl1/Lhx3 binding overlaps with Ngn2 at 12h (Figure 2B). Furthermore, GO term analysis of genes close to Ngn2 versus Isl1/Lhx3 bound regions shows that Isl1/Lhx3 binding is associated with specific spinal cord and motor neuron genes, while Ngn2 binding is associated with more generic neuronal differentiation activities (Table S2). These results suggest that Ngn2 controls genes associated with a more general neuronal fate while Isl1 and Lhx3 activate motor neuron specific gene expression.
Figure 2. Ngn2 and Isl1/Lhx3 show distinct DNA binding preferences during NIL programming.

A) Lhx3 and Isl1 co-bind at 12h after inducing the NIL TFs. B) Lhx3 and Ngn2 bind to largely distinct sets of sites at 12h after inducing the NIL TFs (Lhx3 only sites=13,459; Ngn2 only sites=11,019 ; Lhx3 and Ngn2 sites=2,056). C) Lhx3 binding is dynamic during NIL programming. “Early only” sites (n=2,477) are bound only in the early stages, “constant” sites (n=3,824) are bound stably throughout the process of programming, while “late only” sites (n=1,682) are bound only at the later stages of programming. Heat maps in panels A and B show ChIP-seq binding sites for TFs ordered by binding strength, while heat maps in panel C are ordered based on the fold enrichment in 12h ChIP with respect to 48h ChIP within each dynamic binding class. D) Ngn2 binding and “early only” Lhx3 binding favor more accessible regions than constant and “late only” Lhx3 binding. Histograms show the distribution of 0h ATAC-seq counts within 100 bp of Ngn2 12h, Lhx3 “early only”, Lhx3 “constant” and Lhx3 “late only” binding sites. Distinct colors are used to indicate counts that fall in accessible (blue) and inaccessible (orange) regions (see Methods).
Dynamic binding of Isl1 and Lhx3 during cell programming
To assess whether the programming factors stably associate with regulatory regions controlling motor neuron fate or if their binding patterns change over time following activation, we first profiled Isl1 and Lhx3 binding at 12h, 24h and 48h using ChIP-seq. We also assessed Isl1 and Lhx3 binding at an earlier 8h time point, before the programming factors reach maximum level of expression. The binding pattern is almost identical (<8% difference) between 8h and 12h (Figure S2A), and therefore we used the latter more robust data as our baseline for early binding. Since Ngn2 protein levels rapidly decrease as cells become postmitotic (Mazzoni et al., 2013), we did not assess Ngn2 binding dynamics after 12 hours.
Out of 14,969 sites bound by both Isl1 and Lhx3 observed during programming, we could confidently categorize 7,983 of them into 3 binding classes based on their dynamic behavior during programming (Figure 2C; since Isl1 and Lhx3 binding is highly correlated, we show only Lhx3 for simplicity). Of these categorized sites, 31% were assigned to an “early only” class, where programming factors bind at early stages of reprogramming and lose their binding as cells transition into a postmitotic motor neuron fate. Another 48% of the binding events did not show any markedly differential ChIP enrichment over the course of programming and were assigned to a “constant” class. The programming factors engage these sites at early stages of programming and maintain their binding until cells are completely programmed. A further 21% were assigned to a “late only” class; these sites are only engaged later in the programming process. Therefore, Isl1 and Lhx3 binding divides into a group of sites constantly engaged during programming and sites that are dynamic even during the short 48h span of motor neuron programming.
NIL factors associate with both accessible and inaccessible regulatory regions
The plastic pluripotent state is often thought to be associated with chromatin states that are poised to be activated. Therefore, the high programming efficiency by the NIL factors might be due to their binding targets being mostly located in accessible chromatin in pluripotent cells. To investigate this model, we mapped accessibility by ATAC-seq (Buenrostro et al., 2013) before NIL induction (0h, Figure 2D). ATAC-seq cut site counts at Ngn2, Isl1/Lhx3 “early only”, Isl1/Lhx3 “constant” and Isl1/Lhx3 “late only” binding sites demonstrate that transient early binding by Ngn2 or Isl1/Lhx3 is split between accessible and inaccessible regulatory regions. However, Isl1/Lhx3 constant binding and late binding occur in regions that were mostly inaccessible by ATAC-seq before programming began (Figure S2B). Therefore, the high programming efficiency by NIL factors does not solely rely on binding sites being accessible prior to NIL expression but is also associated with regulatory regions that are inaccessible in the initial cell fate.
Isl1 and Lhx3 binding correlates with enhancer dynamics during programming
To identify the enhancers controlled by NIL and to understand if programming TF binding activates, decommissions, or is inconsequential for the chromatin state of regulatory elements, we asked whether enhancer chromatin dynamics correlates with Ngn2, Isl1 and Lhx3 binding during programming. Ngn2 binding to previously accessible regions largely took place in proximal promoter regions, whereas binding at inaccessible sites occurred distally to genes (Figure S2C). Consistent with its role activating the general neuronal program, proximal regulatory regions associated with Ngn2 accessible binding remain accessible and active (Figure 3A, 3B, S3A and S3B). 0h-accessible “early only” Isl1/Lhx3 sites rapidly lose accessibility, H3K27ac, H3K4me2 and H3K4me1 during programming (Figure 3A, 3B and S3A). On the other hand, Isl1/Lhx3 “constant” and “late only” sites occur in regions of the genome with low initial accessibility and activity that change to accessible and active upon TF binding, as evident by an increase in ATAC-seq reads and a concomitant H3K27ac, H3K4me2 and H3K4me1 enrichment as programming progresses (Figure 3A, 3B and S3A). Therefore, early Isl1/Lhx3 binding to distal regulatory regions seems to be associated with decommissioning of enhancers active at the initial cell fate, while “constant” and “late only” Isl1 and Lhx3 binding promote enhancer activation.
Figure 3. Regulatory regions bound by the NIL programming factors follow distinct activation and inactivation dynamics that correlate with promoter activity.

Changes of DNA accessibility (A) and H3K27ac histone modification levels (B) stratified according to NIL TF binding dynamics. DNA accessibility is displayed using ATAC-seq cut sites depth-normalized counts. H3K27ac is displayed using ChIP-seq averaged depth-normalized counts. Counts were quantile-normalized across time (see Methods). See Figure S3A for the corresponding H3K4me2 and H3K4me1 plots. C) Association frequencies of TF binding sites with promoters classes (P1-P11, see Figure 1 for classifications) represented as log2 fold-change relative to a random model of association frequencies (see Methods). Each TF binding site was assigned to its closest promoter, with a distance cutoff of 100kb.
NIL binding dynamics is associated with promoter dynamics
The fact that chromatin dynamics at regulatory elements directly correspond to Isl1/Lhx3 binding dynamics suggests that NIL binding dynamics might be directly responsible for the expression waves observed during programming (Figure 1C). Thus, we investigated if Ngn2, Isl1 and Lhx3 enhancer binding classes defined based on dynamics and accessibility (Figure 2D) are associated with our previously identified dynamic promoter classes (Figure 1C). To assign each binding site to a target promoter, we chose a “closest-promoter” model where each TF binding site is assigned to its closest promoter region if the binding site is within 100kb of the promoter region. Using the “closest-promoter” model, we measured the enrichment or depletion of association between transcription factor binding and dynamic promoter classes. This analysis revealed: 1) Although Ngn2 and Isl1/Lhx3 early binding to inaccessible enhancers does not clearly associate with a specific promoter class, Ngn2 and Isl1/Lhx3 early binding to accessible regions is associated with downregulated genes in agreement with the chromatin behavior at those binding sites (Figure 3C); 2) Isl1/Lhx3 “constant” sites are enriched in the proximity of strongly upregulated P1 and P2 promoters and depleted from downregulated P6 and P7 classes (Figure 3C); 3) “Late only” Isl1/Lhx3 sites are enriched in P2 and P3 cluster promoters that are upregulated later during programming (Figure 3C) but are depleted from downregulated promoters (Figure 3C). Together, these results suggest that the early binding of the NIL factors to accessible regions is associated with transcriptional downregulation. On the other hand, Isl1/Lhx3 constant and late binding activates regulatory regions controlling the transcriptional cascade during programming (Figure 3C). Of note, the “closest-promoter” model enriches for correlation between promoter chromatin trajectories and their assigned enhancer trajectories better than a simpler method that assigns promoters to all binding sites within 500kb (Figure S3C and data not shown). Therefore, our data suggest a direct control of gene expression by the programming factors; NIL binding appears to regulate the local chromatin status at bound regulatory regions, and we see a surprising correlation between promoter and enhancer chromatin dynamics during motor neuron programming.
Secondary motif features suggest time-dependent interactions with cooperative TFs
The strong correlation of different classes of TF binding events with distinct chromatin and expression dynamics suggest that dissecting the mechanisms by which Isl1 and Lhx3 are recruited to their various regulatory regions during programming is required to understand the entire programming process. Enhancers are engaged by multiple transcription factors, and coordinated TF binding is often associated with enhancer activity during development and programming (Arnosti et al., 1996; Boyer et al., 2005; Mazzoni et al., 2013; Wapinski et al., 2013). Thus, to identify other transcription factors that could influence Isl1 and Lhx3 binding dynamics during programming, we searched for overrepresented DNA sequence motifs in each of the three Isl1/Lhx3 dynamic binding categories (see Methods).
“Constant” Isl1/Lhx3 sites are characterized by more frequent instances of the primary Isl1/Lhx3 homeodomain motif than “early only” and “late only” sites, suggesting that Isl1 and Lhx3 recognize sites that contain favorable binding sequences and remain bound to these sites throughout the programming process (Figure 4A and S4A). A fraction of “constant” binding sites are also enriched for the E-box motif variant that is associated with Ngn2 and other bHLH factors such as Neurod1, also activated during programming. Indeed, many of those E-box containing sites are bound by Ngn2 during early stages of programming (Figure S4B), demonstrating that DNA sequence motifs can point to cooperative TF interactions.
Figure 4. Distinct DNA motifs are associated with different Isl1/Lhx3 binding classes.

A) Heat map showing the relative frequencies of de novo motifs discovered at Isl1/Lhx3 dynamic binding classes. While “constant” sites are enriched for the canonical motif for the NIL factors, “early only” and “late only” sites are enriched for pluripotent TFs and Ebf and Onecut motifs, respectively. See Figure S4A for the raw motif frequencies. B) The heat map shows the average FPKM values of Zic5, Oct4 and distinct members of the Ebf and Onecut TF family scaled across time for each gene. C) Immunocytochemistry analysis shows that Ebf2 and Onecut2 are expressed after NIL TFs induction.
Interestingly, “early only” binding events have relatively less frequent instances of the primary Isl1/Lhx3 motif compared to “constant” sites. These “early only” sites are also enriched for motifs corresponding to the pluripotency factor Oct4 (Figure 4A and S4A), and are associated both with accessible chromatin (Figure 2D) and the binding of Oct4 at 0h (Figure S4C). Finally, “late only” binding sites also have less frequent instances of the Isl1/Lhx3 primary motif than “constant” sites. However, “late only” sites are enriched for motifs corresponding to Ebf and Onecut transcription factors (Figure 4A and S4A). Ebf and Onecut factors are not only expressed and required for embryonic motor neuron development but are also expressed during NIL-induced programming (Figure 4B-C) (Francius and Clotman, 2010; Garcia-Dominguez et al., 2003; Kratsios et al., 2011; Razy-Krajka et al., 2014; Roy et al., 2012; Stolfi et al., 2014). Thus, it is possible that regulatory genes induced during programming are required to recruit programming factors to a cohort of binding sites late in the programming process.
Synergistic interactions among programming and induced transcription factors underlie motor neuron programming
The expression, chromatin, and TF binding analysis during motor neuron programming suggest a programming transcriptional cascade where initially Ngn2 and Isl1/Lhx3 bind independently to the genome. In this model, Isl1/Lhx3 bind to accessible regions, presumably pluripotent regulatory elements, but then leave those sites as programming progresses. Isl1/Lhx3 additionally bind to inaccessible sites that contain frequent primary motifs from the earliest phases of programming. Isl1/Lhx3 subsequently gain access to additional inaccessible regulatory regions as programming progresses, possibly aided by Ebf and Onecut. We decided to test this model.
First, our model postulates that Isl1 and Lhx3 bind to unfavorable pluripotent chromatin regions without requiring Ngn2 to make those regions accessible. To test this hypothesis and confirm that we have not underestimated Ngn2 binding proximal to Isl1/Lhx3 sites, we expressed Isl1 and Lhx3 in the absence of Ngn2 (inducible Isl1-Lhx3 cell line, iIL) and also Ngn2 by itself (inducible Ngn2 cell line, iN). ChIP-seq for Ngn2 and Lhx3 revealed that neither Ngn2 nor Lhx3 binding is drastically affected in the absence of Isl1/Lhx3 or Ngn2 respectively (Figure 5A). Although they represent a minority of sites, there is a significant decrease in Ngn2 binding when expressed without Isl1 and Lhx3 in regions where all three factors co-bind: ~59% of Ngn2/Isl1/Lhx3 co-bound sites showed significantly reduced Ngn2 ChIP enrichment in the iN cell line (Figure 5A, S5A and S5C). On the other hand, Lhx3 binding was largely unaffected with only 8% of Ngn2/Isl1/Lhx3 co-bound sites showing reduced Lhx3 ChIP enrichment in the iIL cell line (Figure 5A, S5B and S5C). These results confirm that Ngn2 is not bookmarking enhancers for later Isl1/Lhx3 activation during motor neuron programming.
Figure 5. Early Isl1/Lhx3 binding is Ngn2-independent, while Ebf and Onecut TFs facilitate Isl1/Lhx3 binding to “late only” sites.

A) Isl1/Lhx3 do not depend on Ngn2 to bind to their sites. Heat map displays ChIP-seq binding sites at 12h for Lhx3 and Ngn2 in Isl1-Lhx3 (iIL), Ngn2-Isl1-Lhx3 (iNIL) and Ngn2 (iN) inducible cell lines. On average, only 2% of Lhx3 binding sites show differential ChIP enrichment when Lhx3 is induced with or without Ngn2; (Lhx3 only: n=13,459; Lhx3-Ngn2: n=2,056; Ngn2: n=11,019). B) (left) A large fraction of “late only” Isl1/Lhx3 sites overlap with Ebf2 and Onecut2 binding to regulatory regions. Heat maps show ChIP-seq binding sites for Lhx3 at 12h and 48h, and for Ebf2 and Onecut2 at 48h after NIL induction. Overlap at “early only”, “constant” and “late only” sites with Ebf2 and/or Onecut2 is 12%, 46% and 69%, respectively. (Right) Heat maps display ChIP-seq binding for Lhx3 in the inducible iIL, iIL-EO and NIL-EO cell lines. Lhx3 loses the ability to shift its binding sites from “early only” to “late only” sites in the absence of Onecut and Ebf TFs (iIL). However, “late only” Lhx3 binding is significantly rescued by the induced expression of Ebf2 and Onecut2 in the iIL-EO cell line. Moreover, when Ebf2 and Onecut2 are overexpressed (iNIL-EO), Lhx3 is able to bind earlier to the “late only” sites. C) Immunocytochemistry analysis shows that Ebf2 and Onecut2 are expressed in iN but not in iIL cell line, 48h after induction. Ebf2 and Onecut2 expression is already detected 24h after induction in the iIL-EO cell line. D) RT-qPCR analysis of Ebf and Onecut factor mRNA levels in iNIL and iIL 48h after TF induction. Data are mean +/− s.e.m. *** = P<0.001, ** = P<0.01, * = P<0.05, NS = not significant (t-test, gene expression at 48h compared to gene expression at 0h; n=3).
Second, the model postulates that members of the Ebf and Onecut family that are induced during programming should bind with Isl1 and Lhx3 to inaccessible sites and should be particularly enriched at “late only” sites. Accordingly, ChIP-seq analysis of Ebf2 and Onecut2 at 48 hours after NIL expression reveals that their binding is associated with Isl1 and Lhx3 binding during late programming states (Figure 5B). Ebf2 and/or Onecut2 bind to only 12% of “early only” Isl1/Lhx3 binding sites. In contrast, 69% of “late only” Isl1/Lhx3 binding sites co-occur with Ebf2 and/or Onecut2.
Third, the model postulates that in conditions where Ebf and Onecut genes are not expressed, Isl1 and Lhx3 will see their “late only” binding reduced even 48 hours after programming begins. While Hb9 and Slit2 genes are enriched for Ngn2/Isl1/Lhx3 co-binding and Isl1/Lhx3-only binding respectively (Figure S6 A-B), Ngn2 binding was highly enriched at Onecut2 and Ebf2 genes, with little or no Ngn2-independent Isl1/Lhx3 enrichment (Figure S6 C-D). Accordingly, Ngn2 but not Isl1+Lhx3 expression induced Ebf and Onecut TFs (Figure 5C-D). The lack of Ebf and Onecut expression in the iIL line (Figure 5C-D) provides a unique opportunity to test if the “late only” Isl1/Lhx3 sites are dependent on Ebf or Onecut. Lhx3 ChIP-seq experiments after inducing Isl1+Lhx3 alone revealed that Lhx3 is not only retained at a large number of sites that are “early only” in NIL induction, but also fails to bind most “late only” sites. Nearly 35% of the “early only” sites showed significantly higher Lhx3 ChIP enrichment in the absence of Ngn2 expression, while 70% of the “late only” sites showed significantly lower Lhx3 ChIP enrichment (Figure 5B, S5D and S5F).
Fourth, if the lost “late only” sites in the iIL line are only dependent on Ebf and Onecut TFs and not any other Ngn2-regulated activity, they should be regained in a cell line expressing Isl1+Lhx3 in combination with Ebf and Onecut TFs. To test this hypothesis, we constructed the iIL-EO cell line with inducible expression of Isl1, Lhx3, Ebf2 and Onecut2. Lhx3 ChIP-seq in the iIL-EO line demonstrates that Lhx3 binding is rescued at a minimum of 21% at “late only” sites that contain Ebf or Onecut even within 12h of induction. This is in sharp contrast to only 5% and 8% of “early only” and “constant” sites, respectively, showing increased enrichment in the iIL-EO cell line (Figure 5B, S5E and S5G). The rescued sites were consistently retained in the iIL-EO line at subsequent time-points. Lhx3 ChIP-seq at 24h, 36h and 48h in the iIL-EO cell line showed 24%, 39% and 31% of the sites being rescued, respectively (Figure 5B and S5G). Therefore, even the expression of only two from a total of seven Ebf and Onecut TFs is sufficient to rescue a significant fraction of “late only” sites.
Finally, if Ebf and Onecut expression is an important limiting factor for Isl1/Lhx3 to bind to “late only” sites, forced Ebf and Onecut expression during early stages of NIL programing should accelerate Lhx3 recruitment to “late only” sites. Indeed, the addition of Ebf2 and Onecut2 to the NIL factors (NIL-EO line) results in rapid Lhx3 recruitment to a 21% and 23% of “late only” sites at 12h and 24h respectively (Figure 5B, S5E and S5G). Together, these results demonstrate that a set of TFs activated during programming synergistically interact with the programming TFs to shift their binding to a subset of inactive enhancers, thereby enabling a late wave of gene expression that completes the motor neuron programming process (Figure 6).
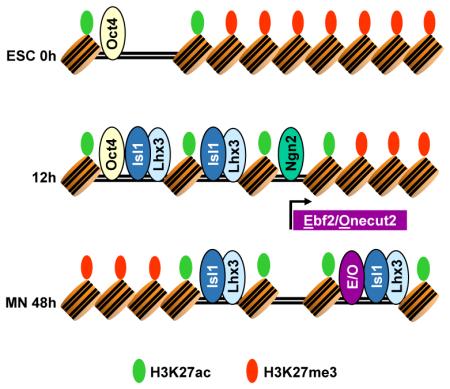
Figure 6. Feed forward regulatory cascade during motor neuron programming.

Proposed model. Programming motor neuron terminal fate does not consist of a single regulatory step; genes take different chromatin trajectories resulting in a rapid cascade of gene expression. Initially, Ngn2 and the Isl1/Lhx3 pair engage distinct regulatory regions. A fraction of Isl1 and Lhx3 binding sites shift during programming. The Ngn2-induced Ebf and Onecut TFs are required for Isl1 and Lhx3 to bind and regulate terminal motor neuron genes during later stages of programming.
DISCUSSION
By taking advantage of a uniquely efficient and homogeneous direct motor neuron programming system, we have characterized the chromatin state transitions in response to the dynamic TF behavior during a complete programming process. Although the programming process is quite rapid, multiple forms of evidence support a regulatory logic where initially parallel modules activated by Ngn2 and Isl1/Lhx3 converge with a feedforward transcriptional logic mediated by Ebf and Onecut TFs to complete the programming process (Figure 6). For instance: chromatin modifications at promoters and gene activation occurs with at least eleven different kinetic patterns; Ngn2 and Isl1/Lhx3 engage different sets of distal and proximal regulatory regions; and as programming progresses, Ngn2 induces Ebf and Onecut TFs that enable Isl1/Lhx3 binding to previously inaccessible sites, completing motor neuron programming.
Chromatin state transitions have been primarily studied in stepwise cellular differentiation (Tsankov et al., 2015; Wang et al., 2015; Ziller et al., 2015); how regulatory regions respond to direct programming that bypasses gradual commitment is not clear. We observed at least three distinct classes of strong gene activation (P1, P2 and P3), only one of which clearly starts in the well-characterized bivalent H3K4me3/H3K27me3 state (P1, Figure S1E). Bivalent promoters are thought to poise gene expression allowing for timely activation of developmental genes upon differentiation (Bernstein et al., 2006; Voigt et al., 2013). Although lineage specific bivalent promoters are rapidly activated, supporting their pre-activation state, our results indicate that this bivalent promoter state might not be a required prerequisite for subsequent activation of all promoters during programming (Denissov et al., 2014; Hu et al., 2013). We propose that the initial regulatory region chromatin state combined with the establishment and resolution of bivalent state at promoters during differentiation and programming might act to fine-tune the response kinetics of certain promoters relative to others.
In agreement with the idea that during stepwise differentiation, stage-specific TFs control chromatin state dynamics (Tsankov et al., 2015; Wang et al., 2015; Ziller et al., 2015), Isl1 and Lhx3 binding dynamics correlates with dynamics of accessibility and histone modifications marking active enhancers. We also observed a clear distinction in enhancer activity time-course profiles between NIL binding to sites accessible at 0h before NIL expression and NIL binding to 0h inaccessible regions. While the former show a decrease in activity during differentiation, the latter show a marked increase in activity. The early binding to accessible regions that is lost during differentiation could be inconsequential and explained by Isl1 and Lhx3 initially binding opportunistically to some accessible sites with relatively infrequent primary motifs.
The analysis of the NIL factors revealed a complex dynamic binding behavior highlighting the necessity of considering two different aspects of programming TF combinations. The first one is the synergy among expressed TFs at initial stages of programming. Similarly to Ascl1, Ngn2 binds to sites with a strong E-box motif and does so independently of any other programming factor we have profiled. On the other hand, it is becoming clear that Isl1 cooperates at regulatory regions with other factors such as Lhx3, Lhx8 and Phox2a to achieve cell specific gene expression (Bhati et al., 2008; Cho et al., 2014; Lee et al., 2012; Lee and Pfaff, 2003; Mazzoni et al., 2013; Thaler et al., 2002). Although it is important to note that these two programs will integrate at some specific enhancers (Castro et al., 2006; German et al., 1992; Lee and Pfaff, 2003; Wapinski et al., 2013), our results suggest a regulatory paradigm where the neurogenic activity and cell specific network behave mostly independently, as evidenced by the independent binding of Ngn2 and Isl1/Lhx3.
The second aspect of programming TF combinations that should be considered concerns the activity of TFs that are expressed during or after programming begins. Intuitively, as direct programming TFs are often chosen based on their importance in the regulation of the target cell type, it is expected that they activate terminal cell fate by directly and specifically binding to cell specific regulatory regions. However, and as mentioned earlier, the few previous studies came to different conclusions about how this process occurs: the multi-stage model seen during pluripotency reprogramming versus the “on-target pioneer” model seen in direct neuronal programming. The efficiency of the NIL programming system and the high temporal resolution of this study reveals aspects of both models during motor neuron programming. Isl1/Lhx3 constant sites are characterized by a more frequent homeodomain DNA motif and were not largely pre-accessible. These observations suggest that constant sites are high affinity sites where Isl1 and Lhx3 bind even when the regulatory regions are not completely accessible or active and are bound stably during programming.
As programming progresses, Isl1 and Lhx3 gain access to previously inaccessible sites with weaker motifs than those seen in “constant sites”. Our data suggest that TFs expressed during programming, Ebf and Onecut, make sites accessible for later Isl1 and Lhx3 binding. Thus, Ebf and Onecut factors induced during programming play an important role in shaping programming TF binding. Programming TF binding to terminal genes is therefore influenced by the complement of additional regulators that they induce.
The activity of Ebf and Onecut TFs to complete programming has strong implications for the rational design of efficient programming strategies. These factors might be considered terminal selectors and play important roles during motor neuron differentiation (Audouard et al., 2012; Francius and Clotman, 2010; Roy et al., 2012). The synergistic power of these induced TFs should be considered in efforts to identify roadblocks during transdifferentiation. For example, Hb9 is a downstream target of the NIL factors, but necessary for motor neuron programming from fibroblasts even when the NIL factors are expressed (Son et al., 2011). Therefore, in cases where chromatin inaccessibility prevents the expression of a few crucial TFs, their inclusion in the TF programming combination might increase programming efficiency and precision for clinical applications.
STAR METHODS
CONTACT FOR REAGENT AND RESOURCE SHARING
Further information and requests for reagents may be directed to, and will be fulfilled by the corresponding author, Esteban O Mazzoni (eom204@nyu.edu).
EXPERIMENTAL MODEL
Cell lines
The inducible ESC lines were generated using the inducible cassette exchange (ICE) system (Iacovino et al., 2011). The resulting transgenic lines harbor a single copy of the transgene recombined into a defined expression-competent locus. NIL (Ngn2-Isl1-Lhx3) inducible ESC line was previously generated (Mazzoni et al., 2013) (Mazzoni et al., 2011). To generate the p2lox-IL plasmid, Isl1-Lhx3 open reading frames were amplified from p2Lox-NIL and inserted into the p2Lox-V5 plasmid (Mazzoni et al., 2011). Thus, Lhx3 coding sequence is V5-tagged at the C-terminus in both NIL and IL inducible cell lines. The p2lox-IL-EO and p2lox-NIL-EO plasmids were obtained by cloning Ebf2 and Onecut2 open reading frames under control of a second inducible tetracycline response element (TRE), into the p2lox-IL or p2lox-NIL plasmid, respectively. In this way, in the IL-EO and NIL-EO cell lines, IL and NIL expression is under control of a first TRE whereas Ebf2 and Onecut2 expression is regulated through a second TRE. 2A peptides were used to separate Ngn2-Isl1-Lhx3, Isl1-Lhx3 and Ebf2-Onecut2 in the NIL, IL and NIL/IL-EO inducible lines, respectively. The p2lox-N plasmid was obtained by cloning the Ngn2 open reading frame into a p2lox-Flag plasmid (Mazzoni et al., 2011). Phusion polymerase (New England Biolabs) was used to minimize the introduction of mutations during PCR amplification. The inducible cell lines (iIL, iIL-EO, iNIL-EO and iN) were generated by treating the recipient ESCs for 16 h with 1 μg/ml Dox to induce Cre followed by electroporation of the respective plasmids (p2lox-IL, p2lox-IL-EO, p2lox-NIL-EO and p2lox-N). After G418 selection (250ng/ml, Cellgro), cell lines were characterized by performing antibody staining (Hb9, Isl1/2, Chat, Vacht, Tubb3) and expanded.
All the inducible ESC lines were grown in 2-inhibitors medium (Advanced DMEM/F12:Neurobasal (1:1) Medium (Gibco), supplemented with 2.5% ESC-grade fetal bovine serum (vol/vol, Corning), N2 (Gibco), B27 (Gibco), 2mM L-glutamine (Gibco), 0.1 mM β-mercaptoethanol (Gibco), 1000 U/ml leukemia inhibitory factor (Millipore), 3μM CHIR (BioVision) and 1 μM PD0325901 (Sigma). To obtain embryoid bodies (EBs) ESC were trypsinized (Gibco) and seeded in AK medium (Advanced DMEM/F12:Neurobasal (1:1) Medium, 10% Knockout SR (vol/vol) (Gibco), Pen/Strep (Gibco), 2mM L-glutamine and 0.1 mM 2-mercaptoethanol) (day -2). After 2 days, EBs were passed 1:2 and the inducible cassette was induced by adding 3 μg/ml of Doxycycline (Sigma) to the culture medium (EBs 0h). For gene and protein expression analysis 3 × 10⁵ cells were plated in each 100 mm dish. For ChIP experiments, the same conditions were used, but scaled to seed 3 × 10⁶ cells in each square dish (245mm × 245mm).
METHOD DETAILS
Immunocytochemistry
Embryoid bodies were fixed with 4% paraformaldehyde (vol/vol) in phosphate-buffered saline, embedded in OCT (Tissue-Tek) and sectioned for staining: 24 h at 4 °C for primary antibodies and 4 h at 20–25 °C for secondary antibodies. After staining, samples were mounted with Fluoroshield with DAPI (Sigma). Images were acquired with a SP5 Leica confocal microscope. We used antibodies to V5 (R960-25, Thermo Fisher Scientific; 1:5000), Oct3/4 (Sc-5279, Santa Cruz; 2μg/ml), Ki67 (Ab15580, Abcam; 1:5000), β3-Tubulin (T2200, Sigma; 1:5000), Hb9 (81.5C10, DSHB; 1:1000), Ebf2 (AF7006, R&D Systems; 1μg/ml) and Onecut2 (AF6294, R&D Systems; 2μg/ml). Alexa 488 (A-11029, A-11015), Alexa 568 (A-11036) secondary antibodies were used (Thermo Fisher Scientific, 1:2000).
Quantitative PCR
RNA was extracted using Qiagen RNAeasy kit following manufacturer’s instructions. For quantitative PCR analysis, cDNA was synthesized using SuperScript III (Invitrogen), amplified using Maxima SYBR green brilliant PCR amplification kit (Thermo Scientific) and quantified using a CFX 96 Touch Biorad qPCR thermocycler (Biorad). One independent differentiation was considered to be a biological replicate (n=1). See Supplemental table S3 for sequences of primers used in real-time RT-PCR analysis.
RNA-Seq
For single cell RNA-seq analysis, cells were collected at different time points after NIL induction. Differentiating embryoid bodies were washed with phosphate-buffered saline and then dissociated by mild trypsinization followed by mechanical dissociation into single cell suspension. Viable cells were labeled by incubating with 1 μM Fluorescein diacetate (Sigma) at 37°C for 10 minutes. Single cells were FACS-sorted into 96-well plates containing 10 μl of 1% β-mercaptoethanol in TCL buffer (Qiagen). Once sorting was completed, plates were sealed, centrifuged 1 min at 800 g at RT and immediately frozen on dry ice. Plates were kept at −80°C until lysate cleanup and reverse transcription of mRNA. Single cell libraries were prepared in two overall batches using a custom version of the SMART-Seq2 protocol (Picelli et al., 2013) (Satija et al., 2015), without the use of Random Molecular Tags. Cells were sequenced with 50bp single end reads on a HiSeq 2500 at an average sequencing depth of 325,000 reads per cell.
For bulk cell RNA-seq analysis, cells were collected at different time points after NIL induction and RNA isolated using TRIzol LS (Life Technologies) followed by purification using Qiagen RNAeasy kit. RNA-Seq libraries were prepared using Illumina TruSeq RNA library preparation kit v2. Fifty base pair single-end sequencing was performed using Illumina HiSeq-2500 at the NYU Genome Core facility.
ChIP-Seq
Cells were collected at different time points after NIL induction and fixed with 1 mM DSG (ProteoChem) followed by 1% formaldehyde (vol/vol) for 15 min at 20–25°C. Pellets containing ~25 × 106 cells were stored at −80 °C. Cells were thawed on ice, resuspended in 5 ml of Lysis Buffer A (50 mM Hepes-KOH pH 7.5, 140 mM NaCl, 1 mM EDTA, 10% glycerol (vol/vol), 0.5% Igepal (vol/vol), 0.25% Triton X-100 (vol/vol)) and incubated for 10 min at 4°C in a rotating platform. Samples were spun down for 5 min at 1,350 g, resuspended in 5 ml Lysis Buffer B (10 mM Tris-HCl pH 8.0, 200 mM NaCl, 1 mM EDTA pH 8.0, 0.5 mM EGTA pH 8.0) and incubated for 10 min at 4 °C in a rotating platform. Samples were spun down for 5 min at 1,350 g, resuspended in 3 ml of Sonication Buffer (50 mM Hepes pH 7.5, 140 mM NaCl, 1 mM EDTA, 1 mM EGTA, 1% Triton X-100, 0.1% sodium deoxycholate (wt/vol), 0.1% SDS (wt/vol)). Nuclear extracts were sonicated on ice using a Branson 450 Sonifier (20% power amplitude; 18 cycles × 30 seconds pulses with 1 minute interval between each pulse) to sheer cross-linked DNA to an average fragment size of approximately 500 bp. Sonicated chromatin was incubated for 16 h at 4 °C with Dynabeads protein-G (Thermo Fisher Scientific) conjugated with either rabbit polyclonal antibody to V5 (ab15828, Abcam) to immunoprecipitate Lhx3 or a combination of monoclonal antibodies (40.3A4, 39.3F7 and 40.2D6, DSHB) for Isl1. Ngn2 was immunoprecipitated by using a goat polyclonal antibody (sc-19233, Santa Cruz), whereas to immunoprecipitate Oct4 (sc-5279, Santa Cruz), Ebf2 and Onecut2, a rabbit polyclonal antibody (ab156999, Abcam) and a sheep polyclonal antibody (AF6294, R&D Systems) were used, respectively. For histone modifications the following rabbit polyclonal antibodies were used: ab8895 (Abcam) for H3K4me1, ab7766 (Abcam) for H3K4me2, 39159 (Active Motif) for H3K4me3, ab4729 (Abcam) for H3K27ac and 39155 (Active Motif) for H3K27me3. After incubation, and with the aid of a magnetic device, beads were washed once with Sonication Buffer, than with Sonication buffer and 500 nM NaCl and once with LiCl Wash Buffer (20 mM Tris-HCl (pH 8.0), 1 mM EDTA, 250 mM LiCl, 0.5% NP-40, 0.5% sodium deoxycholate) and 1 ml of TE (10 mM Tris, 1 mM EDTA, pH 8). Then, beads were centrifuged at 950 g for 3 min and the residual TE removed with a pipette. 210 μl of Elution Buffer (50 mM Tris-HCl (pH 8.0), 10 mM EDTA (pH 8.0), 1% SDS) was added to the beads followed by incubation at 65°C for 45 min with a brief pulse of vortex every 10 min. 200 μl of supernatant was removed after a 1 min centrifugation at 16,000 g. The crosslink was reversed by 16 h incubation at 65°C. RNA was digested by the addition of 200 μl of TE and RNAse A (Sigma) at a final concentration of 0.2 mg/ml and incubated for 2 h at 37°C. Protein was digested by the addition of Proteinase K (Invitrogen) at a final concentration of 0.2 mg/ml, supplemented with CaCl2 followed by a 30-min incubation at 55°C. DNA was extracted with phenol:chloroform:isoamyl alcohol (25:24:1; vol/vol) (Invitrogen) and then recovered with an ethanol precipitation with glycogens as carrier. The pellets were suspended in 70 μl of water.
One third (24ul) of ChIP DNA was used to prepare lllumina DNA sequencing libraries. Briefly, after end repair and A-tailing, Illumina-compatible Bioo Scientific multiplexed adapters were ligated and the unligated adapters removed through purification using Agencourt AmpureXP beads (Beckman Coulter). Adapter-ligated DNA was amplified by PCR using TruSeq primers, both from Sigma. DNA libraries between 300 and 500 bp in size were gel purified. KAPA SYBR FAST Roche LightCycler 480 2X qPCR Master Mix (Kapa Biosystems) was used in 20 μl reactions that were analyzed in a Roche LightCycler. Fifty base pair single-end sequencing was performed using Illumina HiSeq-2500 at the NYU Genome Core facility.
ATAC-seq
50,000 cells were harvested and washed in ice-cold PBS buffer. After centrifugation the supernatant was aspirated and the cell pellet was resuspended in a master mix of 22.5 μl RNase-free water, 25 μl TD buffer and 2.5 μl TDE1 (transposase enzyme, both Illumina Nextera DNA Library Prep kit), followed by incubation for 60 minutes at 37oC. The reaction was then cleaned using the DNA Clean and Concentrator-5 kit (Zymo Research). The optimal number of PCR cycles was determined to be Ct+4. qPCR reactions were performed using 10% of a master mix of sample, forward and reverse (barcode) primers, 1X SYBR Green I (Biozym) and 1X NEBNext PCR MasterMix (New England Biolabs). Following PCR amplification, the library was cleaned using the DNA Clean and Concentrator-5 kit and eluted in 15 μl 10 mM Tris-Cl pH 8.0. Sample was quantified using Qubit (Life Technologies) measurement and the fragment length distribution was determined using the Bioanalyzer DNA High Sensitivity assay (Agilent). Sequencing was performed on an Illumina NextSeq 500 using V2 chemistry for 150 cycles (paired-end 75nt).
QUANTIFICATION AND STATISTICAL ANALYSIS
SINGLE CELL RNA-SEQ ANALYSIS
Single cell data processing and filtration
We quantified gene expression (transcripts per million) in each library as previously described (Shalek et al., 2013). Briefly, we aligned reads to a Bowtie (Langmead et al., 2009) index based on the UCSC knownGene annotations for mm9, and quantified expression values per cell using RSEM 1.2.21 (Li and Dewey, 2011). We filtered out low quality cells where we detected less than 2,000 unique genes, which typically had poor transcriptomics alignment rates (<30%, as compared to 65% for successful cells).
We first ran a principal component analysis (PCA) using all detected genes again using a similar approach to Shalek et al. (2013), and saw that the first component perfectly separated the two experimental batches, a trend that has been widely observed in single cell RNA-seq experiments (Hicks et al., 2015). We therefore subtracted the first PC from the data in order to remove this batch effect. We obtained similar results using alternative batch effect correction methods, such as COMBAT (Leek et al., 2012), or obtaining regression residuals.
Calculating developmental trajectories and ‘pseudotime’
As trajectory analysis is sensitive to gene input list, we first sought to identify a set of genes whose expression changes with biological time (the time point during the differentiation series when the cells were collected). We used a strategy similar to (Trapnell et al., 2014), aiming to identify genes whose variance in expression level could be explain by biological time. We therefore constructed a linear model for each gene as a function of its biological time. We identified 458 genes where the linear model explained a significant (p<1e-5 after Bonferroni correction) of the variance in gene expression.
We next used these 458 genes as input to a diffusion map (Haghverdi et al., 2015), a non-linear dimensional reduction technique that has been shown to be well-suited to reconstructing developmental trajectories for single cell data (Haghverdi et al., 2015). We noted a significant eigenvalue dropoff after the second diffusion map coordinate, and observed that the cells traced a path across the first two dimension map coordinates that was well-correlated with the experimental timepoint. We therefore assigned each cell a ‘pseudotime’ value, reflecting its progression through the differentiation process, by projecting a principal curve (Hastie and Stuetzle, 1989) through the first two diffusion map dimensions using the princurve package in R.
RNA-SEQ, ATAC-SEQ and ChIP-SEQ ANALYSIS
Aligning and preprocessing data sets
Expression was quantified from RNA-seq using the Gencode (Mudge and Harrow, 2015) mm10 transcriptome (vM3) and RSEM v1.2.7 (parameters: --output-genome-bam –forward-prob=0 − calc-ci) (Li and Dewey, 2011). RSEM was set to use bowtie v1.0.0 for read alignments (Langmead et al., 2009). The geometric average of RSEM’s expected FPKM across the biological replicates was used for all further analysis.
After transposase adapter trimming using Flexbar v2.4 (parameters: -f i1.8 -u 10 -ae RIGHT -at 1.0, (Dodt et al., 2012), ATAC-Seq fastq files were aligned to mm10 genome build using bowtie2 (Langmead and Salzberg, 2012) in paired-end mode (parameters: -X 2000 --no-mixed –no-overhang). Potential PCR duplicates were removed using samtools v1.3 rmdup (Li and Dewey, 2011). Resulting BAM files were converted to single-end BED files using bedtools v2.17.0 bamtobed (Quinlan and Hall, 2010). Replicates from the same time-point were concatenated for all further analysis.
All histone modification ChIP-Seq fastq files were aligned to mm10 genome build using bowtie2 v2.1.0 (Langmead and Salzberg, 2012) with default parameters. After filtering for uniquely-aligned reads that had 2 or less mismatches, potential PCR duplicates were removed using samtools rmdup (parameters: -s) (Li et al., 2009). Resulting BAM files were converted to BED format using bedtools bamtobed command when necessary (Quinlan and Hall, 2010). For H3K4me1, replicates files were concatenated for all further analysis. JAMM was used to obtain the average fragment length for each experiment (Ibrahim et al., 2015). All transcription factor ChIP-Seq fastq files were aligned to mouse genome (version mm10) using Bowtie (1.0.1) (Langmead et al., 2009) with options “-q --best --strata -m 1 --chunkmbs 1024”. Only uniquely mapped reads were considered for further analysis.
Promoter time-course chromatin state clustering
Promoter regions were defined as −200bp to +2000bp at all annotated Gencode mm10 TSSs (vM3) (Mudge and Harrow, 2015). All overlapping promoter regions were merged regardless of strand to obtain unique non-overlapping promoter regions. JAMM’s SignalGenerator v1.0.7rev2 (Ibrahim et al., 2015) script was used to generate depth-normalized, background-subtracted bedGraph files at promoter regions for H3K4me3, H3K27ac and H3K27me3 at 1bp resolution (parameters: -n depth -b 1). The average signal for each histone modification at each promoter region was obtained from those bedGraph files using bedOps v2.3.0 bedmap command (parameters: –mean) (Neph et al., 2012).
ChIP-Seq experiments across multiple time-points are affected by global confounders related to changes in the number of sites at each time-point, which is not accounted for via simple depth normalization. To remedy this issue, each histone modification is quantile normalized across all time points using normalizeQuantile command from the limma v3.18.13 R package with default parameters (Ritchie et al., 2015). All promoter regions that have lower than background levels for all clustered histone modifications at all time-points are removed from further analysis. Background for each histone modification is defined as the arithmetic mean of its signal across all time-points and all promoter regions. This yields 22302 promoter regions. The log2 fold-change between each two consecutive time-points for each histone modification at each promoter region is calculated after adding a pseudocount of 1 to all values.
To obtain combinatorial time-course clusters of promoter regions based on multiple histone modification datasets across multiple time points, we designed a Bayesian Network (BN) (Pearl, 1988) model with a conditional Gaussian probability distribution (Figure S3) (Lauritzen and Wermuth, 1989). The model features one discrete unobserved class variable upon which all continuous univariate Gaussian observed variables are conditioned. The discrete unobserved variable represents the cluster that defines a certain chromatin state trajectory, while the continuous observed variables represent the consecutive log2 fold-changes in ChIP-seq signal between the consecutive time points. This gives a structure similar to a Naïve Bayes model in terms of independence between different chromatin marks, but we allow for dependencies between the observed variables representing a histone modification at different time points as long as the acyclicity condition of BNs is satisfied (Friedman et al., 1997). Although any tree topology is possible to represent differentiation time course data, for NIL differentiation, we opted to model the chromatin trajectory as a simple linear chain without any branches as predicted via our single-cell RNA-seq analysis (Figure 1b).
Each histone modification is modeled via its own tree, meaning that each histone modification is independent of all other histone modifications given the discrete class variable (Figure S3). Each univariate Gaussian node is modeled via a linear regression of its corresponding univariate Gaussian parent. Since any continuous node will also be conditioned on the unobserved discrete class node, a different set of regression parameters is defined separately for each value of the discrete parent (ie. each cluster defines a different chromatin state trajectory). The model can be summarized as follows:
| (1) |
Where denotes the class discrete variable with space {i = 1,… ,I} and denotes a univariate Gaussian distribution where {t = 1,…, T} are the T time-points modelled (in this case 3) and {j = 1,…, J} are J histone modifications (in this case 3, H3K4me3, H3K27ac and H3K27me3). The conditional Gaussian distribution ℒ of any is given by
| (2) |
Where α(ci) and β(ci) are positive real numbers and is the standard deviation of . This model has the advantages of sparsity and of avoiding large covariance matrices which pose problems for model fitting. It is also seamlessly extended to as many histone modification data sets as necessary, potentially even if the time-points assayed do not match, as well as any data type that can be represented in the same manner described above (for example, RNA-seq, transcription factor ChIP-seq, DNase-seq, ATAC-seq…etc.). Furthermore, although this was not needed for NIL-induced differentiation, the model is flexible to allow potentially complex structures representing lineage relationships between the different cell types at the different time points. Compared to GATE (Yu et al., 2013), a program for time-course chromatin state discovery, the model presented here is a more general exploratory model that can potentially combine different arbitrary datasets and has the distinct advantage of not restricting chromatin trajectories to vary only between two states (active / inactive) over time as is the case with GATE. In our case, there is no restriction on the complexity of the chromatin state trajectory or the cell stage lineage tree.
To learn point estimates of the parameters of the Bayesian Network model, we use the Expectation-Maximization algorithm for Bayesian Networks implemented in the MATLAB Bayesian Network Toolbox (BNT) (Murphy, 2001). The EM algorithm is initialized via MATLAB’s kmeans command (parameters: distance, cityBlock – Replicates, 15 – MaxIter 300). The junction-tree inference engine implemented in the BNT toolbox is used to assign each promoter region a probability of belonging to each of the learned clusters of chromatin trajectories. Each promoter region is assigned to the cluster with the highest probability. To determine the number of clusters, we performed 10-fold cross validation and examined the change in the likelihood of the model as the number of clusters increases (Figure S4). Although we did not find evidence of overfitting for the range examined, cluster numbers higher than 11 improve the model likelihood only modestly. We chose 11 clusters as a good balance between ease of interpretation and the fit of the model to the data. To determine the final clustering of our data, we trained our model on all promoter regions available for clustering, then assigned each promoter region to the cluster with the highest probability.
Figure 1C shows the quantile-normalized ChIP-Seq values (see above), after linearly scaling the values to ensure histone modifications are comparable, averaged over all promoter regions that belong to a given cluster. Scripts used for preprocessing, clustering and plotting are available at: https://github.com/mahmoudibrahim/timeless
The corresponding RNA-Seq FPKM plots are made using the default R boxplot function on the logarithm of RSEM FPKM values after adding a pseudo-count of 1. Outliers are not displayed. Genes that have multiple promoter regions (due to alternative promoters or alternative transcripts) assigned to different promoter chromatin clusters were excluded from the RNA-Seq plots and from Gene Ontology (GO) (Gene Ontology, 2015) analysis. The corresponding gene expression heat maps (Fig1E) are made on the same FPKM values after centering the expression of each gene at zero, by subtracting the mean across time for each gene from each time-point of that gene.
GO (Ashburner et al., 2000) (Gene Ontology, 2015) enrichment was performed using the pantherdb.org website on 24 March 2016 (Mi et al., 2016), using gene symbols, the default background gene set and GO Biological Process Complete. Results were filtered for GO terms that had more than 100 or less than 2000 genes in the background reference set and a p-value that is less than 0.01. Taking only enrichment results into account, terms were sorted by their enrichment score and the top 4 terms were reported for each promoter cluster in Table S1. Enrichment score is defined as -log10(p)*F, where F is the fold-enrichment reported by Panther (Mi et al., 2016).
Reactome (Croft et al., 2014; Milacic et al., 2012) pathway analysis was done using the Enrichr website on 10 April 2016 (Chen and Arlotta, 2016), and the top two pathways for each promoter cluster were reported in Table S1. Enrichment score reported is the one provided by Enrichr.
Defining 0h Bivalent Promoters
Bivalent promoter regions at 0h were defined as those that intersect H3K4me3 peaks at 0h and had H3K27me3 level at 0h higher than H3K27ac level at 0h. Peaks were called using JAMM v1.0.7rev2.
Defining dynamic Isl1/Lhx3 binding classes
Isl1 and Lhx3 binding sites were profiled using MultiGPS (Mahony et al., 2014), which enables the identification of differentially-enriched TF binding sites across multiple conditions. Our initial analysis showed that Isl1 and Lhx3 mostly bind to the same sets of regions genome-wide with similar ChIP enrichment. Hence we treated Isl1 and Lhx3 datasets at each time-point as different conditions in a single MultiGPS run. The discovered binding events were required to have a significant ChIP enrichment over input samples (q-value < 0.001) as assessed using binomial tests. For exploring the binding dynamics of Isl1 and Lhx3, we carefully curated 3 distinct dynamic Isl1/Lhx3 binding classes. Isl1 and Lhx3 binding sites at the 12hr time point, which were not called at the 48hr time-point, were placed into the “early-only” binding class. In addition, “early only” binding sites were further required to have significantly higher ChIP enrichment (q-value < 0.05) at the 12hr time-point when compared to the 48hr time-point for either Isl1 or Lhx3. Constant Isl1/Lhx3 sites were required to be called at the 12hr and 48hr time-points for both Isl1 and Lhx3. Further, sites showing significantly different ChIP enrichment (q-value < 0.01) between the 12hr and 48hr time-points in either Isl1 or Lhx3 were removed from the “constant” binding class. Isl1 and Lhx3 binding sites at the 48hr time point, which were not called at the 12hr time-point, were placed in the “late only” binding class. In addition, “late only” binding sites were required to have significantly higher ChIP enrichment (q-value < 0.05) at the 48hr time-point compared to the 12hr time-point for either Isl1 or Lhx3.
Lhx3 and Ngn2 binding across different inducible cell-lines (iNIL, iIL, iN, iIL.OE) was also compared using MultiGPS. All the differential binding sites were defined using a MultiGPS q-value cutoff of 0.05. For visualization box-plots of fold-changes of ChIP enrichment were displayed using R’s boxplot function.
Binding overlaps across transcription factors
Binding sites for Ngn2, Onecut2, and Ebf2 were identified using MultiGPS (Mahony et al., 2014) with different runs for each transcription factor. Binding events were required to have a significant ChIP enrichment over the input samples based on a binomial test (q-value < 0.001). For binding sites overlap analysis for Onecut2 and Ebf2, we only considered the top 50,000 binding sites (to account for ~10 fold more binding sites discovered in these datasets compared to Isl1/Lhx3 and Ngn2). To compare binding sites of Isl1/Lhx3 with other TFs we implemented a simple peak matching procedure, which matches peaks if their midpoints lie within 200bp of each other. In cases when there was more than one matching pair, we picked the one that had the smallest distance between the matching peaks.
Transcription Factor Accessibility Stratification
ATAC-seq histograms (Figure 2D) were made by counting the transposase cut site locations (the 5’ ends of all ATAC-Seq reads) that fall within 100bp of the transcription factor binding site.
To stratify transcription factor binding sites as 0h accessible or 0h inaccessible, the cut site counts for all stratified binding sites were log transformed and clustered using Gaussian mixture modeling into two clusters using the R package mclust with default parameters (Fraley et al., 2012). Alternatively, peaks were called on ATAC-seq using JAMMv1.0.7rev2 (parameters: -e auto -f 1 -b100) (Ibrahim et al., 2015) and transcription factor binding sites were extended by 100bp in each direction before intersecting them with the ATAC-Seq peaks using bedtools intersect command (Quinlan and Hall, 2010).
Single base pair binding sites were used for assigning transcription factor distance to Gencode’s annotated TSSs (vM3) (Mudge and Harrow, 2015). Distal Ngn2 binding sites are those that are more than 10kb away from the nearest annotated TSS. Proximal Ngn2 binding sites are those that are less than 1kb away from the nearest TSS.
TF Binding Site / Promoter Assignment and Correlation
Each transcription factor binding site was assigned to its closest promoter region, requiring that the distance is 100kb or less. This generates a matrix of transcription factor binding site / promoter regions association frequencies, expressing a one-to-many relationship of promoter regions-to-transcription factor binding sites. To obtain a suitable null model , the association frequency matrix was randomized 100,000 times but requiring that row sums and column sums remain the same, using the function permatfull in the R package vegan v2.3-2 (parameters: fixedmar=both burnin=1000 time=100000) (Dixon, 2003). Values plotted in Figure 3C are the log2 fold-change values of the observed association frequency matrix to the averaged randomized matrix. Values higher/lower than zero indicate enrichment/depletion of association compared to the randomized matrix.
Promoter-Enhancer correlation analysis was done using Pearson correlation coefficient. For binding sites, H3K27ac quantile-normalized values (see above) were used. For promoter regions, H3K4me3 quantile-normalized values were used. Promoter-enhancer assignment based on correlations was done using the same correlation set assigning an enhancer to a promoter if their correlation coefficient is higher than 0.8 and they were within 500kb of each other.
Motif analysis at dynamic Isl1/Lhx3 binding classes
Epigram (version 0.003) (Whitaker et al., 2015) was used to identify de novo motifs in a 150bp window around Isl1/Lhx3 dynamic binding classes. An in-house script was used to calculate the frequencies of the identified motifs at Isl1/Lhx3 binding classes. Log-odds motif scoring thresholds that yield false positive rates of 0.05 were calculated using random sequences generated from a 3rd-order Markov model based on mouse nucleotide frequencies (mm10 version). De novo discovered motifs present at a frequency of 10% or greater in at least one of the Isl1/Lhx3 binding classes were considered for further analysis. All the identified de novo motifs were matched to CIS-BP (version 1.02) (Weirauch et al., 2014). These matches were further filtered based on whether the transcription factors associated with the matched motifs were expressed in the NIL programming time course. Motif frequencies were used to plot the heatmap in Figure 4A. The heatmap.2 function in the gplots R package was used to make the heatmap (Warnes et al., 2016). The columns in the heatmap were scaled to aid visualization of motif differential enrichment at different dynamic classes.
GO Term enrichment at TF binding sites
GREAT (version 3.0.0) (McLean et al., 2010) was used to find enriched GO-Terms at Ngn2 and Lhx3/Isl1 binding sites (table S2). “Single nearest gene” option with distance of 1000kb was used to run GREAT.
VISUALIZATION AND PLOTTING
Cumulative plots for histone modification: To generate average plots for histone modification data, ChIP-Seq replicate experiments were concatenated and converted to bigwig files using deepTools bamCoverage at 10bp resolution (parameters: --normalizeUsingRPKM (Ramirez et al., 2014)), using the average fragment length predicted by JAMM (Ibrahim et al., 2015). bedGraph files generated by JAMM were used for ATAC-seq. deepTools computeMatrix (Ramirez et al., 2014) was then used to generate the counts at the regions of interest. ChIP-Seq input was subtracted from the ChIP-Seq data at each binding site and each position and values lower than zero were considered zero. The arithmetic mean at each position is then plotted in R, after quantile normalizing the values for each dataset at each position across time using normalize Quantiles limma R command with default parameters (see above) (Ritchie et al., 2015). Finally, the arithmetic mean at each position is then plotted in R. All heat maps were plotted using the heatmap.2 function in the gplots R package.
Transcription factor binding site heatmaps: To visualize TF binding sites, we used in house code to generate heatmaps. Briefly, each row in a heatmap represents a 1000bp window centered on the midpoint of a TF binding site. Reads were extended to 100bp and overlapping read counts are binned into 10bp bins. Color shading between white and a maximum color are used to represent depth of read coverage in each heatmap. We used a systematic approach to choose the read depth represented by the maximum color for each tracks. We first calculated the read counts in 10bp bins at all identified binding sites for the given transcription factor and then used the 95th percentile value as the maximum value for the color pallet. The following are the read depths represented by the maximum color for different heatmaps (Lhx3 12h NIL: 54, Lhx3 24h NIL: 90, Lhx3 48hr NIL: 34, Ngn2 12h NIL: 98, Lhx3 12h IL: 15, Lhx3 48h IL: 25, Ngn2 12h N: 144, Onecut2 48h NIL: 94, Ebf2 48h NIL: 117, Oct4 0h NIL: 51, Lhx3 12h ILEO: 30, Lhx3 24h ILEO: 35, Lhx3 36h ILEO: 25, Lhx3 48h ILEO 12, Lhx3 12h iNILEO: 59, Lhx3 24h iNILEO: 37).
Browser snapshots: An in house script was used to generate the browser shots. Reads from both the strands were merged and extended to 100bp. The colors of the tracks were matched to the colors of the TF heat maps.
DATA AND SOFTWARE AVAILABILITY
Data Resources
All the sequencing data generated in this paper have been deposited in NCBI GEO and are publically available through the following link: http://www.ncbi.nlm.nih.gov/geo/query/acc.cgi?token=qdofoommthirpmj&acc=GSE80483
Software Resources
The Conditional Gaussian Bayesian Network (BN) model for promoter clustering is available at: (https://github.com/mahmoudibrahim/timeless)
ADDITIONAL RESOURCES
The Gencode annotated mm10 TSSs (vM3) can be found at: https://genome.ucsc.edu/cgi-bin/hgTrackUi?db=mm10&g=wgEncodeGencodeVM3 The mouse reference genome mm10 is deposited at: https://genome.ucsc.edu/ For GO enrichment, the Panther website was used: http://www.pantherdb.org/
For Reactome, Enrichr website was used: http://amp.pharm.mssm.edu/Enrichr/
All the identified de novo motifs were matched to CIS-BP (version 1.02): http://cisbp.ccbr.utoronto.ca/
Supplementary Material
HIGHLIGHTS.
ESC expression of Ngn2/Isl1/Lhx3 induces rapid transcriptional and chromatin changes
At early stages Isl1/Lhx3 (homeodomain) and Ngn2 (bHLH) target distinct genomic sites
As programming progresses, Isl1/Lhx3 binding shows dynamic relocalization
Ngn2-induced factors guide Isl1/Lhx3 redistribution to initially inaccessible sites
ACKNOWLEDGMENTS
This work was supported by R01HD079682 NICHD and Project ALS to EOM. MMI is supported by the MDC-NYU exchange program. MMI and UO were in part supported by the Simons Foundation, through participation in the Spring 2016 Program on Algorithmic Challenges in Genomics at the Simons Institute for Theoretical Computing, UC Berkeley. SM is supported by the Center for Eukaryotic Gene Regulation at Pennsylvania State University. The authors would like to thank Hyoju Ban and Ashley Nicole Powers for their help with Single cell RNA-seq experiments; Wanjing Huo for help in molecular biology; the NYU Gencore and FACS-sorting Facilities. Also, we would like to thank Lionel Christiaen, Kenneth Birnbaum and Eftychia Apostolou for suggestions and Scott Lacadie for the template of the nucleosome-DNA cartoons.
Footnotes
Publisher's Disclaimer: This is a PDF file of an unedited manuscript that has been accepted for publication. As a service to our customers we are providing this early version of the manuscript. The manuscript will undergo copyediting, typesetting, and review of the resulting proof before it is published in its final citable form. Please note that during the production process errors may be discovered which could affect the content, and all legal disclaimers that apply to the journal pertain.
AUTHOR CONTRIBUTIONS
SV produced all ChIP-seq, single cell RNA-seq, qPCR and immunohistochemistry data. MAA produced bulk RNA-seq data, GG established the IL, IL-EO and NIL-EO cell lines with support from BA. AH produced all ATAC-seq data with support from MMI. RS and FAR performed the single-cell RNA-seq analysis, AK performed the transcription factor binding and motif analyses, MMI performed histone modification, ATAC-seq and bulk RNA-seq data analysis. EOM, SM and UO advised the project. SV, MMI, AK, UO, SM and EOM conceived the experiments, set up the analysis framework and co-wrote the manuscript. SV and EOM initiated the project. All authors read and approved the final manuscript.
REFERENCES
- Arnosti DN, Barolo S, Levine M, Small S. The eve stripe 2 enhancer employs multiple modes of transcriptional synergy. Development. 1996;122:205–214. doi: 10.1242/dev.122.1.205. [DOI] [PubMed] [Google Scholar]
- Ashburner M, Ball CA, Blake JA, Botstein D, Butler H, Cherry JM, Davis AP, Dolinski K, Dwight SS, Eppig JT, et al. Gene ontology: tool for the unification of biology. The Gene Ontology Consortium. Nature genetics. 2000;25:25–29. doi: 10.1038/75556. [DOI] [PMC free article] [PubMed] [Google Scholar]
- Audouard E, Schakman O, Rene F, Huettl RE, Huber AB, Loeffler JP, Gailly P, Clotman F. The Onecut transcription factor HNF-6 regulates in motor neurons the formation of the neuromuscular junctions. PloS one. 2012;7:e50509. doi: 10.1371/journal.pone.0050509. [DOI] [PMC free article] [PubMed] [Google Scholar]
- Bernstein BE, Mikkelsen TS, Xie X, Kamal M, Huebert DJ, Cuff J, Fry B, Meissner A, Wernig M, Plath K, et al. A bivalent chromatin structure marks key developmental genes in embryonic stem cells. Cell. 2006;125:315–326. doi: 10.1016/j.cell.2006.02.041. [DOI] [PubMed] [Google Scholar]
- Bhati M, Lee M, Nancarrow AL, Bach I, Guss JM, Matthews JM. Crystallization of an Lhx3-Isl1 complex. Acta Crystallogr Sect F Struct Biol Cryst Commun. 2008;64:297–299. doi: 10.1107/S174430910800691X. [DOI] [PMC free article] [PubMed] [Google Scholar]
- Boyer LA, Lee TI, Cole MF, Johnstone SE, Levine SS, Zucker JP, Guenther MG, Kumar RM, Murray HL, Jenner RG, et al. Core transcriptional regulatory circuitry in human embryonic stem cells. Cell. 2005;122:947–956. doi: 10.1016/j.cell.2005.08.020. [DOI] [PMC free article] [PubMed] [Google Scholar]
- Buenrostro JD, Giresi PG, Zaba LC, Chang HY, Greenleaf WJ. Transposition of native chromatin for fast and sensitive epigenomic profiling of open chromatin, DNA-binding proteins and nucleosome position. Nature methods. 2013;10:1213–1218. doi: 10.1038/nmeth.2688. [DOI] [PMC free article] [PubMed] [Google Scholar]
- Castro DS, Skowronska-Krawczyk D, Armant O, Donaldson IJ, Parras C, Hunt C, Critchley JA, Nguyen L, Gossler A, Gottgens B, et al. Proneural bHLH and Brn proteins coregulate a neurogenic program through cooperative binding to a conserved DNA motif. Developmental cell. 2006;11:831–844. doi: 10.1016/j.devcel.2006.10.006. [DOI] [PubMed] [Google Scholar]
- Chen HH, Arlotta P. Seq-ing the cortex one neuron at a time. Nature neuroscience. 2016;19:179–181. doi: 10.1038/nn.4230. [DOI] [PubMed] [Google Scholar]
- Cho HH, Cargnin F, Kim Y, Lee B, Kwon RJ, Nam H, Shen R, Barnes AP, Lee JW, Lee S, et al. Isl1 directly controls a cholinergic neuronal identity in the developing forebrain and spinal cord by forming cell type-specific complexes. PLoS Genet. 2014;10:e1004280. doi: 10.1371/journal.pgen.1004280. [DOI] [PMC free article] [PubMed] [Google Scholar]
- Croft D, Mundo AF, Haw R, Milacic M, Weiser J, Wu G, Caudy M, Garapati P, Gillespie M, Kamdar MR, et al. The Reactome pathway knowledgebase. Nucleic Acids Res. 2014;42:D472–477. doi: 10.1093/nar/gkt1102. [DOI] [PMC free article] [PubMed] [Google Scholar]
- Dasen JS, Jessell TM. Hox networks and the origins of motor neuron diversity. Curr Top Dev Biol. 2009;88:169–200. doi: 10.1016/S0070-2153(09)88006-X. [DOI] [PubMed] [Google Scholar]
- Denissov S, Hofemeister H, Marks H, Kranz A, Ciotta G, Singh S, Anastassiadis K, Stunnenberg HG, Stewart AF. Mll2 is required for H3K4 trimethylation on bivalent promoters in embryonic stem cells, whereas Mll1 is redundant. Development. 2014;141:526–537. doi: 10.1242/dev.102681. [DOI] [PubMed] [Google Scholar]
- Dixon P. VEGAN, a package of R functions for community ecology. Journal of Vegetation Science. 2003;14:927–930. [Google Scholar]
- Dodt M, Roehr JT, Ahmed R, Dieterich C. FLEXBAR-Flexible Barcode and Adapter Processing for Next-Generation Sequencing Platforms. Biology (Basel) 2012;1:895–905. doi: 10.3390/biology1030895. [DOI] [PMC free article] [PubMed] [Google Scholar]
- Fraley C, Murphy T, Scrucca L. MCLUST Version 4 for R: Normal Mixture Modeling for Model-Based Clustering, Classification, and Density Estimation, Technical Report no. 597. Department of Statistics, University of Washington; Jun, 2012. 2012. B. [Google Scholar]
- Francius C, Clotman F. Dynamic expression of the Onecut transcription factors HNF-6, OC-2 and OC-3 during spinal motor neuron development. Neuroscience. 2010;165:116–129. doi: 10.1016/j.neuroscience.2009.09.076. [DOI] [PubMed] [Google Scholar]
- Friedman N, Geiger D, Goldszmidt M. Bayesian Network Classifiers. Machine Learning. 1997;29:131–163. [Google Scholar]
- Garcia-Dominguez M, Poquet C, Garel S, Charnay P. Ebf gene function is required for coupling neuronal differentiation and cell cycle exit. Development. 2003;130:6013–6025. doi: 10.1242/dev.00840. [DOI] [PubMed] [Google Scholar]
- Gene Ontology, C. Gene Ontology Consortium: going forward. Nucleic Acids Res. 2015;43:D1049–1056. doi: 10.1093/nar/gku1179. [DOI] [PMC free article] [PubMed] [Google Scholar]
- German MS, Wang J, Chadwick RB, Rutter WJ. Synergistic activation of the insulin gene by a LIM-homeo domain protein and a basic helix-loop-helix protein: building a functional insulin minienhancer complex. Genes & development. 1992;6:2165–2176. doi: 10.1101/gad.6.11.2165. [DOI] [PubMed] [Google Scholar]
- Gifford CA, Ziller MJ, Gu H, Trapnell C, Donaghey J, Tsankov A, Shalek AK, Kelley DR, Shishkin AA, Issner R, et al. Transcriptional and epigenetic dynamics during specification of human embryonic stem cells. Cell. 2013;153:1149–1163. doi: 10.1016/j.cell.2013.04.037. [DOI] [PMC free article] [PubMed] [Google Scholar]
- Haghverdi L, Buettner F, Theis FJ. Diffusion maps for high-dimensional single-cell analysis of differentiation data. Bioinformatics. 2015;31:2989–2998. doi: 10.1093/bioinformatics/btv325. [DOI] [PubMed] [Google Scholar]
- Hastie T, Stuetzle W. Principal Curves. Journal of American Statistical Association. 1989;84:502–516. [Google Scholar]
- Hawkins RD, Hon GC, Yang C, Antosiewicz-Bourget JE, Lee LK, Ngo QM, Klugman S, Ching KA, Edsall LE, Ye Z, et al. Dynamic chromatin states in human ES cells reveal potential regulatory sequences and genes involved in pluripotency. Cell Res. 2011;21:1393–1409. doi: 10.1038/cr.2011.146. [DOI] [PMC free article] [PubMed] [Google Scholar]
- Hicks SC, Teng M, Irizarry RA. On the widespread and critical impact of systematic bias and batch effects in single-cell RNA-Seq data. BioRxiv. 2015 [Google Scholar]
- Hu D, Garruss AS, Gao X, Morgan MA, Cook M, Smith ER, Shilatifard A. The Mll2 branch of the COMPASS family regulates bivalent promoters in mouse embryonic stem cells. Nat Struct Mol Biol. 2013 doi: 10.1038/nsmb.2653. [DOI] [PMC free article] [PubMed] [Google Scholar]
- Iacovino M, Bosnakovski D, Fey H, Rux D, Bajwa G, Mahen E, Mitanoska A, Xu Z, Kyba M. Inducible cassette exchange: a rapid and efficient system enabling conditional gene expression in embryonic stem and primary cells. Stem cells. 2011;29:1580–1588. doi: 10.1002/stem.715. [DOI] [PMC free article] [PubMed] [Google Scholar]
- Ibrahim MM, Lacadie SA, Ohler U. JAMM: a peak finder for joint analysis of NGS replicates. Bioinformatics. 2015;31:48–55. doi: 10.1093/bioinformatics/btu568. [DOI] [PubMed] [Google Scholar]
- Jessell TM. Neuronal specification in the spinal cord: inductive signals and transcriptional codes. Nat Rev Genet. 2000;1:20–29. doi: 10.1038/35049541. [DOI] [PubMed] [Google Scholar]
- Kratsios P, Stolfi A, Levine M, Hobert O. Coordinated regulation of cholinergic motor neuron traits through a conserved terminal selector gene. Nature neuroscience. 2011;15:205–214. doi: 10.1038/nn.2989. [DOI] [PMC free article] [PubMed] [Google Scholar]
- Langmead B, Salzberg SL. Fast gapped-read alignment with Bowtie 2. Nature methods. 2012;9:357–359. doi: 10.1038/nmeth.1923. [DOI] [PMC free article] [PubMed] [Google Scholar]
- Langmead B, Trapnell C, Pop M, Salzberg SL. Ultrafast and memory-efficient alignment of short DNA sequences to the human genome. Genome Biol. 2009;10:R25. doi: 10.1186/gb-2009-10-3-r25. [DOI] [PMC free article] [PubMed] [Google Scholar]
- Lauritzen SL, Wermuth N. Graphical Models for Associations between Variables, some of which are Qualitative and some Quantitative. Ann Statist. 1989;17:31–57. [Google Scholar]
- Lee S, Cuvillier JM, Lee B, Shen R, Lee JW, Lee SK. Fusion protein Isl1-Lhx3 specifies motor neuron fate by inducing motor neuron genes and concomitantly suppressing the interneuron programs. Proceedings of the National Academy of Sciences of the United States of America. 2012;109:3383–3388. doi: 10.1073/pnas.1114515109. [DOI] [PMC free article] [PubMed] [Google Scholar]
- Lee SK, Pfaff SL. Synchronization of neurogenesis and motor neuron specification by direct coupling of bHLH and homeodomain transcription factors. Neuron. 2003;38:731–745. doi: 10.1016/s0896-6273(03)00296-4. [DOI] [PubMed] [Google Scholar]
- Leek JT, Johnson WE, Parker HS, Jaffe AE, Storey JD. The sva package for removing batch effects and other unwanted variation in high-throughput experiments. Bioinformatics. 2012;28:882–883. doi: 10.1093/bioinformatics/bts034. [DOI] [PMC free article] [PubMed] [Google Scholar]
- Li B, Dewey CN. RSEM: accurate transcript quantification from RNA-Seq data with or without a reference genome. BMC Bioinformatics. 2011;12:323. doi: 10.1186/1471-2105-12-323. [DOI] [PMC free article] [PubMed] [Google Scholar]
- Li H, Handsaker B, Wysoker A, Fennell T, Ruan J, Homer N, Marth G, Abecasis G, Durbin R, Genome Project Data Processing, S. The Sequence Alignment/Map format and SAMtools. Bioinformatics. 2009;25:2078–2079. doi: 10.1093/bioinformatics/btp352. [DOI] [PMC free article] [PubMed] [Google Scholar]
- Mahony S, Edwards MD, Mazzoni EO, Sherwood RI, Kakumanu A, Morrison CA, Wichterle H, Gifford DK. An integrated model of multiple-condition ChIP-Seq data reveals predeterminants of Cdx2 binding. PLoS Comput Biol. 2014;10:e1003501. doi: 10.1371/journal.pcbi.1003501. [DOI] [PMC free article] [PubMed] [Google Scholar]
- Mazzoni EO, Mahony S, Closser M, Morrison CA, Nedelec S, Williams DJ, An D, Gifford DK, Wichterle H. Synergistic binding of transcription factors to cell-specific enhancers programs motor neuron identity. Nature neuroscience. 2013 doi: 10.1038/nn.3467. [DOI] [PMC free article] [PubMed] [Google Scholar]
- Mazzoni EO, Mahony S, Iacovino M, Morrison CA, Mountoufaris G, Closser M, Whyte WA, Young RA, Kyba M, Gifford DK, et al. Embryonic stem cell-based mapping of developmental transcriptional programs. Nature methods. 2011;8:1056–1058. doi: 10.1038/nmeth.1775. [DOI] [PMC free article] [PubMed] [Google Scholar]
- McLean CY, Bristor D, Hiller M, Clarke SL, Schaar BT, Lowe CB, Wenger AM, Bejerano G. GREAT improves functional interpretation of cis-regulatory regions. Nature biotechnology. 2010;28:495–501. doi: 10.1038/nbt.1630. [DOI] [PMC free article] [PubMed] [Google Scholar]
- Mi H, Poudel S, Muruganujan A, Casagrande JT, Thomas PD. PANTHER version 10: expanded protein families and functions, and analysis tools. Nucleic Acids Res. 2016;44:D336–342. doi: 10.1093/nar/gkv1194. [DOI] [PMC free article] [PubMed] [Google Scholar]
- Milacic M, Haw R, Rothfels K, Wu G, Croft D, Hermjakob H, D'Eustachio P, Stein L. Annotating cancer variants and anti-cancer therapeutics in reactome. Cancers (Basel) 2012;4:1180–1211. doi: 10.3390/cancers4041180. [DOI] [PMC free article] [PubMed] [Google Scholar]
- Mudge JM, Harrow J. Creating reference gene annotation for the mouse C57BL6/J genome assembly. Mamm Genome. 2015;26:366–378. doi: 10.1007/s00335-015-9583-x. [DOI] [PMC free article] [PubMed] [Google Scholar]
- Murphy K. The Bayes net toolbox for matlab. Computing science and statistics. 2001;33:1024–1034. [Google Scholar]
- Neph S, Kuehn MS, Reynolds AP, Haugen E, Thurman RE, Johnson AK, Rynes E, Maurano MT, Vierstra J, Thomas S, et al. BEDOPS: high-performance genomic feature operations. Bioinformatics. 2012;28:1919–1920. doi: 10.1093/bioinformatics/bts277. [DOI] [PMC free article] [PubMed] [Google Scholar]
- Pearl J. Probabilistic Reasoning in Intelligent Systems: Networks of Plausible Inference (Morgan Kaufmann Series in Representation and Reasoning) 1988 [Google Scholar]
- Picelli S, Bjorklund AK, Faridani OR, Sagasser S, Winberg G, Sandberg R. Smart-seq2 for sensitive full-length transcriptome profiling in single cells. Nature methods. 2013;10:1096–1098. doi: 10.1038/nmeth.2639. [DOI] [PubMed] [Google Scholar]
- Quinlan AR, Hall IM. BEDTools: a flexible suite of utilities for comparing genomic features. Bioinformatics. 2010;26:841–842. doi: 10.1093/bioinformatics/btq033. [DOI] [PMC free article] [PubMed] [Google Scholar]
- Ramirez F, Dundar F, Diehl S, Gruning BA, Manke T. deepTools: a flexible platform for exploring deep-sequencing data. Nucleic Acids Res. 2014;42:W187–191. doi: 10.1093/nar/gku365. [DOI] [PMC free article] [PubMed] [Google Scholar]
- Razy-Krajka F, Lam K, Wang W, Stolfi A, Joly M, Bonneau R, Christiaen L. Collier/OLF/EBF-dependent transcriptional dynamics control pharyngeal muscle specification from primed cardiopharyngeal progenitors. Developmental cell. 2014;29:263–276. doi: 10.1016/j.devcel.2014.04.001. [DOI] [PMC free article] [PubMed] [Google Scholar]
- Ritchie ME, Phipson B, Wu D, Hu Y, Law CW, Shi W, Smyth GK. limma powers differential expression analyses for RNA-sequencing and microarray studies. Nucleic Acids Res. 2015;43:e47. doi: 10.1093/nar/gkv007. [DOI] [PMC free article] [PubMed] [Google Scholar]
- Roy A, Francius C, Rousso DL, Seuntjens E, Debruyn J, Luxenhofer G, Huber AB, Huylebroeck D, Novitch BG, Clotman F. Onecut transcription factors act upstream of Isl1 to regulate spinal motoneuron diversification. Development. 2012;139:3109–3119. doi: 10.1242/dev.078501. [DOI] [PMC free article] [PubMed] [Google Scholar]
- Satija R, Farrell JA, Gennert D, Schier AF, Regev A. Spatial reconstruction of single-cell gene expression data. Nature biotechnology. 2015;33:495–502. doi: 10.1038/nbt.3192. [DOI] [PMC free article] [PubMed] [Google Scholar]
- Shalek AK, Satija R, Adiconis X, Gertner RS, Gaublomme JT, Raychowdhury R, Schwartz S, Yosef N, Malboeuf C, Lu D, et al. Single-cell transcriptomics reveals bimodality in expression and splicing in immune cells. Nature. 2013;498:236–240. doi: 10.1038/nature12172. [DOI] [PMC free article] [PubMed] [Google Scholar]
- Son EY, Ichida JK, Wainger BJ, Toma JS, Rafuse VF, Woolf CJ, Eggan K. Conversion of Mouse and Human Fibroblasts into Functional Spinal Motor Neurons. Cell stem cell. 2011 doi: 10.1016/j.stem.2011.07.014. [DOI] [PMC free article] [PubMed] [Google Scholar]
- Soufi A, Donahue G, Zaret KS. Facilitators and impediments of the pluripotency reprogramming factors' initial engagement with the genome. Cell. 2012;151:994–1004. doi: 10.1016/j.cell.2012.09.045. [DOI] [PMC free article] [PubMed] [Google Scholar]
- Soufi A, Garcia MF, Jaroszewicz A, Osman N, Pellegrini M, Zaret KS. Pioneer transcription factors target partial DNA motifs on nucleosomes to initiate reprogramming. Cell. 2015;161:555–568. doi: 10.1016/j.cell.2015.03.017. [DOI] [PMC free article] [PubMed] [Google Scholar]
- Stolfi A, Gandhi S, Salek F, Christiaen L. Tissue-specific genome editing in Ciona embryos by CRISPR/Cas9. Development. 2014;141:4115–4120. doi: 10.1242/dev.114488. [DOI] [PMC free article] [PubMed] [Google Scholar]
- Thaler JP, Lee SK, Jurata LW, Gill GN, Pfaff SL. LIM factor Lhx3 contributes to the specification of motor neuron and interneuron identity through cell-type-specific protein-protein interactions. Cell. 2002;110:237–249. doi: 10.1016/s0092-8674(02)00823-1. [DOI] [PubMed] [Google Scholar]
- Trapnell C, Cacchiarelli D, Grimsby J, Pokharel P, Li S, Morse M, Lennon NJ, Livak KJ, Mikkelsen TS, Rinn JL. The dynamics and regulators of cell fate decisions are revealed by pseudotemporal ordering of single cells. Nature biotechnology. 2014;32:381–386. doi: 10.1038/nbt.2859. [DOI] [PMC free article] [PubMed] [Google Scholar]
- Tsankov AM, Gu H, Akopian V, Ziller MJ, Donaghey J, Amit I, Gnirke A, Meissner A. Transcription factor binding dynamics during human ES cell differentiation. Nature. 2015;518:344–349. doi: 10.1038/nature14233. [DOI] [PMC free article] [PubMed] [Google Scholar]
- Voigt P, Tee WW, Reinberg D. A double take on bivalent promoters. Genes & development. 2013;27:1318–1338. doi: 10.1101/gad.219626.113. [DOI] [PMC free article] [PubMed] [Google Scholar]
- Wang A, Yue F, Li Y, Xie R, Harper T, Patel NA, Muth K, Palmer J, Qiu Y, Wang J, et al. Epigenetic priming of enhancers predicts developmental competence of hESC-derived endodermal lineage intermediates. Cell stem cell. 2015;16:386–399. doi: 10.1016/j.stem.2015.02.013. [DOI] [PMC free article] [PubMed] [Google Scholar]
- Wapinski OL, Vierbuchen T, Qu K, Lee QY, Chanda S, Fuentes DR, Giresi PG, Ng YH, Marro S, Neff NF, et al. Hierarchical mechanisms for direct reprogramming of fibroblasts to neurons. Cell. 2013;155:621–635. doi: 10.1016/j.cell.2013.09.028. [DOI] [PMC free article] [PubMed] [Google Scholar]
- Warnes GR, Bolker B, Bonebakker L, Gentleman R, Huber W, Liaw A, Lumley T, Maechler M, Magnusson A, Moeller S, Schwartz M, Venables B. Gplots: Various R programming tools for plotting data. 2016 [Google Scholar]
- Weirauch MT, Yang A, Albu M, Cote AG, Montenegro-Montero A, Drewe P, Najafabadi HS, Lambert SA, Mann I, Cook K, et al. Determination and inference of eukaryotic transcription factor sequence specificity. Cell. 2014;158:1431–1443. doi: 10.1016/j.cell.2014.08.009. [DOI] [PMC free article] [PubMed] [Google Scholar]
- Whitaker JW, Chen Z, Wang W. Predicting the human epigenome from DNA motifs. Nature methods. 2015;12:265–272. doi: 10.1038/nmeth.3065. 267 p following 272. [DOI] [PMC free article] [PubMed] [Google Scholar]
- Yu P, Xiao S, Xin X, Song CX, Huang W, McDee D, Tanaka T, Wang T, He C, Zhong S. Spatiotemporal clustering of the epigenome reveals rules of dynamic gene regulation. Genome Res. 2013;23:352–364. doi: 10.1101/gr.144949.112. [DOI] [PMC free article] [PubMed] [Google Scholar]
- Ziller MJ, Edri R, Yaffe Y, Donaghey J, Pop R, Mallard W, Issner R, Gifford CA, Goren A, Xing J, et al. Dissecting neural differentiation regulatory networks through epigenetic footprinting. Nature. 2015;518:355–359. doi: 10.1038/nature13990. [DOI] [PMC free article] [PubMed] [Google Scholar]
Associated Data
This section collects any data citations, data availability statements, or supplementary materials included in this article.