

Abstract
Disability measures in multiple sclerosis (MS) rely heavily on ambulatory function, and current metrics fail to capture potentially important variability in walking behavior. We sought to determine whether remote step count monitoring using a consumer-friendly accelerometer (Fitbit Flex) can enhance MS disability assessment. 99 adults with relapsing or progressive MS able to walk C2-min were prospectively recruited. At 4 weeks, study retention was 97% and median Fitbit use was 97% of days. Substudy validation resulted in high interclass correlations between Fitbit, ActiGraph and manual step count tally during a 2-minute walk test, and between Fitbit and ActiGraph (ICC = 0.76) during 7-day home monitoring. Over 4 weeks of continuous monitoring, daily steps were lower in progressive versus relapsing MS (mean difference 2546 steps, p \ 0.01). Lower average daily step count was associated with greater disability on the Expanded Disability Status Scale (EDSS) (p \ 0.001). Within each EDSS category, substantial variability in step count was apparent (i.e., EDSS = 6.0 range 1097–7152). Step count demonstrated moderate-strong correlations with other walking measures. Lower average daily step count is associated with greater MS disability and captures important variability in real-world walking activity otherwise masked by standard disability scales, including the EDSS. These results support remote step count monitoring as an exploratory outcome in MS trials.
Keywords: Multiple sclerosis, Outcome measurement, Remote physical activity monitoring, Accelerometer, Progressive, Relapsing
Introduction
Multiple sclerosis (MS) is a leading non-traumatic cause of ambulatory disability in young adults in the developed world [1]. People with MS are less physically active than age and sex-matched controls [2–4].
Ambulatory dysfunction underlies many commonly used MS disability metrics [5]. The rater-based Kurtzke Expanded Disability Status Scale (EDSS) [6], a core disability metric in MS clinical trials, categorizes functional disability based on relatively crude divisions of ambulatory capacity [7] and fails to capture important differences in physical capabilities at each disability level. For example, patients who rely on a cane to walk are classified as having an EDSS of 6.0. However, under natural conditions some patients may walk miles a day with their cane, whereas others may barely walk at all [8]. Failing to measure these differences in real-world ambulatory function can make it harder to track progressive disease in people with MS or capture improvement from reparative therapies and may not adequately reflect risk of comorbidities related to deconditioning [8]. Standard clinical performance-based measures, such as the Timed 25-foot Walk (T25FW), provide objective snapshots of ambulatory function in a clinic-based setting but may not reflect walking activity in the natural environment [9]. Patient-reported measures of ambulatory function (i.e., 12-item Multiple Sclerosis Walking Scale, MSWS-12) are limited by recall bias and variability in self-perception of physical function.
Objectively measuring physical activity in the natural environment via remote monitoring with wearable devices may be useful for documenting patient status in clinical care or as an outcome measure for clinical trials [10, 11]. Studies in MS using commercial research-grade accelerometers (i.e., ActiGraph) demonstrate moderate to strong correlations between step and activity counts and standard MS disability measures [12, 13]. However, these devices tend to be bulky, expensive and impractical for long-term monitoring. The majority of research on activity monitoring in MS is based on data from research-grade devices with discrete wear times of 3–10 days [14]. Sporadic assessment also risks potential bias from reactivity, a transient increase in physical activity upon initially donning a novel activity monitoring device [15]. Some MS patients already elect to wear consumer-friendly remote activity monitors, which are often marketed for fitness indications and tend to be less expensive, more fashion-friendly and could potentially allow for longer-term step count monitoring. However, in a recent systematic review, few studies report on consumer-friendly devices or how metrics from these might inform MS care or clinical trials [14]. In one study, a variety of wrist, waist and mobile phone application-based activity monitors were compared in a clinical setting for absolute step count accuracy in people with MS who could walk without an assistive device for 500 m [16]. Although waist worn models (i.e., Fitbit One) showed superior accuracy for absolute step count in the clinical setting [16], there may be greater long-term practicality if patients can continuously and discretely wear a device around the wrist rather than having to remember to don and doff a clip-on device every day.
In this analysis, we sought to determine the validity of the Fitbit Flex (Fitbit Inc., San Francisco, CA, USA) as an economical, consumer-friendly alternative to a commonly used research-grade activity monitor (ActiGraph) in people with MS. We also sought to test two hypotheses: (1) that measurement of ambulatory activity over 4 weeks of continuous monitoring using the Fitbit Flex is feasible in people with MS and will exhibit strong associations with performance-based and patient-reported MS disability measures obtained in clinic; and (2) that variability in step count measured remotely over 4 weeks can supplement clinic-based disability assessments.
Methods
Participants
We recruited a prospective cohort of relapsing or progressive MS subjects from the University of California, San Francisco (UCSF) MS Center between July 2015 and April 2016. Participants were included if they: (1) had MS as defined by 2010 International Panel criteria [17] confirmed by a MS neurologist; (2) were C18 years of age; (3) were able to walk for at least 2 min with or without an assistive device; (4) had no clinical MS relapse within 30 days of cohort entry; and (5) had access to Wi-Fi Internet at home or in their community. Exclusion criteria included: (1) major musculoskeletal, cardiovascular or respiratory comorbidities that, in the opinion of the study investigators, could substantially impair physical activity and/or confound results; and (2) a clinical relapse within 30 days of cohort entry. Relapsing and progressive phenotypes were defined according to 2014 Advisory Committee on Clinical Trials in MS Committee definitions [18]. We recruited in blocks to a target goal based on EDSS: “No disability” (0–1.5), “mild disability” (2–3.5), “mild ambulatory disability” (4), “moderate ambulatory disability” (4.5–5.5), “unilateral support needed for ambulation” (6), and “bilateral support needed for ambulation” (6.5). The UCSF Institutional Review Board approved the study protocol, and all participants provided written informed consent obtained electronically.
Study procedures
Participants were provided with an accelerometer (Fitbit Flex) upon study entry and trained on the set-up and use of the device. This triaxial accelerometer is worn within a wrist bracelet and the battery must be recharged every 5–8 days. Participants were asked to wear the device on their nondominant wrist as much as possible except while swimming and instructed to continue with their normal daily lives. Devices were replaced if lost. To minimize the potential influence of motivational factors on physical activity levels, the daily “goal” on the device was set low at 500 steps/day at the study visit, but participants were taught how to change the goal settings to their liking.
The Fitbit device was selected to leverage a clinical research platform for electronic consent and remote activity monitor data collection already in use by the Health eHeart Study, an internet-based, longitudinal, cardiovascular cohort study. Participants consented to link their Fitbit accounts with the Health eHeart platform and gave authorization for the study to retrieve data for the purposes of the study. Fitbit data was automatically transmitted to the Health eHeart database via an application-programming interface.
At study enrollment, investigators evaluated clinic-based measures of ambulation using several validated measures (Table 1). These included: EDSS, averaged results from two trials for the T25FW [19] and the Timed Up and Go (TUG) [20] and a single trial of a 2-minute walk (2MW) test [21]. The 2MW test provides a validated shorter alternative to the 6-minute walk test for measuring endurance [9], and was chosen to be sensitive across a wide range of disability levels and to reduce participant burden. During the 2MW, total number of steps taken by participants was recorded via Fitbit, ActiGraph GT3X accelerometer (Manufacturing Technology, Inc., FL, USA) and by manual tallying. The ActiGraph is the most frequently used device in MS studies remotely recording ≥24 h of physical activity [14]. A subset of participants were sent an ActiGraph (in addition to the Fitbit) to wear for 7-days in their home-environment.
Table 1. Table of clinic-based and patient-reported outcomes.
| Assessment name | Acronym | Characteristics | Score range and direction | |
|---|---|---|---|---|
| A | Expanded Disability Status Scale | EDSS | Criterion standard for MS Disability assessment | 0–10 (Higher number = greater disability) |
| Timed 25-foot walk | T25FW | Measures the time it takes a person to walk 25 feet Good reliability, reproducibility and strong associations of gait velocity with the EDSS have been reported |
Greater times indicate slower walking speed and greater disability | |
| Timed Up and Go | TUG | Measures time taken to rise from a chair, walk for 3 m, turn around, walk back to the chair and sit down again Associations with balance, walking ability, and fall risk in MS |
Greater times indicate worse balance and walking ability, and higher fall risk | |
| 2-minute walk | 2MW | Measures the distance walked (meters) in 2 min It is a validated, shorter alternative to the 6-minute walk test for measuring endurance |
Shorter distances indicate less endurance | |
| B | 12-item MultipleSclerosis Walking Scale | MSWS-12 | 12 item questionnaire Assesses the impact of MS on walking ability High reliability, validity and internal consistency |
12–60 (Higher score = greater self-reported impact of MS) |
| Pain Effects Scale | PES | Assesses ways in which pain and unpleasant sensations interfere with mood, ability to walk or move, sleep, work, recreation, and enjoyment of life in persons with MS. Pain is reported in more than 50% of people with MS, and may be a limiting factor in physical activity participation |
6–30 (Higher scores indicate greater pain) |
|
| Bladder Control Scale | BLCS | Four-item questionnaire Assesses the extent to which bladder dysfunction impacts daily living |
0–22 (Higher scores = greater bladder control issues) |
|
| Bowel Control Scale | BWCS | Five-item questionnaire Assesses the extent to which bowel dysfunction impacts daily living |
0–26 (Higher scores = greater bowel control issues) |
|
| Modified Fatigue Impact Scale, 5-item version | MFIS-5 | Assesses the impact of cognitive, physical functioning and psychosocial aspects of fatigue on daily life | 0–20 (Higher scores = more impact from fatigue) |
|
| Abbreviated mental health inventory | MHI-5 | Assesses depression, anxiety, positive and negative affect and behavioral control Depression (affecting [33% of people with MS) has been linked with apathy and has the potential to affect physical activity levels |
5–30 (Higher scores = greater impact on emotional functioning) |
At study entry, participants also completed several self-reported questionnaires online via a secure website (REDCap) [22] to measure disability and symptomatology (Table 1). All of these were completed in the clinic and included the: MSWS [12, 23] Pain Effects Scale (PES) [24], Bladder and Bowel Control Scales (BLCS and BWCS, respectively) [25], Modified Fatigue Impact Scale, 5-item version (MFIS-5) [26], and the Abbreviated Mental Health Inventory (MHI-5) [27].
Demographic and clinical data were confirmed through chart review.
Statistical analysis
The main outcome measures for this analysis were step count per minute in the comparative assessments in clinic and at home for 7 days, and average daily step count for the 4 weeks of continuous monitoring. For quality control, days in which < 300 steps were recorded were excluded from analysis to minimize potential bias, such as non-wear of the device that day. This threshold of 300 steps was based on inspection of our raw data as well as observed ranges of step count in previous studies in MS [2, 28].
Intraclass correlation coefficients (ICC) with 95% confidence interval (CI) were calculated to determine correlations between all measures of step count in both clinic-based and home-environment validations. The Bland–Altman approach was used to assess the agreement between the measurement techniques in clinic and the home-environment [29]. We graphed daily step count to determine whether a consistent trend of decreasing step count from weeks 1–4 was present that would indicate reactivity as the novelty of wearing a monitoring device wore off. Average daily step count over 4 weeks was the primary variable. We used the inverse of timed scores, TUG and T25FW for regression modeling. Spearman's rank correlation coefficient was used to determine the bivariate association between average daily step count and clinic-based and patient-reported outcome variables. Generalized linear models with Gamma variance were examined to account for potential covariates, including sex, age and disease subtype. We used a correlation matrix heat-map to depict the associations between all variables. Statistics were calculated and figures generated using the open-source programming language R (R: A language and environment for statistical computing, Vienna, Austria), and several R-packages (i.e., ggplot and dplyr). A p value < 0.05 was considered significant.
Results
We recruited 99 participants; three participants withdrew by week 4 (97% retention). Reasons for withdrawal included incompatibility of home computer software (1) and personal preference (2). Four participants had problems synchronizing the device to the database until week 3 and were excluded from analysis. Median Fitbit use over the first 4 weeks was 97% of days. No devices were lost during the first 4 weeks. Sixty one of these participants were evaluated for the clinic-based comparison of measurement techniques (Table 2A), and 21 participants participated in the home validation (Table 2B) comparing Fitbit and ActiGraph.
Table 2. Demographics for cohort in clinic-base validation (Fitbit, ActiGraph and manual tally over 2-minute walk test) and home-environment validation (Fitbit Flex and ActiGraph for 7 days).
| Demographics | (A) Clinic-based | (B) Home-environment |
|
|
||
| Sample size | 61 | 21 |
| Sex: number of female (%) | 44 (72) | 14 (67) |
| Age, years: mean (SD) | 50 (14.4) | 54 (11.4) |
| EDSS: mean (range) | 4.0 (0.0–6.5) | 4.0 (0.0–6.5) |
| Walking disability: EDSS ≥ 4 (%) | 34 (55.7) | 12 (57) |
| Disease subtype: relapsing MS (%) | 42 (69) | 10 (48) |
SD standard deviation, EDSS Expanded Disability Status Scale, MS multiple sclerosis
High ICC values were found between Manual-Fitbit, Manual-ActiGraph and ActiGraph-Fitbit (0.69, 0.76 and 0.59, respectively). Bland–Altman plots (Fig. 1a–c) showed no systematic bias between manual and Fitbit Flex over the range of steps counted during the 2MW. Compared to manual counting, ActiGraph tended to under-record steps at lower step counts and Fitbit counted more steps than ActiGraph in the same range. At home over 7-days of continuous monitoring, the correlation between the step counts of the two devices was ICC = 0.76, but Fitbit recorded on average 1132 daily steps more than ActiGraph [95% CI (500–1763) steps, p < 0.01]. Fitbit was worn more than ActiGraph, at 96% compared to 91% wear-time.
Fig 1.
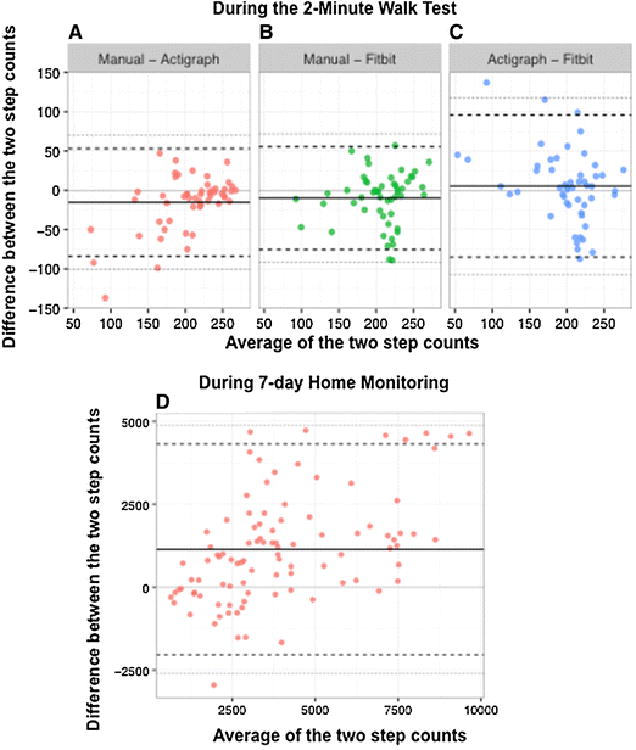
Bland–Altman plots to assess agreement between measurement techniques. a–c Comparisons of steps counted during 2-min walk test as recorded by manual counting, Fitbit Flex, and ActiGraph. d Bland–Altman plots for Fitbit Flex and ActiGraph steps per day as recorded over 7 days of activity monitoring in the home environment. The solid black line represents the mean difference between the measures and the black dashed horizontal lines represent mean difference ±2 standard deviations. Each point corresponds to a separate individual (a–c) and separate day (d). The solid lighter gray line indicates where ‘0’ difference between the measures would lie. The gray dashed lines are the 95% limits of agreement
No clear pattern of reactivity was observed (Fig. 2a), therefore we elected to use average daily step count over the entire 4 weeks of monitoring as our primary measure. To compare reliability of shorter monitoring durations, we computed the correlation across our patients between this primary measure and the daily step count averaged over every shorter monitoring period, up to 4 weeks (Fig. 2b). Monitoring 13 days or more appears very reliable, as it leads to high correlation (Pearson r2 < 0.98) with our long-term average, while monitoring periods less than 6 days (r2 < 0.95) and 3 days (r2 < 0.90) are, respectively, of lower reliability.
Fig 2.
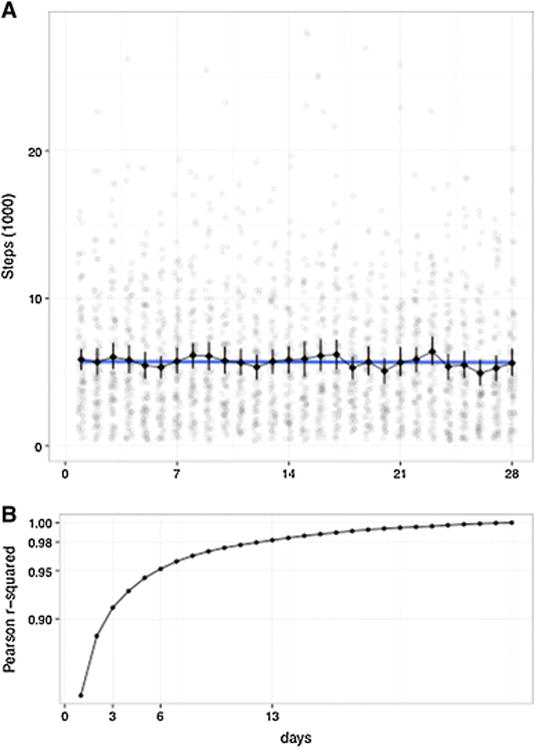
Evolution of daily step count and of the reliability of monitoring over 28 days. a Average Steps (via Fitbit Flex) per Day, over initial 28 days. The number of steps taken each day for each individual participant is represented in light grey dots. The black line depicts the average number of steps per day, across all participants, with the variability denoted by the error bars. No reactivity was observed in our cohort. b For each n number of days, we plot the average of all the correlation measures between an average daily step count computed from a monitoring period of n successive days, and the average daily step count computed from the full 4 weeks monitoring period (ground truth). The correlations are computed with the Pearson r2, across all patients
Demographic and clinical characteristics of all participants, the total number of steps in a given day, and the daily average step count are listed in Table 3a. People with progressive MS walked significantly fewer steps per day than those with relapsing MS [mean difference 2258 steps, 95% CI (1242–2782 steps), p < 0.001, adjusting for age and sex].
Table 3.
a: Demographic and step count data, b: Correlation and regression statistics for daily step count and clinic-based performance measures and patient-reported outcomes
| Demographic data | Entire cohort | Progressive MS | Relapsing MS | |
|---|---|---|---|---|
| a | ||||
| Total N (% of cohort) | 99 | 38 (38%) | 61 (62%) | |
| Women (% of MS subtype) | 63 (64%) | 20 (53%) | 43 (71%) | |
| Men (% of MS subtype) | 36 (36%) | 18 (47%) | 18 (29%) | |
| Age (years) | ||||
| Mean (SD) | 50.1 (13.8) | 57.7 (9.1) | 45.4 (14.2) | |
| Disease duration (years) | ||||
| Median (interquartile range 25–75%) | 13.0 (6.0–21.0) | 16.0 (9.0–21.0) | 9.0 (4.0–21.0) | |
| EDSS | ||||
| Mean (range) | 4.1 (0.0–6.5) | 5.5 (3.0–6.5) | 3.2 (0.0–6.5) | |
| Steps per day | ||||
| Average (SD) | 5478 (3507) | 3809 (2104) | 6477 (3707) | |
| Minimum–maximumA | 533–18,649 | 533–8396 | 1129–18,649 | |
| RangeB | 326–28,074 | 326–15,118 | 336–28,074 | |
|
| ||||
| Correlation and regressionstatistics | Outcomemeasure | Univariate model:Spearman's q | Multivariate model: adjusted R2, (e) | |
|
| ||||
| b | ||||
| Clinic-based | T25FW | −0.66d | 0.38d | |
| TUG | −0.68d | 0.40d | ||
| 2MW | 0.69d | 0.43d | ||
| Patient-reported | MSWS-12 | −0.66d | 0.37d | |
| MFIS-5 | −0.41c | 0.17c | ||
| PES | −0.32c | 0.09b | ||
| BLCS | −0.39b | 0.10a | ||
| BWCS | −0.22a | 0.07a | ||
| MHI-5 | −0.02a | −0.01a | ||
In general, clinic-based performance measures displayed greater correlations with step count than patient-reported symptomatic outcomes, even in adjusted analyses. Significance, p values:
not statistically significant
p = 0.05
p 0.01
p 0.001
generalized linear model: adjusting for age, sex, disease subtype
MS multiple sclerosis, SD standard deviation, EDSS Kurtzke Expanded Disability Status Scale, T25FW timed 25-foot walk, TUG timed up and go, 2MW 2-minute walk, MSWS-12 12-item MS Walking Scale, MFIS-5 Modified Fatigue Index (5 item version), PES Pain Effects Scale, BLCS Bladder Control Scale, BWCS Bowel Control Scale, MHI-5 Mental Health Inventory (5 item version)
Average steps per day, over 4 weeks
Total steps per day, per participant
Lower average daily step count is associated with greater ambulatory disability as assessed by EDSS. Moderate to high negative correlation was observed between average daily step count and disability level (Spearman's q = -0.71, p < 0.001). Figure 3 illustrates the substantial variability in average daily step count within each EDSS block. For example, in the EDSS 6.0 group, average daily step count ranged from 1097 to 7152 (mean 3425, SD 1481). In a generalized linear model, adjusting for age, sex and disease subtype, the average daily step count explained 44% of the variance in EDSS. Findings remained significant after adjusting for potentially confounding symptoms, such as pain (PES), fatigue (MFIS-5) or mental health (MHI-5).
Fig 3.
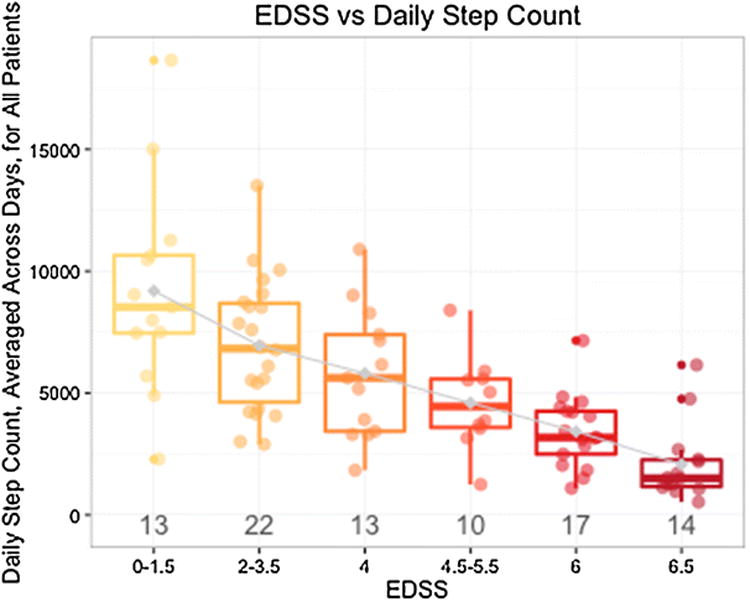
Average daily step count (measured using the Fitbit Flex) is associated with EDSS but also identifies variability of ambulatory activity within EDSS categories. The number of people in each EDSS block is depicted below the box plots. Greater disability (higher EDSS score) is associated with lower average steps per day (ambulatory activity), and lower disability (lower EDSS) is associated with greater ambulatory activity. Variability exists within EDSS blocks, including in those designated EDSS = 6 (need for unilateral support to walk minimal distances)
Lower average daily step count was associated with longer T25FW times recorded as a clinic-based measure of walking speed (Spearman's q = -0.65, p < 0.001; multi-variable model adjusting for age, sex, disease subtype: adjusted R2 = 0.37, p < 0.001). Similarly, longer TUG times and shorter distances walked during the 2MW test were also significantly associated with lower step count (Fig. 4a, b; Table 3b).
Fig 4.
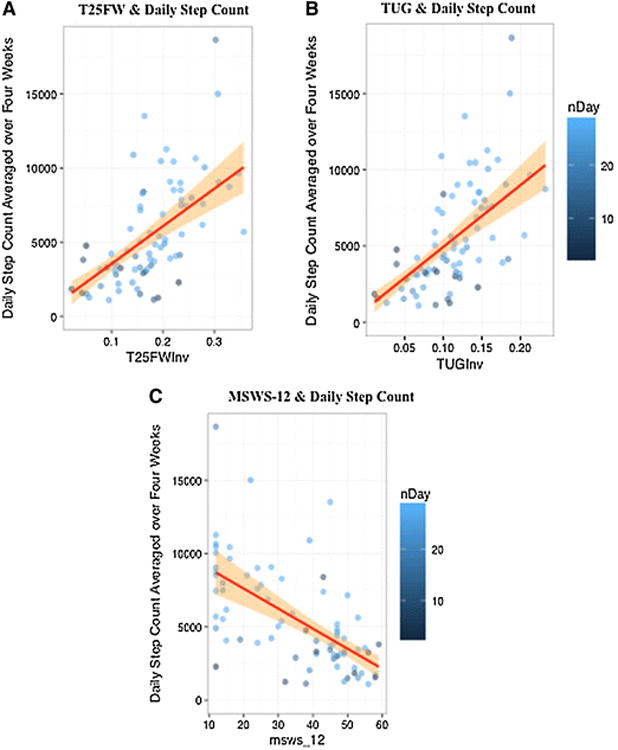
Greater average daily step count (measured using the Fitbit Flex) is correlated with better performance-based measures of ambulatory function and lower patient-reported impact of MS on ambulatory function. a: Average steps per day are inversely correlated to the time taken to complete the T25FW: faster walking speeds are associated with a greater average daily step count. (q = 0.65, p < 0.001). b: Likewise, average steps per day are positively associated with higher mobility and balance (faster TUG time scores). (q = -0.64, p < 0.001). c The 12-item MS walking scale (MSWS-12) is inversely correlated to the ambulatory activity (average number of steps per day) recorded by the Fitbit Flex. Higher MSWS-12 scores indicate greater impact of MS on a person's walking ability, and correspond to a lower average daily step count. (q = -0.63, p <0.001). The orange shading corresponds to the slope estimate, which is constrained to be linear (red line). a, b Inverse scores were taken to normalize the data and allow for linear regressions. nDay the number of valid days of Fitbit Flex step count data, T25FWInv inverse (1/T25FW) score of the T25FW, TUGInv inverse (1/TUG) score of the TUG
Lower average daily step count was associated with greater patient-reported measures of ambulatory disability; lower MSWS-12 scores (Spearman's q = -0.65, p< 0.001; multivariate model adjusting for age, sex, disease subtype: adjusted-R2 = 0.36, p <0.001) (Fig. 4c; Table 3b). Weaker but statistically significant correlations were found between step count and fatigue (MFIS) or pain (PES) (Table 3b); adjustment for age, sex and disease subtype did not significantly change the results. Correlations (q) between step count were moderate with bladder symptoms (BLCS); adjustment for potential confounders (sex, age and disease subtype) did not significantly alter these results. No significant correlations were found between average daily step count and mental health (MHI-5) or bowel symptoms (BWCS) (Table 3b).
A correlation-based clustering analysis (‘Correlation matrix heat-map’) displays relationships of bivariate associations between all included outcome measures (Fig. 5). The dendrogram reveals that most clinic-based measures are strongly correlated to one another, with the TUG and T25FW being most similar.
Fig 5.
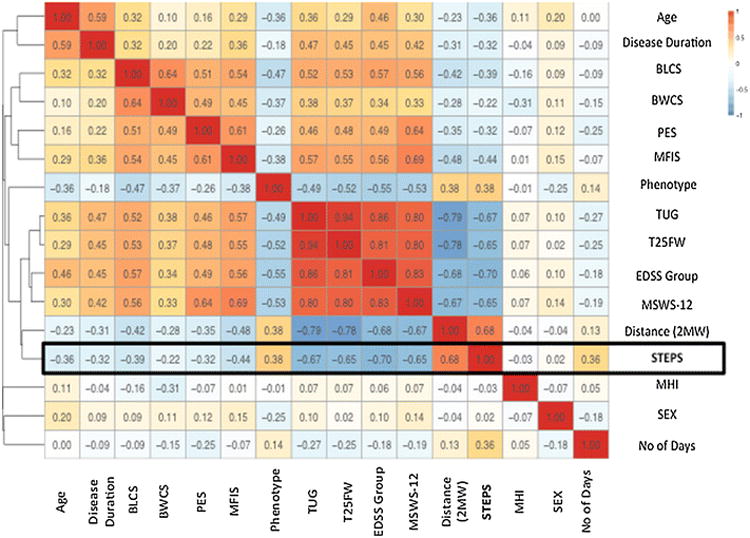
Bivariate associations between average steps per day and all demographic, clinic-based and patient-reported variables. The heat-map (to the right) graphically depicts the direction of correlation, with red tones trending towards positive (+1) and blue tones indicating negative correlations (-1). Correlations are computed using the Spearman's q. The Dendrogram (to the left) is the branching diagram, depicting the strength of the relationships between all of the included outcomes and shows all outcomes hierarchically clustered in relation to the strength of correlation (Spearman's q) regardless of the direction of association. The distance used for clustering here is equal to 1–C^2, with C the correlation. diseaseDuration the duration of the disease, subtype_cat MS subtype/phenotype category (Relapsing or Progressive), EDSSgroup EDSS grouped into blocks, nDay the number of valid days of Fitbit step count data, dist2M distance walked during the 2MW test, STEPS average number of steps/day over 4 weeks.
Discussion
In this prospective cohort of relapsing and progressive MS patients with a broad range of ambulatory disability, we confirmed three specific hypotheses relating to ambulatory activity. First, we demonstrated that ambulatory activity over 4 weeks of continuous monitoring using a Fitbit Flex is feasible in people with MS. Second, we showed that lower average daily step count over this period of continuous monitoring was associated with greater MS disability and lower ambulatory function scores. Finally, we noted significant variability in step count in MS patients who otherwise measure similarly in performance-based disability scores, suggesting that average daily step count in a patient's own environment provides added value in characterizing MS-related disability. These data demonstrate the feasibility, practicality and validity of longer-term continuous monitoring using commercial consumer-friendly accelerometers and build upon a robust literature examining research-grade accelerometers in MS [14].
Discrepancy between daily step count recorded during the 7-day home setting increased between Fitbit and ActiGraph as steps taken per day increased. The Fitbit device we studied is wrist-worn in contrast to the waist-worn ActiGraph. Therefore, it is possible that additional body movements recorded as “steps” accounted for some of this discrepancy. Additionally, participants may have worn the Fitbit during sleep and this discrepancy might also be attributed to additional hours of nighttime wear. Despite the differences in the absolute number of daily steps measured by the Fitbit and the ActiGraph, the excellent ICC between the two devices (0.76) provides gold-standard validation of the Fitbit capturing daily ambulatory activity in MS.
Over 4 weeks of continuous monitoring, study participants demonstrated wide variability in average daily step counts within each EDSS category. As might be expected based on data in healthy subjects (step count cut-points range from sedentary <5000 to highly active <12,500) [30], we observed a wide range of ambulatory activity in people with minimal disability from MS (EDSS: 0–1.5): 2286–18,648 steps per day. However, in people with an EDSS 6.0 (requiring unilateral assistance to walk), we also observed a wide range in daily step count (1096–7152). This variability is substantial and clinically meaningful. For example, an increase of even half this variability, *3000 steps per day, following an intervention (rehabilitative or therapeutic) could lead to a significant improvement in QOL and in participation in social activities, potentially mitigate sedentary-related comorbidities (osteoporosis, cardiovascular health) [8, 27] and may help reverse deconditioning [31]. The observed excess of variability in average daily step count beyond that associated with in-clinic performance-based walking measures and patient-reported outcomes, suggests that step count represents a measure of functioning not captured by conventional metrics. In fact, the current measures traditionally accepted by the United States Food and Drug Administration as end points in MS clinical trials may not be sufficiently sensitive or granular to capture otherwise meaningful changes in ambulatory function expected in neuroprotective, reparative and progressive MS trials. Daily step count warrants further evaluation as an outcome measure in MS clinical trials and could provide an assessment of daily ambulatory function over the course of the trial rather than the snapshots of function currently captured by clinic-based assessments.
Participants with greater disability (higher EDSS score), worse mobility and balance (longer TUG time), slower walking velocities (longer T25FW time), and poorer walking “endurance” (less 2MW distance) exhibited fewer average daily steps during 4 weeks of continuous monitoring. These results are remarkably comparable to previously published data using research-grade accelerometers (i.e., ActiGraph, StepWatch Activity Monitors) in people with MS measured over shorter epochs [32–34]; for example, in a sample of 21 people with MS (11 without and 10 with ambulatory disability) monitored using Step Activity Monitors for up to 7 days, the strongest correlations were between the number of steps and EDSS score (q = -0.90, p < 0.01) [32]. These outcomes are similar to the associations with EDSS in the current study, although a larger number of participants and wider range of disability results in greater residual variability (q = -0.71, p < 0.001).
The average daily step count in our cohort (∼5478 steps per day), is consistent with previous studies in MS [32], and would be categorized as “low physical activity” within the medical literature on physical activity [30]. A preliminary report using a Fitbit One linked to an online MS patient network and using patient-reported outcomes reported low daily step counts (mean of 4671, SD 2639), and moderate associations (r = -0.44, p < 0.001) between step count and severity of patient-reported disability (Multiple Sclerosis Rating Scale) [35]. Taken together with this study, these observations highlight the potential for using commercially available activity monitors to measure real-world ambulatory function in people with MS and possibly intervene in a timelier manner.
Strengths of our study include stringent neurologist-documented phenotyping of MS diagnosis and disease subtype, inclusion of participants across a range of ambulatory MS-related disability, assessment of performance-based ambulation metrics by a physical therapist, continuous measurement over 4 weeks, and standardized operating procedures for quality control. Four weeks of monitoring is likely too short of a period to show sub-stantial loss of ambulatory function. Larger numbers of participants and longer-term follow-up will be needed to explore factors that might predict decreased ambulatory activity and progression of MS. We are also unable to determine causality and directions of association based on this dataset. Furthermore, commercially available activity monitors are largely restricted to step count measurement, limiting more in-depth analysis of gait kinematics (i.e., base of support and step length).
Our results reveal several clinically valuable insights for future MS research and care. First, step count via consumer-friendly activity monitors has the potential to be used as an economical and objective outcome metric for MS care and clinical rehabilitation. Second, continuous step count monitoring could serve as an outcome measure for interventional clinical trials in MS to measure clinically meaningful changes in ambulatory function in the natural environment. Finally, assessing patterns of change in average daily step count and associations with MS symptoms may allow for greater understanding and prediction of changes in ambulatory activity, which will be helpful for planning rehabilitative and reparative interventions in MS.
Acknowledgments
We thank Dan Robeson, DPT, and Patrick Sullivan, DPT, for assistance with data collection in the clinic.
Footnotes
Compliance with ethical standards: Disclosures: Valerie J Block has no disclosures.
Antoine Lizée has no disclosures.
Elizabeth Crabtree-Hartman has received educational grants from the MS Foundation, Teva neurosciences, and Biogen. She has served as a consultant to Genzyme, Teva and Novartis. She is on the Speakers Bureau for Genzyme, Teva and Biogen.
Carolyn J Bevan has no disclosures.
Jennifer Graves has current research grants from Race to Erase MS, National MS Society, Genentech, and Biogen.
Riley Bove has no disclosures.
Ari Green has received research grants from the NMSS, NIH, Novartis and Inception 5 Sciences. He has served on an end point adjudication committee for Mediimmune and a steering committee for OCTIMs. He has served as an expert witness for Mylan and Amneal. He also is on the Scientific Advisory Board of Bionure and Inception Sciences.
Matthew Tremblay has no disclosures.
Bardia Nourbakhsh has received research support from American Brain Foundation, Biogen and National MS Society.
Pierre-Antoine Gourraud has no disclosures.
Madelena Ng has no disclosures.
Jeffrey Olgin has no disclosures. Gregory M Marcus has no disclosures.
Jeffrey M Pletcher has no disclosures.
Diane D Allen has received compensation as an instructor for the Neurologic Physical Therapy Residency Program at Kaiser Redwood City. She has also received compensation for co-developing an online continuing education course in rehabilitation for people with multiple sclerosis for Western Schools.
Bruce C Cree has received personal compensation for consulting from Abbvie, Biogen, EMD Serono, MedImmune, Novartis, Sanofi Genzyme, Shire and Teva.
Jeffrey M Gelfand has received personal compensation for consulting on a scientific advisory board for MedImmune and Genentech, research support to UCSF from Quest Diagnostics for development of a dementia care pathway, and personal compensation for medical legal consulting as an expert witness.
Study funding National Center for Advancing Translational Sciences of NIH (KL2TR000143) (JMG).
References
- 1.Hauser SL, Goodin DS. Multiple Sclerosis and Other Demyelinating Diseases. In: Longo DL, Fauci AS, Kasper DL, et al., editors. Harrison's Principles of Internal Medicine. 18th. Vol. 33. McGraw-Hill Global Education Holdings, LLC; 2012. http://accessmedicine.mhmedical.com/book.aspx?bookId=331. [Google Scholar]
- 2.Dlugonski D, Pilutti LA, Sandroff BM, et al. Steps per day among persons with multiple sclerosis: variation by demographic, clinical, and device characteristics. Arch Phys Med Rehabil. 2013;94(8):1534–1539. doi: 10.1016/j.apmr.2012.12.014. published Online First: 2013/02/20. [DOI] [PubMed] [Google Scholar]
- 3.Klaren RE, Motl RW, Dlugonski D, et al. Objectively quantified physical activity in persons with multiple sclerosis. Arch Phys Med Rehabil. 2013;94(12):2342–2348. doi: 10.1016/j.apmr.2013.07.011. published Online First: 2013/08/03. [DOI] [PubMed] [Google Scholar]
- 4.Motl RW, Pilutti LA, Learmonth YC, et al. Clinical importance of steps taken per day among persons with multiple sclerosis. PLoS One. 2013;8(9):e73247. doi: 10.1371/journal.pone.0073247. published Online First: 2013/09/12. [DOI] [PMC free article] [PubMed] [Google Scholar]
- 5.Motl RW, Sandroff BM, Suh Y, et al. Energy cost of walking and its association with gait parameters, daily activity, and fatigue in persons with mild multiple sclerosis. Neurorehabil Neural Repair. 2012;26(8):1015–1021. doi: 10.1177/1545968312437943. published Online First: 2012/04/03. [DOI] [PubMed] [Google Scholar]
- 6.Kurtzke J. Rating neurological impairment in multiple sclerosis: an expanded disability status scale (EDSS) Neurology. 1983;33:1444–1452. doi: 10.1212/wnl.33.11.1444. [DOI] [PubMed] [Google Scholar]
- 7.Hobart J, Freeman J, Thompson A. Kurtzke scales revisited: the application of psychometric methods to clinical intuition. Brain J Neurol. 2000;123(Pt 5):1027–1040. doi: 10.1093/brain/123.5.1027. published Online First: 2000/04/25. [DOI] [PubMed] [Google Scholar]
- 8.Fletcher GF, Balady G, Blair SN, et al. Statement on exercise: benefits and recommendations for physical activity programs for all Americans. A statement for health professionals by the Committee on Exercise and Cardiac Rehabilitation of the Council on Clinical Cardiology. American Heart Association Circulation. 1996;94(4):857–862. doi: 10.1161/01.cir.94.4.857. published Online First: 1996/08/15. [DOI] [PubMed] [Google Scholar]
- 9.Andersen LK, Knak KL, Witting N, et al. Two-and 6-minute walk tests assess walking capability equally in neuromuscular diseases. Neurology. 2016;86(5):442–445. doi: 10.1212/wnl.0000000000002332. published Online First: 2016/01/08. [DOI] [PubMed] [Google Scholar]
- 10.Busse ME, Pearson OR, Van Deursen R, et al. Quantified measurement of activity provides insight into motor function and recovery in neurological disease. J Neurol Neurosurg Psychiatry. 2004;75(6):884–888. doi: 10.1136/jnnp.2003.020180. published Online First: 2004/05/18. [DOI] [PMC free article] [PubMed] [Google Scholar]
- 11.Motl R, Sandroff B, Sosnoff J. Commercially available accelerometry as an ecologically valid measure of ambulation in individuals with multiple sclerosis. Expert Rev Neurother. 2012;12:1079–1088. doi: 10.1586/ern.12.74. [DOI] [PubMed] [Google Scholar]
- 12.Motl RW, McAuley E, Sandroff BM. Longitudinal change in physical activity and its correlates in relapsing-remitting multiple sclerosis. Phys Ther. 2013;93(8):1037–1048. doi: 10.2522/ptj.20120479. published Online First: 2013 Apr 18. [DOI] [PubMed] [Google Scholar]
- 13.Motl RW, Dlugonski D, Suh Y, et al. Accelerometry and its association with objective markers of walking limitations in ambulatory adults with multiple sclerosis. Arch Phys Med Rehabil. 2010;91(12):1942–1947. doi: 10.1016/j.apmr.2010.08.011. published Online First: 2010/11/30. [DOI] [PMC free article] [PubMed] [Google Scholar]
- 14.Block VAJ, Pitsch E, Tahir P, et al. Remote physical activity monitoring in neurological disease: a systematic review. PLoS One. 2016;11(4):e0154335. doi: 10.1371/journal.pone.0154335. [DOI] [PMC free article] [PubMed] [Google Scholar]
- 15.Motl RW, McAuley E, Dlugonski D. Reactivity in baseline accelerometer data from a physical activity behavioral intervention. Health Psychol. 2012;31(2):172–175. doi: 10.1037/a0025965. published Online First: 2011/10/26. [DOI] [PubMed] [Google Scholar]
- 16.Balto JM, Kinnett-Hopkins DL, Motl RW. Accuracy and precision of smartphone applications and commercially available motion sensors in multiple sclerosis. Mult Scler J Exp Transl Clin. 2016;2:1–8. doi: 10.1177/2055217316634754. [DOI] [PMC free article] [PubMed] [Google Scholar]
- 17.Polman CH, Reingold SC, Banwell B, et al. Diagnostic criteria for multiple sclerosis: 2010 revisions to the McDonald criteria. Ann Neurol. 2011;69(2):292–302. doi: 10.1002/ana.22366. published Online First: 2011/03/10. [DOI] [PMC free article] [PubMed] [Google Scholar]
- 18.Lublin FD, Reingold SC, Cohen JA, et al. Defining the clinical course of multiple sclerosis: the 2013 revisions. Neurology. 2014;83(3):278–286. doi: 10.1212/wnl.0000000000000560. published Online First: 2014/05/30. [DOI] [PMC free article] [PubMed] [Google Scholar]
- 19.Kieseier BC, Pozzilli C. Assessing walking disability in multiple sclerosis. Mult Scler (Houndmills, Basingstoke, England) 2012;18(7):914–924. doi: 10.1177/1352458512444498. published Online First: 2012/06/29. [DOI] [PubMed] [Google Scholar]
- 20.Sebastiao E, Sandroff BM, Learmonth YC, et al. Validity of the timed up and go test as a measure of functional mobility in persons with multiple sclerosis. Arch Phys Med Rehabil. 2016;97(7):1072–1077. doi: 10.1016/j.apmr.2015.12.031. [DOI] [PubMed] [Google Scholar]
- 21.Rossier P, Wade DT. Validity and reliability comparison of 4 mobility measures in patients presenting with neurologic impairment. Arch Phys Med Rehabil. 2001;82(1):9–13. doi: 10.1053/apmr.2001.9396. published Online First: 2001/03/10. [DOI] [PubMed] [Google Scholar]
- 22.Harris PA, Taylor R, Thielke R, et al. Research electronic data capture (REDCap)—A metadata-driven methodology and workflow process for providing translational research informatics support. J Biomed Inform. 2009;42(2):377–381. doi: 10.1016/j.jbi.2008.08.010. [DOI] [PMC free article] [PubMed] [Google Scholar]
- 23.Hobart JC, Riazi A, Lamping DL, et al. Measuring the impact of MS on walking ability: the 12-Item MS Walking Scale (MSWS-12) Neurology. 2003;60(1):31–36. doi: 10.1212/wnl.60.1.31. published Online First: 2003/01/15. [DOI] [PubMed] [Google Scholar]
- 24.Fischer JS, LaRocca NG, Miller DM, et al. Recent developments in the assessment of quality of life in multiple sclerosis (MS) Mult Scler (Houndmills, Basingstoke, England) 1995;5(4):251–259. doi: 10.1177/135245859900500410. published Online First: 1999/09/01. [DOI] [PubMed] [Google Scholar]
- 25.Patel DP, Elliott SP, Stoffel JT, et al. Patient reported outcomes measures in neurogenic bladder and bowel: a systematic review of the current literature. Neurourol Urodyn. 2016;35(1):8–14. doi: 10.1002/nau.22673. published Online First: 2014/10/21. [DOI] [PubMed] [Google Scholar]
- 26.Fisk JD, Ritvo PG, Ross L, et al. Measuring the functional impact of fatigue: initial validation of the fatigue impact scale. Clin Infect Dis Off Publ Infect Dis Soc Am. 1994;18(Suppl 1):S79–S83. doi: 10.1093/clinids/18.supplement_1.s79. published Online First: 1994/01/01. [DOI] [PubMed] [Google Scholar]
- 27.Jones KH, Ford DV, Jones PA, et al. A large-scale study of anxiety and depression in people with Multiple Sclerosis: a survey via the web portal of the UK MS Register. PLoS One. 2012;7(7):e41910. doi: 10.1371/journal.pone.0041910. published Online First: 2012/08/04. [DOI] [PMC free article] [PubMed] [Google Scholar]
- 28.Balantrapu S, Sosnoff JJ, Pula JH, et al. Leg spasticity and ambulation in multiple sclerosis. Mult Scler Int. 2014;2014:649390. doi: 10.1155/2014/649390. published Online First: 2014/07/08. [DOI] [PMC free article] [PubMed] [Google Scholar]
- 29.Bland JM, Altman DG. Statistical methods for assessing agreement between two methods of clinical measurement. Lancet (London, England) 1986;1(8476):307–310. published Online First: 1986/02/08. [PubMed] [Google Scholar]
- 30.Tudor-Locke C, Bassett DR., Jr How many steps/day are enough? Preliminary pedometer indices for public health. Sports Med (Auckland, NZ) 2004;34(1):1–8. doi: 10.2165/00007256-200434010-00001. published Online First: 2004/01/13. [DOI] [PubMed] [Google Scholar]
- 31.Dalgas U, Stenager E. Exercise and disease progression in multiple sclerosis: can exercise slow down the progression of multiple sclerosis? Ther Adv Neurol Disord. 2012;5(2):81–95. doi: 10.1177/1756285611430719. published Online First: 2012/03/22. [DOI] [PMC free article] [PubMed] [Google Scholar]
- 32.Cavanaugh JT, Gappmaier VO, Dibble LE, et al. Ambulatory activity in individuals with multiple sclerosis. J Neurol Phys Ther JNPT. 2011;35(1):26–33. doi: 10.1097/NPT.0b013e3182097190. published Online First: 2011/04/09. [DOI] [PubMed] [Google Scholar]
- 33.Motl RW, Learmonth YC, Pilutti LA, et al. Validity of minimal clinically important difference values for the multiple sclerosis walking scale-12? Eur Neurol. 2014;71:3–4. 196–202. doi: 10.1159/000356116. published Online First: 2014/01/25. [DOI] [PubMed] [Google Scholar]
- 34.Motl RW, Pilutti L, Sandroff BM, et al. Accelerometry as a measure of walking behavior in multiple sclerosis. Acta Neurol Scand. 2013;127(6):384–390. doi: 10.1111/ane.12036. published Online First: 2012/12/18. [DOI] [PubMed] [Google Scholar]
- 35.McIninch J, Datta S, DasMahapatra P, et al. Remote tracking of walking activity in MS patients in a real-world setting. Neurology; The 67th Annual Meeting took place; April 18–25, 2015; Washington, DC. 2015. p. 3.209. [Google Scholar]