

Abstract
GPR1 is a G protein-coupled receptor that plays critical roles in eukaryotic cells: typically, response to glucose stimulation, lipid accumulation, and transmitting nutrition signals to cAMP pathway. However, the alternative splicing of the GPR1 gene and its expression pattern in chicken tissues and ovarian follicles were unknown. In our current study, we used RACE-PCR to identify three GPR1 variants, including the full-length variant (GPR1-va1) and two alternatively spliced variants (GPR1-va2, GPR1-vb). Quantitative real-time PCR examined the expression pattern of GPR1 mRNA in chicken tissues and ovarian follicles. The result reveals that the coding sequence of the three variants cDNA is 1053, 1053, and 627 bp in length, encoding 350, 350, and 208 amino acids, respectively. The three variants of GPR1 show similar tissue distributions; GPR1 expression was abundant in the abdominal fat, lung, and heart. With the follicular development, the expression of GPR1 gene gradually increased, and GPR1-va1 and GPR1-va2 spliced variants expression in F2 were significantly higher than in F5, F4, and prehierarchical follicles (P < 0.05). Taken together, we found three novel variants of GPR1, and the results of GPR1 expression profiling in adipose tissues and ovarian follicles suggest that GPR1 may play a significant role in the lipid accumulation and progression of follicular development.
1. Introduction
Many signaling transductions are mediated by G protein-coupled receptors (GPCRs) in eukaryon [1]. G protein-coupled receptors exist in eukaryotes, including yeast, choanoflagellates, and animals [2]. GPR1 is a G protein-coupled receptor (GPCR), originally found in human [3], which was identified by in vitro experiment as receptor for chemerin [4, 5]. GPR1 and chemerin are related to adipogenesis [6–9], circadian appetite regulation [10], cell chemotaxis [11], inflammation [6, 12, 13], and phosphorylation of ERK and Akt [14].
Alternative splicing (AS) of pre-mRNA can generate diversity form protein subtypes from a single gene [15–17]. In many instances, coding sequence was affected by alternative splicing, which would result in the production of diverse proteins [18]. Various proteins would be produced due to different open reading frames [19]. In some kind of situation, partly different proteins may have various functions, lacking or having a special function [20]. Recent studies using next generation sequencing have demonstrated that AS could generate huge transcriptional isoforms of mammalian gene [16, 21–23]. Alternative splicing has been demonstrated to act as a major mechanism that modulates gene expression and function of GPCRs [24–26].
In this study, we identified three novel GPR1 splice variants. We designated the novel variants GPR1-va1, GPR1-va2, and GPR1-vb. GPR1-va1 and GPR1-va2 and GPR1-vb use the same translation start codon. However, the CDS of GPR1-vb was different from GPR1-va1 and GPR1-va2, and thus as a result they have different amino acid sequences. We examined the different expression profiling between the three variants in tissue and ovary follicles distribution using qRT-PCR. These data could increase our knowledge of GPR1 mRNA diversity and provides the basis for further functional research.
2. Materials and Methods
2.1. Experimental Animals and Tissue Sampling
Three producing female Lohmann pink tissues (Gallus gallus) in the fiftieth week were selected for sampling from the Experimental Farm for Fowl Breeding at Sichuan Agricultural University (Sichuan, China). These chickens were hatched on the same day and grown under the same natural conditions of light and temperature. Eye, brain, hypothalamus, pituitary, ovary, oviduct, adipose tissues, muscle tissues, POF, lung, spleen, kidney, and ovarian and granulosa cells from 1 to 2, 2 to 3, 3 to 4, 4 to 5, 5 to 6, 6 to 7, 7 to 8, and 8 to 9 mm diameter prehierarchical follicles, and F5–F1 (measuring F1 > F2 > F3 > F4 > F5 in diameter) hierarchical follicles were collected, rapidly frozen in liquid nitrogen, and finally stored at −80°C until RNA extraction. The protocol for bird treatment was in accordance with the Sichuan Agricultural University Council on Animal Care Guidelines.
2.2. Reverse Transcription PCR
Total RNA was extracted from these samples with TRIzol (TaKaRa, Dalian, China). cDNAs were synthesized using a PrimeScript® RT Reagent Kit (TaKaRa, Dalian, China) according to the manufacturer's instructions. In brief, step 1: the 10.0 μL reaction consisted of 1.0 μL of total RNA, 2.0 μL of 5x gDNA Eraser Buffer, 1.0 μL of gDNA Eraser, and 5.0 μL of RNase-Free dH2O. Thermal cycling was executed for 2 min at 42°C. Step 2: the 20.0 μL reaction consisted of 10 μL the reaction solution from step 1, 1.0 μL of PrimeScript RT Enzyme Mix I, 1.0 μL of RT Primer Mix, 4.0 μL of 5x PrimeScript Buffer 2 (for Real Time), and 4.0 μL of RNase-Free dH2O. Thermal cycling was executed for 15 min at 37°C and then 5 sec at 85°C.
2.3. 5′-/3′-Rapid Amplification of cDNA Ends-PCR
Total RNA was extracted from mix sample (hypothalamus, pituitary, oviduct, adipose tissues, and muscle tissues) with RNeasy Mini Kit (Qiagen, German) and subsequently processed with the SMART-rapid amplification of cDNA ends (RACE) cDNA Amplification Kit (Clontech, USA). RACE-PCR were carried out using 1.5 μL of 5-fold diluted 3′-RACE (or 5′-RACE)-ready cDNA as template in a 50 μL under the following cycling conditions: The first-round PCR: 94°C for 3 min; 5 cycles at 94°C for 30 s and 72°C for 4 min; 5 cycles at 94°C for 30 s, 70°C for 30 s, and 72°C for 4 min; 25 cycles at 94°C for 30 s, 68°C for 30 s, and 72°C for 4 min; the second-round PCR: 94°C for 3 min and 16 cycles at 94°C for 30 s, 68°C for 30 s, and 72°C for 4 min; the third-round PCR: 94°C for 3 min and 25 cycles at 94°C for 30 s, 68°C for 30 s, and 72°C for 4 min. Detailed information on the RACE-PCR primers (1.1–3.3) is provided in Table 1.
Table 1.
Primers used to study GPR1.
| S. number | Primer name | Sequence (5′- to 3′-end) | Source | Purpose |
|---|---|---|---|---|
| 1.1 | GR1-5′-1 | CAGATGACAATGGCATTGCCTGGGACTC | Conserved domains of published sequences (XM_015289515.1, 971405019) | To obtain 5′-UTR and 3′-UTR |
| 1.2 | GR1-5′-2 | TATGGGCAATGCTGAGGGTGGACTGG | ||
| 1.3 | GR1-5′-3 | CTTCCTCAGGCAGGTCATAGAAATAAGAGTAG | ||
| 2.1 | UPM-long | ATAGGGCAAGCAGTGGTATCAACGCAGAGT | ||
| UPM-short | ATAGGGC | |||
| 3.1 | GR1-3′-1 | GAGGAAGGCAGTAGCCAAGTGAAGCAGC | ||
| 3.2 | GR1-3′-2 | CACACTGAAGTCACTCTGAACTCTACAGATCACT | ||
| 3.3 | GR1-3′-3 | GCTACAGAGAGCACATCCCTGACTTACAGTGT | ||
|
| ||||
| 4.1 | GPR1-va-F | TGACTGTTCATCACCATCCATCT | To measure expression levels of GPR1-va and GPR1-vb by qRT-PCR, respectively | |
| 4.2 | GPR1-va-R | ATGCTGCAACCGCACCAC | ||
| 5.1 | GPR1-vb-F | TGTCACCATTTGCTACAAAATAGC | ||
| 5.2 | GPR1-vb-R | ATGCTGCAACCGCACCAC | ||
|
| ||||
| 6.1 | β-Actin-F2 | TGTGCTGTCCCTGTATGCCTC | Specific regions of Gallus gallusβ-actin (L08165.1) Specific regions of Gallus gallus GAPDH (NM_204305.1) |
|
| 6.2 | β-Actin-R2 | GGAGGGCGTAGCCTTCATAGA | ||
| 7.1 | GAPDH-F | CCAGAACATCATCCCAGCGTC | ||
| 7.2 | GAPDH-R | ACGGCAGGTCAGGTCAACAA | ||
2.4. Quantitative Real-Time PCR
Total RNA was isolated from these samples of each hen with TRIzol reagent (TaKaRa, Dalian, China). Approximately 1 μg of DNase-treated RNA from each sample was reverse transcribed with a cDNA Synthesis Kit. The cDNA samples were diluted 4-fold and subjected to qRT-PCR on a C1000™ Thermal Cycler (Bio-Rad, CA, USA). Each qRT-PCR was performed in a 25 μL volume containing 1.5 μL of diluted cDNA, 12.5 μL of 2x SYBR Premix Ex-Taq II (TaKaRa, Dalian, China), and 1.2 μL of variant-specific primer pair mix (10 pmol/μL each primer). All variant-specific primer pairs were run with the same cycling conditions: 95°C for 30 s followed by 46 cycles of 95°C for 5 s and 60°C for 30 s with a final melting curve analysis (from 65°C to 95°C at a rate of 0.5°C per 5 s). The melting curve analyses showed that the amplification efficiency of each variant-specific primer pair was higher than 97%. Negative and positive controls were included in each experiment as quality control and threshold cycle (Ct) calibration steps.
The expression levels of the target genes were calculated using geNORM algorithms [27] based on the geometric means of two reference genes: β-actin and GAPDH. Each sample was run in triplicate.
Detailed information on the qRT-PCR primers (4.1–7.2) is provided in Table 1.
2.5. Cloning and Sequencing of PCR Products
Following amplification, RACE-PCR products were purified with TaKaRa MiniBEST DNA Fragment Purification Kit Ver 4.0 (TaKaRa, Dalian, China). The purified PCR products were performed in a 50 μL volume containing 30 μL of cDNA and 0.25 μL of Ex-Taq (TaKaRa, Dalian, China) under the following cycling conditions: 94°C for 3 min and 30 cycles at 98°C for 10 s and 68°C for 4 min and 72°C for 5 min. Following amplification, products were purified with TaKaRa MiniBEST DNA Fragment Purification Kit Ver 4.0 (TaKaRa, Dalian, China). The purified PCR products were ligated into a pMD-19 T vector (TaKaRa, Dalian, China). Positive clones were selected by sequencing, which was performed by the Shanghai Invitrogen Biology Company. Finally, the T-A clone products of GPR1 were directly sequenced by the Chengdu Tsingke Biological Engineering Technology.
2.6. Sequence Analysis
All primers were designed using Primer Premier 5.0 software and synthesized by Chengdu Tsingke Biology Company. cDNA and DNA segments obtained from sequencing were edited, assembled, and aligned with Editseq, Seqman and MegAlign, respectively, in Lasergene 7.1 software (DNASTAR, Madison, WI, USA). The transmembrane helices were predicted by TMHMM (http://www.cbs.dtu.dk/services/TMHMM-2.0). The GPR1 sequences of other vertebrates (retrieved from GenBank) were aligned using ClustalW software (version 1.7; DDBJ). The phylogenetic tree constructed from the alignment was generated with the neighbor-joining method using Molecular Evolutionary Genetic Analysis (MEGA) software version 5.1 (http://www.megasoftware.net/), followed by phylogeny tests with 1000-bootstrap replicates. Spidey (http://www.ncbi.nlm.nih.gov/IEB/Research/Ostell/Spidey/) was used to analyze AS patterns. Open reading frames (ORFs) and translated proteins were predicted using the ORF Finder in NCBI. Proteins 3D structures were created using the I-TASSER server (http://zhanglab.ccmb.med.umich.edu/I-TASSER/) [28–30] and Rosetta server (http://robetta.bakerlab.org/) [31] and visualized using PyMOL [32].
2.7. Statistical Analysis
All data were analyzed by a one-way analysis of variance (ANOVA), which was followed by Duncan's multiple range test, using the SAS 9.0 statistical software for Windows (SAS Institute Inc., USA). Values were expressed as the mean ± SEM, n = 3. Differences were considered significant at P < 0.05.
3. Results
3.1. Analysis of GPR1 Variants Sequence Characteristics
3.1.1. Multiple GPR1 Variants
To investigate chicken GPR1, we cloned splice variants of GPR1 by RACE-PCR. We obtained three full-length mRNA sequences alternative splice variants (Figure 1). Similarity analysis identified three GPR1 variants: GPR1-va1 (KX156840), GPR1-va2 (KX156841), and GPR1-vb (KX156842).
Figure 1.

Gel electrophoresis images of GPR1 RACE-PCR products. PCR products were amplified with nested PCR. Gel pictures analysis suggesting the presence of multiple GPR1 variants. Note a single band in 5′-RACE-PCR and multiple amplicons in 3′-RACE-PCR. The PCR products of GPR1 were separated on 1% agarose gel following electrophoresis and visualized with ethidium bromide. “MTs” represents mixtures of cDNA (hypothalamus, pituitary, oviduct, adipose tissues, and muscle tissues). Round 1, Round 2, and Round 3 represent the first-round PCR, the second-round PCR, and the third-round PCR, respectively.
BLASTn alignments showed that although all variants are most similar to vertebrate GPR1, GPR1-va1 shows the highest similarity to GPR1 mRNA, with 99%, 94%, 93%, and 86% similarity to Meleagris gallopavo, Anser cygnoides, Anas platyrhynchos, and Coturnix Japonica, respectively. In addition, MegAlign analysis suggests that they are all splice variants.
Phylogenetic tree analysis using GPR1-va1 sequences from other vertebrate species has shown that the chicken GPR1-va1 is most closely related to the GPR1 sequence in Meleagris gallopavo followed by those in Anser cygnoides and Taeniopygia guttata (Figure 2).
Figure 2.
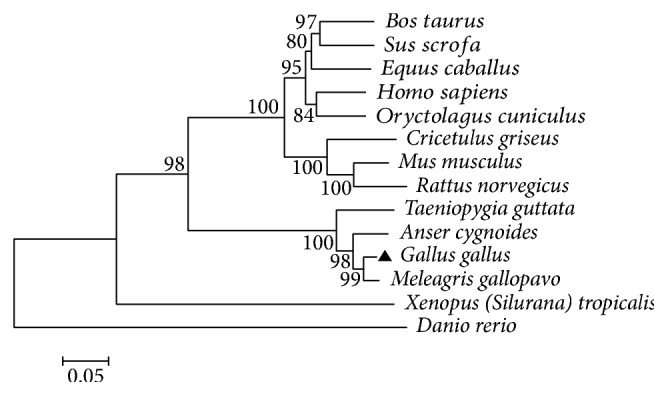
The phylogenetic tree of GPR1 sequence from different vertebrate species. Neighbor-joining analysis based on the Poisson correction model with 1000-bootstrap replicates was performed using MEGA 5.1 software. Numbers at each branch indicate the percentage of times a node was supported in 1000-bootstrap replicates. The species names and GenBank accession numbers of the GPR1 sequences shown are as follows: Anser cygnoides (XM_013171695.1), Bos Taurus (XM_005202718.3), Cricetulus griseus (XM_003502119.1), Danio rerio (XM_001343478.5), Equus caballus (XM_014732609.1), Gallus gallus (XM_004942654.2), Homo sapiens (NM_001261453.1), Meleagris gallopavo (XM_010713490.1), Mus musculus (XM_011238518.1), Oryctolagus cuniculus (XM_008259021.1), Rattus norvegicus (XM_008767077.1), Sus scrofa (XM_013984415.1), Taeniopygia guttata (XM_012574956.1), and Xenopus (Silurana) tropicalis (XM_004917751.2).
3.1.2. Structural Analysis of GPR1 Variants
Spidey analysis revealed that GPR1 comprises two exons and one intron (Figure 4(a)). All three GPR1 variants are generated from a single sequence through different splicing modes (Figure 4(b)). In addition, all splicing modes are consistent with the canonical 5′-GU—AG 3′-donor—acceptor splice site pairs rule. ORF Finder and Spidey analysis of the three GPR1 variants showed that although each variant has an identical short 5′-UTR (untranslated region), the CDS and 3′-UTRs vary significantly in size, ranging from 627 to 1053 bp and 1139 to 1634 bp, respectively (Figure 4(b) and Table 2).
Figure 4.

Structure analysis of GPR1. (a) Structure analysis of the GPR1 genomic locus (GPR1). Exons were denoted by thick boxes marked “E1, E2” with different colors. Introns were denoted as solid lines and annotated I1. Unknown region was marked “”; the size of an exon or intron was indicated by a number above the exon or intron. (b) Structure analysis of GPR1 variants (GPR1-va1, GPR1-va2 and GPR1-vb). The splicing model was labeled as 3′-ATSS (E2) (3′-alternative tailing site selection in exon 2) and intron retention in exon 2. The UTR (untranslated region) and poly(A) (polyadenylation site) of each variant were indicated by thin colored boxes and “AA…”, respectively. CDS (coding sequence) was denoted by a thick colored box; GPR1-va1 and GPR1-va2 have the same coding sequence. (c) Transmembrane domain prediction of putative proteins encoded by three GPR1 variants. GPR1-va1 and GPR1-va2 exhibited typical type GPCR features consisting of an extracellular N-terminus, 3 intracellular and extracellular loops, and 7 transmembrane a-helical domains. GPR1-vb was truncated protein, with 4 transmembrane domains. Detailed information for (c) is shown in Figure 3.
Table 2.
Sequence analysis of three GPR1 variants.
| Isoform | Total length (nt) |
5′-UTR length (nt) |
CDS length (nt) |
3′-UTR length (nt) |
Poly(A) length (nt) |
|---|---|---|---|---|---|
| GPR1-va1 | 2875 | 160 | 1053 | 1634 | 28 |
| GPR1-va2 | 2377 | 160 | 1053 | 1139 | 25 |
| GPR1-vb | 2343 | 160 | 627 | 1528 | 28 |
I-TASSER (Figure 4(c)), Rosetta (supplementary Fig. 1B, in Supplementary Material available online at https://doi.org/10.1155/2017/1074054), TMHMM, and DNAMAN (Figure 3) comparison of the putative GPR1 receptors encoded by these variants revealed that GPR1 exhibits the typical type A GPCR features including seven transmembrane a-helical domains connected by three extracellular and three intracellular loops. However, GPR1-vb variants were all truncated proteins, with partial transmembrane domains from type A GPCRs. GPR1-vb spanned 627 bp and encoded 208 amino acids, which share 90.4% similarity with GPR1-va (GPR1-va1 and GPR1-va2 contain the same amino acid sequence).
Figure 3.

Amino acid sequence alignment of GPR1-va1, GPR1-va2, and GPR1-vb. Sequences of GPR1-va1, GPR1-va2, and GPR1-vb were aligned by DNAMAN. Putative transmembrane domains were shaded in grey.
3.2. Expression Analysis of GPR1 Variants mRNA in Lohmann Pink Tissues
qRT-PCR analysis showed GPR1 variants mRNA expression in all tissues (Figure 5). The highest expression level of GPR1-va (GPR1-va1 and GPR1-va2 have the same coding sequence) in the Lohmann pink tissues was detected in the abdominal fat and lung (P < 0.05). GPR1-vb mRNA expression in the abdominal fat was also significantly high compared to other tissues (P < 0.05). In contrast, the lowest expression level was observed in the hypothalamus (P < 0.05).
Figure 5.

Tissue distribution of GPR1 splice variants. Expression profiling of GPR1 in the Lohmann pink tissues. The relative levels of expression for GPR1 were calculated relative to GAPDH and β-actin using 2−ΔΔCt method. Values are mean ± SEM, n = 3. The significance of differences in the levels of expression of GPR1 mRNA was determined by ANOVA. Means with the same letter are not significantly different (P < 0.05).
qRT-PCR revealed GPR1 variants expression in different follicles of the Lohmann pink ovary (Figure 6). GPR1 transcripts were detected in all experimental hierarchical follicles and prehierarchical follicles of the Lohmann pink ovary. With follicular development, GPR1-va expression levels gradually increased, with levels in F2 significantly higher than that in F4, F5, and prehierarchical follicles (P < 0.05). There was also a high expression of GPR1-vb in the F2 compared to 1 to 2, 2 to 3, and 3 to 4 mm diameter prehierarchical follicles (P < 0.05). The lowest GPR1-va and GPR1-vb gene expression were detected in 1 to 2 mm diameter prehierarchical follicles (1-2 mm).
Figure 6.

Expression profiling of GPR1 splicing variants in the hierarchical and prehierarchical follicles of Lohmann pink ovary. The relative levels of expression for GPR1 were calculated relative to GAPDH andβ-actin using 2−ΔΔCt method. Values are mean ± SEM, n = 3. The significance of differences in the levels of expression of GPR1 mRNA was determined by ANOVA. Means with the same letter are not significantly different (P < 0.05).
4. Discussion
Previous studies on GPR1 mainly used rodent animal models and little was known about the molecular characteristics in aves such as chicken. In this study, we identified three novel GPR1 splice variants that have partially different CDS and 3′-UTR from the GPR1 originally reported. GPR1-va1, GPR1-va2, and GPR1-vb are alternatively spliced variants. mRNA for GPR1-va1 uses exon 1 and exon 2, mRNA for GPR1-va2 lacks a segment sequence in 3′-UTR (Figure 4(b)), and mRNA for GPR1-vb lacks a segment sequence in CDS (Figure 4(b)). Interestingly, we compared the forecasting method of I-TASSER and Rosetta, and we find some differences in 3D structure (Figure 4(c) and supplementary Fig. 1B). Perhaps the main reason is that I-TASSER and Rosetta adopted TBM+FM and FM forecasting method, respectively [33]. The differently three-dimensional structure of the protein determines the different function of protein; therefore, improving the performance of protein structure prediction algorithm is a key technique in the further study. To date, many GPCRs splice variants have been reported invertebrates [26, 34–36]. Alternative splicing (AS) that generates complexity before mRNA can produce distinct mRNA and protein isoforms [37, 38]. AS could result in physiological diversity such as differences in tissue distribution, ligand-binding properties, signaling pathways, and coupling efficiency with Gα protein [39]. The tissues distributed of GPR1-va (GPR1-va1 and GPR1-va2) is similar with GPR1-vb. But GPR1-va was more abundantly expressed (Figures 5 and 6).
Because GPR1-va1, GPR1-va2, and GPR-vb use the same transcription initiation site, the ratio of mRNAs for GPR1-va1, GPR1-va2, and GPR-vb may be determined by posttranscriptional regulation, such as splicing efficiency and mRNA stability [40, 41]. The stability of the mRNA may be different between GPR1-va1, GPR1-va2, and GPR-vb. Splicing is regulated by several factors such as splice site recognition, splicing regulators, and RNA secondary structure [42–44]. In vertebrate genes, splice sites are not well conserved, which allows alternative splicing to occur frequently [45]. If introns are retained within the CDS, the site of a stop codon would contribute to the production of a truncated peptide (if inserted close to the 3′-end) or the absence of a protein product (if inserted downstream of the start codon) [46]. In our study, the stop codon of GPR1-vb was not changed relative to GPR1-va1 and GPR1-va2; we found that the translatability of about 426 nucleotides might indeed be interrupted by the retention of an intron in the CDS. This type of event was typically disregarded owing to the absence of protein products; however, intron retention might also contribute to the diversification of the information carried by genes, by producing functional RNA [47].
GPR1 is ubiquitously expressed in most tissues, and GPR1 expression profile is the same as swine [6] and mouse [10, 48]. In our study, GPR1-va and GPR-vb mRNA were expressed in all tissues examined and in a highly tissue-specific manner in the Lohman pink tissues. The high levels of GPR1-va and GPR1-vb were detected in the adipose tissue which implicates its potential key role in regulating chicken adipocyte development. In addition, GPR1-va and GPR1-vb mRNA were expressed at the highest levels in the abdominal fat, followed by muscle, lung, subcutaneous fat, heart, eye, and other tissues, which confirmed GPR1 mRNA tissue-specific expression in different chicken tissues. This result is coincident with previous studies in mouse (gender and age not indicated, obese mice) [10, 49]. However, the highest GPR1 mRNA expression level is found in the kidney of pig (males, 2.5 months old) [6] and in the skeletal muscle of mouse (gender and age not indicated, obese/diabetic mice) [50]. Therefore, we cannot eliminate the possibility that GPR1-va1/GPR1-va2/GPR1-vb shows different expression patterns in species-, gender-, or temporal-specific profiles or that it shows different functions within the adipose tissue.
In our current study, GPR1-va1, GPR1-va2, and GPR-vb expression gradually increased with follicular development, suggesting that GPR1-va1, GPR1-va2, and GPR-vb may regulate follicular development in the Lohman pink tissues. However, the level of GPR1-va1, GPR1-va2, and GPR-vb expression was highest in the F2 than in the other follicles (prehierarchical follicles, F5, F4, F3, F1, and POF). Previous studies showed that the high level of GPR1 was detected in subcutaneous fat [6], which speculated that GPR1 could play a role in lipid accumulation. Moreover, lipid and lipid metabolism play a crucial role in cell survival and proliferation [51, 52]. In addition, GPR1 and CMKLR1 are the coreceptors for chemerin, and they have the closest phylogenetic relationship in the family of chemoattractant receptors [6, 53]. Goralski et al. study suggested that chemerin and CMKLR1 could regulate adipogenesis and adipocyte metabolism through ERK1/2 signaling pathway [54]. Various follicle classes have different lipid characteristics [55]; by adding GPR1 antibody and PI3K signaling inhibitor we find that the chemerin/GPR1 and PI3K signaling pathways may be involved in follicular development [56]. Therefore, GPR1 is the only known receptor for chemerin which also may regulate the follicular development through regulating follicular lipid accumulation. In this study, expression of GPR1 showed an increased tendency gradually with follicular growth; however, the expression of GPR1 tends to decrease in the F1, suggesting that follicular internal environment may be changed such as lipid metabolism. Interestingly, study on GPR1 KO mice speculated that CMKLR1 compensated for the loss of GPR1 function [10]. As such future studies examine follicular development and lipid metabolism through both CMKLR1 and GPR1 when investigating the signal transduction mechanisms of chemerin function.
5. Conclusion
In this study, we cloned three alternative splice variants of GPR1 full-length mRNA sequences from Lohmann pink tissues. The GPR1 transcript was widely distributed in various tissues. With follicular development, GPR1 gene expression gradually increased; GPR1-va expression in F2 was significantly higher than in F5. The results of the GPR1 expression profiling of ovarian follicles suggested that GPR1 plays key role in follicular development through regulating the lipid levels. Therefore, our findings increase our knowledge of GPR1 mRNA diversity and provide a solid basis for further molecular mechanism research.
Supplementary Material
I-TASSER and Rosseta to predict the 3D structure of GPR1
Acknowledgments
This work was supported by the China Agriculture Research System (CARS-41) and the Twelfth Five-Year Plan for breeding programs in Sichuan—selective breeding of new breeds and the synthetic strains in laying hens (2011NZ0099-7).
Competing Interests
The authors declare that they have no competing interests.
References
- 1.Vauquelin G., von Mentzer B. G Protein-Coupled Receptors. 2007. (G Protein-Coupled Receptors: Molecular Pharmacology from Academic Concept to Pharmaceutical Research). [Google Scholar]
- 2.King N., Hittinger C. T., Carroll S. B. Evolution of key cell signaling and adhesion protein families predates animal origins. Science. 2003;301(5631):361–363. doi: 10.1126/science.1083853. [DOI] [PubMed] [Google Scholar]
- 3.Marchese A., Docherty J. M., Nguyen T., et al. Cloning of human genes encoding novel G protein-coupled receptors. Genomics. 1994;23(3):609–618. doi: 10.1006/geno.1994.1549. [DOI] [PubMed] [Google Scholar]
- 4.Zabel B. A., Nakae S., Zúñiga L., et al. Mast cell–expressed orphan receptor CCRL2 binds chemerin and is required for optimal induction of IgE-mediated passive cutaneous anaphylaxis. The Journal of Experimental Medicine. 2008;205(10):2207–2220. doi: 10.1084/jem.20080300. [DOI] [PMC free article] [PubMed] [Google Scholar]
- 5.Barnea G., Strapps W., Herrada G., et al. The genetic design of signaling cascades to record receptor activation. Proceedings of the National Academy of Sciences of the United States of America. 2008;105(1):64–69. doi: 10.1073/pnas.0710487105. [DOI] [PMC free article] [PubMed] [Google Scholar]
- 6.Huang J., Zhang J., Lei T., et al. Cloning of porcine chemerin, ChemR23 and GPR1 and their involvement in regulation of lipogenesis. BMB Reports. 2010;43(7):491–498. doi: 10.3858/BMBRep.2010.43.7.491. [DOI] [PubMed] [Google Scholar]
- 7.Goralski K. B., McCarthy T. C., Hanniman E. A., et al. Chemerin, a novel adipokine that regulates adipogenesis and adipocyte metabolism. Journal of Biological Chemistry. 2007;282(38):28175–28188. doi: 10.1074/jbc.M700793200. [DOI] [PubMed] [Google Scholar]
- 8.Takahashi M., Okimura Y., Iguchi G., et al. Chemerin regulates β-cell function in mice. Scientific Reports. 2011;1, article 123 doi: 10.1038/srep00123. [DOI] [PMC free article] [PubMed] [Google Scholar]
- 9.Regard J. B., Sato I. T., Coughlin S. R. Anatomical profiling of G protein-coupled receptor expression. Cell. 2008;135(3):561–571. doi: 10.1016/j.cell.2008.08.040. [DOI] [PMC free article] [PubMed] [Google Scholar]
- 10.Rourke J. L., Muruganandan S., Dranse H. J., McMullen N. M., Sinal C. J. Gpr1 is an active chemerin receptor influencing glucose homeostasis in obese mice. Journal of Endocrinology. 2014;222(2):201–215. doi: 10.1530/joe-14-0069. [DOI] [PubMed] [Google Scholar]
- 11.Rourke J. L., Dranse H. J., Sinal C. J. CMKLR1 and GPR1 mediate chemerin signaling through the RhoA/ROCK pathway. Molecular and Cellular Endocrinology. 2015;417:36–51. doi: 10.1016/j.mce.2015.09.002. [DOI] [PubMed] [Google Scholar]
- 12.Albanesi C., Scarponi C., Pallotta S., et al. Chemerin expression marks early psoriatic skin lesions and correlates with plasmacytoid dendritic cell recruitment. Journal of Experimental Medicine. 2009;206(1):249–258. doi: 10.1084/jem.20080129. [DOI] [PMC free article] [PubMed] [Google Scholar]
- 13.Shimizu N., Soda Y., Kanbe K., et al. An orphan G protein-coupled receptor, GPR1, acts as a coreceptor to allow replication of human immunodeficiency virus types 1 and 2 in brain-derived cells. Journal of Virology. 1999;73(6):5231–5239. doi: 10.1128/jvi.73.6.5231-5239.1999. [DOI] [PMC free article] [PubMed] [Google Scholar]
- 14.Le Touz N., Dumoulin J., Soldovieri F. Numerical study of the coupling of two identification methods—thermal and electromagnetic—for the reconstruction of inclusions in thick walls. Proceedings of the European Geosciences Union General Assembly; April 2016; Vienna, Austria. [Google Scholar]
- 15.Woodley L., Valcárcel J. Regulation of alternative pre-mRNA splicing. Briefings in Functional Genomics and Proteomics. 2002;1(3):266–277. doi: 10.1093/bfgp/1.3.266. [DOI] [PubMed] [Google Scholar]
- 16.Pan Q., Shai O., Lee L. J., Frey B. J., Blencowe B. J. Deep surveying of alternative splicing complexity in the human transcriptome by high-throughput sequencing. Nature Genetics. 2008;40(12):1413–1415. doi: 10.1038/ng.259. [DOI] [PubMed] [Google Scholar]
- 17.Fedor M. J. Alternative splicing minireview series: combinatorial control facilitates splicing regulation of gene expression and enhances genome diversity. Journal of Biological Chemistry. 2008;283(3):1209–1210. doi: 10.1074/jbc.r700046200. [DOI] [PubMed] [Google Scholar]
- 18.Black D. L. Protein diversity from alternative splicing: a challenge for bioinformatics and post-genome biology. Cell. 2000;103(3):367–370. doi: 10.1016/s0092-8674(00)00128-8. [DOI] [PubMed] [Google Scholar]
- 19.Wen J., Brogna S. Splicing-dependent NMD does not require the EJC in Schizosaccharomyces pombe. EMBO Journal. 2010;29(9):1537–1551. doi: 10.1038/emboj.2010.48. [DOI] [PMC free article] [PubMed] [Google Scholar]
- 20.Ogawa A., Obinata H., Hattori T., et al. Identification and analysis of two splice variants of human G2A generated by alternative splicing. The Journal of Pharmacology and Experimental Therapeutics. 2010;332(2):469–478. doi: 10.1124/jpet.109.158758. [DOI] [PubMed] [Google Scholar]
- 21.Wang E. T., Sandberg R., Luo S., et al. Alternative isoform regulation in human tissue transcriptomes. Nature. 2008;456(7221):470–476. doi: 10.1038/nature07509. [DOI] [PMC free article] [PubMed] [Google Scholar]
- 22.Alam S., Phan H. T. T., Okazaki M., et al. Computational extraction of a neural molecular network through alternative splicing. BMC Research Notes. 2014;7(1, article 934) doi: 10.1186/1756-0500-7-934. [DOI] [PMC free article] [PubMed] [Google Scholar]
- 23.Xie B.-B., Li D., Shi W.-L., et al. Deep RNA sequencing reveals a high frequency of alternative splicing events in the fungus Trichoderma longibrachiatum. BMC Genomics. 2015;16(1, article no. 54) doi: 10.1186/s12864-015-1251-8. [DOI] [PMC free article] [PubMed] [Google Scholar]
- 24.Lee H. J., Wall B., Chen S. G-protein-coupled receptors and melanoma. Pigment Cell & Melanoma Research. 2008;21(4):415–428. doi: 10.1111/j.1755-148x.2008.00478.x. [DOI] [PMC free article] [PubMed] [Google Scholar]
- 25.Markovic D., Challiss R. A. J. Alternative splicing of G protein-coupled receptors: physiology and pathophysiology. Cellular and Molecular Life Sciences. 2009;66(20):3337–3352. doi: 10.1007/s00018-009-0093-4. [DOI] [PMC free article] [PubMed] [Google Scholar]
- 26.Oladosu F. A., Maixner W., Nackley A. G. Alternative splicing of G protein-coupled receptors: relevance to pain management. Mayo Clinic Proceedings. 2015;90(8):1135–1151. doi: 10.1016/j.mayocp.2015.06.010. [DOI] [PMC free article] [PubMed] [Google Scholar]
- 27.Vandesompele J., De Preter K., Pattyn F., et al. Accurate normalization of real-time quantitative RT-PCR data by geometric averaging of multiple internal control genes. Genome biology. 2002;3(7) doi: 10.1186/gb-2002-3-7-research0034. [DOI] [PMC free article] [PubMed] [Google Scholar]
- 28.Zhang Y. I-TASSER server for protein 3D structure prediction. BMC Bioinformatics. 2008;9(3, article 40):297–315. doi: 10.1186/1471-2105-9-40. [DOI] [PMC free article] [PubMed] [Google Scholar]
- 29.Roy A., Kucukural A., Zhang Y. I-TASSER: a unified platform for automated protein structure and function prediction. Nature Protocols. 2010;5(4):725–738. doi: 10.1038/nprot.2010.5. [DOI] [PMC free article] [PubMed] [Google Scholar]
- 30.Roy A., Yang J., Zhang Y. COFACTOR: an accurate comparative algorithm for structure-based protein function annotation. Nucleic Acids Research. 2012;40(1):W471–W477. doi: 10.1093/nar/gks372. [DOI] [PMC free article] [PubMed] [Google Scholar]
- 31.Webb B., Sali A. Protein Structure Prediction. Vol. 1137. New York, NY, USA: Springer; 2014. Protein Structure Modeling with MODELLER; pp. 1–15. (Methods in Molecular Biology). [DOI] [PubMed] [Google Scholar]
- 32.Schrödinger L. The PyMOL molecular graphics system, version 1.3 r1, 2010.
- 33.Zhang Y. Progress and challenges in protein structure prediction. Current Opinion in Structural Biology. 2008;18(3):342–348. doi: 10.1016/j.sbi.2008.02.004. [DOI] [PMC free article] [PubMed] [Google Scholar]
- 34.Chiu P.-L., Ng B. H., Chang G.-W., Gordon S., Lin H.-H. Putative alternative trans-splicing of leukocyte adhesion-GPCR pre-mRNAs generates functional chimeric receptors. FEBS Letters. 2008;582(5):792–798. doi: 10.1016/j.febslet.2008.02.004. [DOI] [PubMed] [Google Scholar]
- 35.Markovic D., Grammatopoulos D. K. Focus on the splicing of Secretin GPCRs transmembrane-domain 7. Trends in Biochemical Sciences. 2009;34(9):443–452. doi: 10.1016/j.tibs.2009.06.002. [DOI] [PubMed] [Google Scholar]
- 36.Markovic D. Alternative mRNA splicing of g protein-coupled receptors. Methods in Enzymology. 2013;520:323–335. doi: 10.1016/B978-0-12-391861-1.00015-0. [DOI] [PubMed] [Google Scholar]
- 37.Case A. M., Sawyer I. A., Dundr M., Hastings M. L. Encyclopedia of Cell Biology. Waltham, Mass, USA: Academic Press; 2016. Pre-mRNA splicing: function and dysfunction; pp. 503–511. [Google Scholar]
- 38.Braunschweig U., Gueroussov S., Plocik A. M., Graveley B. R., Blencowe B. J. Dynamic integration of splicing within gene regulatory pathways. Cell. 2013;152(6):1252–1269. doi: 10.1016/j.cell.2013.02.034. [DOI] [PMC free article] [PubMed] [Google Scholar]
- 39.Kilpatrick G. J., Dautzenberg F. M., Martin G. R., Eglen R. M. 7TM receptors: the splicing on the cake. Trends in Pharmacological Sciences. 1999;20(7):294–301. doi: 10.1016/s0165-6147(99)01355-3. [DOI] [PubMed] [Google Scholar]
- 40.Gu W., Zhou T., Wilke C. O. A universal trend of reduced mRNA stability near the translation-initiation site in prokaryotes and eukaryotes. PLoS Computational Biology. 2010;6(2) doi: 10.1371/journal.pcbi.1000664.e1000664 [DOI] [PMC free article] [PubMed] [Google Scholar]
- 41.Hamid F. M., Makeyev E. V. Emerging functions of alternative splicing coupled with nonsense-mediated decay. Biochemical Society Transactions. 2014;42(4):1168–1173. doi: 10.1042/BST20140066. [DOI] [PubMed] [Google Scholar]
- 42.Hertel K. J. Combinatorial control of exon recognition. Journal of Biological Chemistry. 2008;283(3):1211–1215. doi: 10.1074/jbc.R700035200. [DOI] [PubMed] [Google Scholar]
- 43.Di Giammartino D. C., Nishida K., Manley J. L. Mechanisms and consequences of alternative polyadenylation. Molecular Cell. 2011;43(6):853–866. doi: 10.1016/j.molcel.2011.08.017. [DOI] [PMC free article] [PubMed] [Google Scholar]
- 44.Warf M. B., Berglund J. A. Role of RNA structure in regulating pre-mRNA splicing. Trends in Biochemical Sciences. 2010;35(3):169–178. doi: 10.1016/j.tibs.2009.10.004. [DOI] [PMC free article] [PubMed] [Google Scholar]
- 45.Barbosa-Morais N. L., Irimia M., Pan Q., et al. The evolutionary landscape of alternative splicing in vertebrate species. Science. 2012;338(6114):1587–1593. doi: 10.1126/science.1230612. [DOI] [PubMed] [Google Scholar]
- 46.Galante P. A. F., Sakabe N. J., Kirschbaum-Slager N., De Souza S. J. Detection and evaluation of intron retention events in the human transcriptome. RNA. 2004;10(5):757–765. doi: 10.1261/rna.5123504. [DOI] [PMC free article] [PubMed] [Google Scholar]
- 47.Braunschweig U., Barbosa-Morais N. L., Pan Q., et al. Widespread intron retention in mammals functionally tunes transcriptomes. Genome Research. 2014;24(11):1774–1786. doi: 10.1101/gr.177790.114. [DOI] [PMC free article] [PubMed] [Google Scholar]
- 48.Rourke J. L. The Chemerin Receptor GPR1 Signals Through a RhoA/ROCK Pathway and Contributes to Glucose Homeostasis in Obese Mice. Halifax, Canada: Dalhousie University; 2015. [Google Scholar]
- 49.Tian X.-F., Ma W.-J., Fang G.-G., Xiao T.-X., Chen J., Zhang J. The effects of experimental mice adipose accumulation by targeting GPR1 pathway. Progress in Biochemistry and Biophysics. 2015;42(5):457–467. doi: 10.16476/j.pibb.2015.0030. [DOI] [Google Scholar]
- 50.Ernst M. C., Issa M., Goralski K. B., Sinal C. J. Chemerin exacerbates glucose intolerance in mouse models of obesity and diabetes. Endocrinology. 2010;151(5):1998–2007. doi: 10.1210/en.2009-1098. [DOI] [PubMed] [Google Scholar]
- 51.Knobloch M., Braun S. M. G., Zurkirchen L., et al. Metabolic control of adult neural stem cell activity by Fasn-dependent lipogenesis. Nature. 2013;493(7431):226–230. doi: 10.1038/nature11689. [DOI] [PMC free article] [PubMed] [Google Scholar]
- 52.Atilla-Gokcumen G. E., Muro E., Relat-Goberna J., et al. Dividing cells regulate their lipid composition and localization. Cell. 2014;156(3):428–439. doi: 10.1016/j.cell.2013.12.015. [DOI] [PMC free article] [PubMed] [Google Scholar]
- 53.Marchese A., Cheng R., Lee M. C., et al. Mapping studies of two G-protein-coupled receptor genes: an amino acid difference may confer a functional variation between a human and rodent receptor. Biochemical and Biophysical Research Communications. 1994;205(3):1952–1958. doi: 10.1006/bbrc.1994.2899. [DOI] [PubMed] [Google Scholar]
- 54.Goralski K. B., McCarthy T. C., Hanniman E. A., et al. Chemerin, a novel adipokine that regulates adipogenesis and adipocyte metabolism. The Journal of Biological Chemistry. 2007;282(38):28175–28188. doi: 10.1074/jbc.m700793200. [DOI] [PubMed] [Google Scholar]
- 55.Silva R. C., Báo S. N., Jivago J. L. P. R., Lucci C. M. Ultrastructural characterization of porcine oocytes and adjacent follicular cells during follicle development: lipid component evolution. Theriogenology. 2011;76(9):1647–1657. doi: 10.1016/j.theriogenology.2011.06.029. [DOI] [PubMed] [Google Scholar]
- 56.Yang Y., Ren L., Sun L., et al. The role of GPR1 signaling in mice corpus luteum. Journal of Endocrinology. 2016;230(1):55–65. doi: 10.1530/JOE-15-0521. [DOI] [PMC free article] [PubMed] [Google Scholar]
Associated Data
This section collects any data citations, data availability statements, or supplementary materials included in this article.
Supplementary Materials
I-TASSER and Rosseta to predict the 3D structure of GPR1