

Abstract
Human T-cell leukemia virus type 1 (HTLV-1) codes for 9 alternatively spliced transcripts and 2 major regulatory proteins named Tax and Rex that function at the transcriptional and posttranscriptional levels, respectively. We investigated the temporal sequence of HTLV-1 gene expression in primary cells from infected patients using splice site-specific quantitative RT-PCR. The results indicated a two-phase kinetics with the tax/rex mRNA preceding expression of other viral transcripts. Analysis of mRNA compartmentalization in cells transfected with HTLV-1 molecular clones demonstrated the strict Rex-dependency of the two-phase kinetics and revealed strong nuclear retention of HBZ mRNAs, supporting their function as noncoding transcripts. Mathematical modeling underscored the importance of a delay between the functions of Tax and Rex, which was supported by experimental evidence of the longer half-life of Rex. These data provide evidence for a temporal pattern of HTLV-1 expression and reveal major differences in the intracellular compartmentalization of HTLV-1 transcripts.
Introduction
Human T-cell leukemia virus type 1 (HTLV-1) is the causative agent of adult T-cell leukemia-lymphoma (ATLL) and tropical spastic paraparesis/HTLV-1–associated myelopathy (TSP/HAM). HTLV-1 uses several strategies for controlling the expression of its genome, including the production of 9 alternatively spliced transcripts (Figure 1A).1–6 Production of plus-strand transcripts is controlled by Tax at the level of transcription and by Rex at the level of nucleo-cytoplasmic export of unspliced and partially spliced mRNAs.7,8 Regulation of the minus-strand HBZ transcripts, which lack elements responsive to Rex, remains to be determined.
Figure 1.
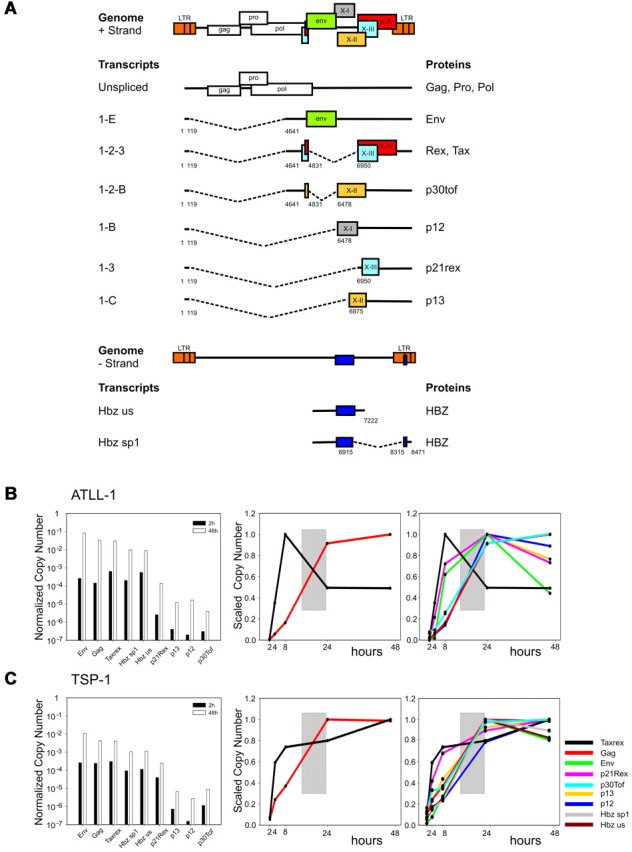
Temporal analysis of HTLV-1 expression in PBMCs from infected patients. (A) Structure and coding potential of plus- and minus-strand HTLV-1 mRNAs. (B-C) Bar graphs (left panels) show the Normalized Copy Numbers (NCN) of the indicated mRNAs after 2 hours (black bars) and 48 hours (white bars) of culture in vitro measured in representative ATLL and TSP/HAM patients; data on all patients studied are shown in supplemental Figure 1. NCN values were calculated by dividing the absolute copy number of each transcript by the absolute copy number of the 18S rRNA. Line graphs show the variation in the tax/rex and gag mRNAs (middle panels) and in all measured transcripts (right panels). Lines corresponding to HBZ mRNA are not shown for patient ATLL-1 because of insufficient material in the 8- and 24-hour time points. Scaled Copy Numbers (SCN) are plotted over a 48-hour time period (ie, at 2, 4, 8, 24, and 48 hours after depletion of CD8-positive cells and culture; cells were cultured in RPMI 1640 medium supplemented with 10% FCS, 2 mM glutamine, 100 IU/mL penicillin and 100 μg/mL streptomycin). SCN values were calculated by dividing the NCN of each transcript at each time point by the maximum NCN value measured for that mRNA during the time course experiment. mRNAs are indicated by colors as shown in panel C right.
Current models suggest that plus-strand HTLV-1 mRNAs are expressed with a distinct timing during the course of the viral life cycle, with a switch from early (Rex-independent) to late (Rex-dependent) transcripts. Although early studies showed a qualitative switch among classes of HTLV-1 mRNAs (multiply spliced vs unspliced),9–12 detection of this phenomenon with quantitative transcript-specific methods has proven difficult.13
To answer this question we used quantitative RT-PCR to quantify proviral expression during the spontaneous proviral reactivation observed in cells from infected patients. The results demonstrated a “two-phase” expression pattern. Using transfection of HTLV-1 molecular clones and subcellular RNA fractionation we demonstrated the Rex-dependency of the two-phase kinetics and determined the compartmentalization of the individual mRNAs, showing that more than 90% of the HBZ mRNAs were retained in the nucleus. Mathematical modeling14 revealed the importance of a delay of Rex function compared with Tax, which was supported by experimental evidence of delayed accumulation and longer half-life of Rex.
Methods
Samples from HTLV-1–infected patients
Peripheral blood mononuclear cells (PBMCs) from ATLL and TSP/HAM patients were purified as in.15 Patients are described in supplemental Table 1 (available on the Blood Web site; see the Supplemental Materials link at the top of the online article). All samples were obtained from patients after informed consent in accordance with the Declaration of Helsinki, with approval from the Imperial College and King's College hospitals (London) Institutional Rreview Boards.
Plasmids, cells, and transfections
Plasmid pBS1–2-3 consists of the tax/rex cDNA (exons 1, 2, and 3 flanked by the 5′ and 3′LTRs, from infectious molecular clone CS-HTLV-116) inserted in pBluescript (Stratagene). Plasmid ACH-Rex knockout (KO) was derived from the HTLV-1 molecular clone ACH17 by digestion with SphI followed by removal of 3′ overhangs (including the Rex initiation codon) with T4 DNA polymerase and religation. Transfections were performed in the HeLa-derived cell line HLtat,18 chosen for its high transfection efficiency.
Quantitative RT-PCR
RNA of PBMCs from infected patients and transfected cells was extracted and viral transcripts were quantitated as detailed in supplemental Table 2.
Analysis of Tax and Rex expression
The time course of Tax and Rex expression was analyzed as described in Figure 2.
Figure 2.
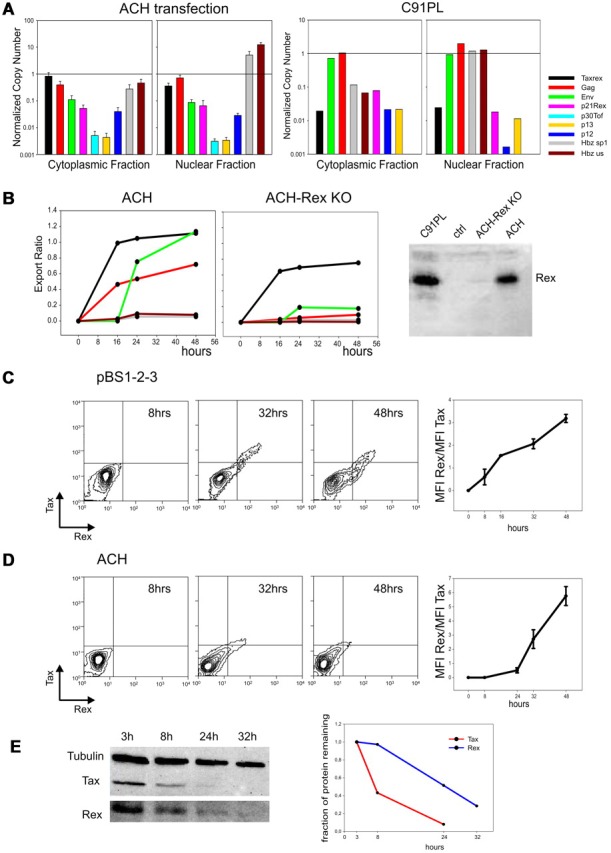
Kinetics and intracellular compartmentalization of HTLV-1 mRNAs; temporal analysis of Tax and Rex protein turnover. (A left) NCN of all HTLV-1 mRNAs in the cytoplasmic and nuclear fractions 24 hours after transfection of HLtat cells with wild-type HTLV-1 molecular clone ACH using Fugene6 (Roche; mean of 3 experiments, standard error bars). NCN values were determined by dividing the absolute copy number of each transcript by the absolute copy number of the GAPDH mRNA. (Right) NCN of all HTLV-1 mRNAs in the cytoplasmic and nuclear fractions of the chronically infected cell line C91PL.19 (B) Kinetic analysis of the nucleo-cytoplasmic export of the tax/rex, gag, env and HBZ mRNAs expressed from ACH (left) and ACH-Rex-KO (middle) in transfected HLtat cells. RNA was extracted from nuclear and cytoplasmic fractions using the Paris Kit (Ambion). “Export Ratios” were calculated as the ratio between cytoplasmic and total NCN over a time course of 48 hours (harvesting at 0, 16, 24, and 48 hours). The right panel shows Western blot analysis to detect Rex protein (see description in panel E); results verified that the ACH-Rex-KO does not express Rex. (C) Kinetics of Tax and Rex protein expression in HLtat cells from plasmid pBS1–2-3, which contains the viral 5′ and 3′ LTRs and expresses the full-length tax/rex mRNA (including all coding and noncoding regions). Cultures were harvested at 8, 16, 32, and 48 hours after transfection. Cells were fixed in 3.7% formaldehyde-PBS, permeabilized in 0.2% Triton-PBS, blocked with 3% BSA (bovine serum albumin)–PBS and then incubated for 1 hour with mouse anti-Tax monoclonal antibody23 (1:100, in PBS-1.5% BSA) and rabbit anti-Rex polyclonal antibody24 (1:500, in PBS-1.5% BSA). Cells were next incubated for 1 hour with Alexa 633-conjugated goat anti–mouse and Alexa 488–conjugated chicken anti–rabbit antibodies (Molecular Probes) diluted 1:1000 in PBS-1.5% BSA. Tax and Rex protein expression was analyzed by flow cytometry using a FACSCalibur (Becton Dickinson) equipped with 633-nm Helium-Neon and 488-nm Argon lasers. Alexa 633 and Alexa 488 fluorescent signals were analyzed using the FL4 (661 ± 16 nm) and the FL1 (530 ± 30 nm) detection lines, respectively. Data are represented as equal probability plots. The line graph (right) shows mean and standard error values of Rex/Tax fluorescence intensity (mean fluorescence value X number of positive events) ratios measured in 3 independent experiments. (D) Kinetics of Tax and Rex protein expression in HLtat cells from the infectious HTLV-1 molecular clone ACH. Cultures were harvested at 8, 24, 32, and 48 hours after transfection. Cells were processed and analyzed as described for panel C. Data are represented as equal probability plots. The line graph (right) shows mean and standard error values of Rex/Tax fluorescence intensity (mean fluorescence value X number of positive events) ratios measured in 3 independent experiments. (E) Degradation rates of the Tax and Rex protein expressed from pBS1–2-3 after blocking protein synthesis. HLtat cells transfected with pBS1–2-3 were treated with 10μM cycloheximide 24 hours after transfection and harvested in “disruption buffer” (Paris kit; Ambion) at 3, 8, 24, and 32 hours after cycloheximide treatment. Lysates were subjected to SDS-PAGE and electrotransferred to Hybond-C Extra (GE Healthcare). Blots were incubated with mouse anti-Tax monoclonal antibody (1:500), rabbit anti-Rex polyclonal antibody (1:5000) and mouse anti-tubulin monoclonal antibody (1:2000) in PBS-3% BSA-0.05% Tween followed by a horseradish peroxidase-conjugated anti–mouse or anti–rabbit antibody (Pierce) diluted 1:5000 in 2% milk (Roche)–PBS-0.05% Tween. Blots were developed using chemiluminescence reagents (Supersignal, Pierce) and immunoreactive bands were visualized and quantified using a BioRad ChemiDoc XRS imager. The left panel shows a composite of this Western blot analysis to detect the Tax, Rex and Tubulin signals. Data were normalized by dividing Tax and Rex signals by the tubulin signal and scaled against the value at 3 hours; resulting numbers, which represented the fraction of protein remaining, were plotted in the graph on the right. Protein half-life was estimated by fitting a linear decay model to the data, assuming a constant degradation rate.
Results and discussion
Temporal analysis of HTLV-1 expression in PBMCs from infected patients
Although postulated based on the function of Tax and Rex,7 a temporal switch in HTLV-1 expression has not been demonstrated with quantitative transcript-specific methods. To investigate this possibility, we set up an ex vivo virus reactivation model based on the depletion of CD8+ T-cells from unstimulated PBMCs isolated from HTLV-1–infected patients, which reveals a sharp up-regulation of viral expression in the remaining PBMCs.15 Samples from 6 patients with TSP/HAM and 3 patients with ATLL were analyzed (supplemental Table 1). Splice-junction-specific Real-Time RT-PCR was used to measure the abundance (normalized copy number, NCN) and timing (scaled copy number, SCN) of expression of HTLV-1 transcripts (supplemental Table 2).
Figure 1 (B-C left) shows the NCN of the different mRNAs after 2 and 48 hours of culture in vitro (black bars and white bars, respectively) in representative cases of ATLL (patient ATLL-1) and TSP/HAM (patient TSP-1). Data on all patients studied are shown in supplemental Figure 1. Expression of all transcripts was substantially up-regulated on culture in vitro. The most abundant plus-strand transcripts were tax/rex, gag and env, followed by p21rex, p30tof, p13 and p12; the minus-strand (HBZ) transcripts were readily detected.
Analysis of the timing of expression (SCN, Figure 1B-C middle) over a 48-hour time period showed that tax/rex was the earliest transcript followed by a rise in gag expression whose curve intersected that of tax/rex between 8 and 24 hours (indicated by a gray box in the figure), suggesting an “early-late” switch in HTLV-1 gene expression. Analysis of the SCN of all mRNAs (Figure 1B-C right) confirmed the “early-late” switch (gray box) and suggested a distinct temporal sequence of expression among the “late” mRNAs. The p21Rex mRNA was also detected as an early transcript in most samples, although its expression profile did not follow that of tax/rex in all the patients examined (see supplemental Figure 1).
Rex-dependence of the “two-phase” kinetics and nuclear retention of HBZ transcripts
The abundance and timing of expression of the HTLV-1 mRNAs were further investigated in cells transfected with the infectious HTLV-1 molecular clone ACH. This system permitted quantitation of transcripts in the cytoplasmic and nuclear fractions, which was not possible with patient samples because of limited amounts of material. Using a Rex knock-out derivative of ACH (ACH-Rex KO, Figure 2B right) we also tested the Rex-dependence of the two-phase expression kinetics.
Figure 2A (left) shows NCN in the cytoplasmic and nuclear fractions 24 hours after transfection of ACH. The most abundant plus-strand transcripts were tax/rex and gag, followed by env and p21rex; p12, p13, and p30tof were expressed at lower levels. The plus-strand transcripts showed similar partition in the nucleus and cytoplasm; in contrast the HBZ NCN was over 10-fold higher in the nucleus than in the cytoplasm.
The timing of expression was investigated by calculating “Export Ratios” over 48 hours (Figure 2B left). Consistent with results obtained from patient PBMCs (see preceding paragraph), ACH showed a two-phase expression kinetics with “early” tax/rex expression (measured as a sharp increase in export ratio) followed by a rise in the export ratios of the gag and env mRNAs. Importantly, the two-phase kinetics was abolished in cells expressing ACH-Rex KO (Figure 2B middle), demonstrating the critical role of Rex in regulating these kinetics. The export ratios of HBZ transcripts remained remarkably low throughout the time course and were not affected by Rex (Figure 2B left and middle). The nuclear retention of HBZ transcripts was also confirmed in the infected cell line C91PL19 (Figure 2A right). Although the significance of the nuclear retention of HBZ mRNAs remains to be understood, we propose that it might favor viral persistence by reducing HBZ translation thereby reducing exposure of the infected cell to the HBZ-specific host CD8+ T-cell response20,21 while allowing its function as a noncoding transcript driving T-cell proliferation.22
Kinetics of Tax and Rex protein turnover
Mathematical modeling (supplemental Figure 2) underscored the importance of a delay in Rex function compared with Tax in the observed expression kinetics. These considerations led us to investigate the time course of Tax and Rex expression from plasmid pBS1–2-3, which expresses the full-length mature tax/rex mRNA (Figure 2C), and from the ACH molecular clone (Figure 2D). Flow cytometry analyses showed a relative accumulation of Rex at later time points (32, 48 hours) resulting in a progressive rise in the Rex/Tax ratio (right panels).
Consistent with these observations, a comparison of the half-lives of Tax and Rex expressed from pBS1–2-3 after treatment with cycloheximide revealed a slower rate of degradation of Rex compared with Tax (Figure 2E), with half-lives of 19.6 hours and 6.6 hours, respectively; similar half-lives were measured in ACH-transfected cells (data not shown). These findings provide experimental grounds for the delay in Rex function postulated in the mathematical model and suggest a posttranslational control of Tax and Rex activity.
Acknowledgments
We thank Luigi Chieco-Bianchi for discussions.
This work was supported by grants from the European Union (“The role of chronic infections in the development of cancer,” contract no. 2005-018704), the Associazione Italiana per la Ricerca sul Cancro (AIRC), the Fondazione Cariverona, the Ministero per l'Università e la Ricerca Scientifica, e Tecnologica Progetti di Ricerca di Interesse Nazionale (PRIN), the Ministero della Salute (project RFPS-2006-2-342-010), and the University of Padova.
Footnotes
The online version of this article contains a data supplement.
The publication costs of this article were defrayed in part by page charge payment. Therefore, and solely to indicate this fact, this article is hereby marked “advertisement” in accordance with 18 USC section 1734.
Authorship
Contribution: F.R. and I.C. carried out transfections, immunoblotting and real-time RT-PCR assays; M.S.B. carried out flow cytometry analyses; G.P.T. provided patient samples and was responsible for all aspects of diagnosis and clinical management of the patients; C.R.M.B., F.T., and S.J. helped design and set up the assays to measure HTLV-1 mRNAs in cells from infected patients; D.M.D. and V.C. designed the experiments and prepared the manuscript; G.M.T. and A.C. developed the mathematical models of HTLV-1 expression; Y.T. provided Tax-specific antibodies; and all authors contributed to the analysis and interpretation of the data.
Conflict-of-interest disclosure: The authors declare no competing financial interests.
Correspondence: Vincenzo Ciminale, Dipartimento di Scienze Oncologiche e Chirurgiche, Università di Padova, Via Gattamelata 64, I-35128 Padova, Italy; e-mail: v.ciminale@unipd.it.
References
- 1.Ciminale V, Pavlakis GN, Derse D, Cunningham CP, Felber BK. Complex splicing in the human T-cell leukemia virus (HTLV) family of retroviruses: novel mRNAs and proteins produced by HTLV type I. J Virol. 1992;66(3):1737–1745. doi: 10.1128/jvi.66.3.1737-1745.1992. [DOI] [PMC free article] [PubMed] [Google Scholar]
- 2.Berneman ZN, Gartenhaus RB, Reitz MS, Jr, et al. Expression of alternatively spliced human T-lymphotropic virus type I pX mRNA in infected cell lines and in primary uncultured cells from patients with adult T-cell leukemia/lymphoma and healthy carriers. Proc Natl Acad Sci U S A. 1992;89(7):3005–3009. doi: 10.1073/pnas.89.7.3005. [DOI] [PMC free article] [PubMed] [Google Scholar]
- 3.Koralnik IJ, Gessain A, Klotman ME, Lo Monico A, Berneman ZN, Franchini G. Protein isoforms encoded by the pX region of human T-cell leukemia/lymphotropic virus type I. Proc Natl Acad Sci U S A. 1992;89(18):8813–8817. doi: 10.1073/pnas.89.18.8813. [DOI] [PMC free article] [PubMed] [Google Scholar]
- 4.Cereseto A, Berneman Z, Koralnik I, Vaughn J, Franchini G, Klotman ME. Differential expression of alternatively spliced pX mRNAs in HTLV-I-infected cell lines. Leukemia. 1997;11(6):866–870. doi: 10.1038/sj.leu.2400665. [DOI] [PubMed] [Google Scholar]
- 5.Princler GL, Julias JG, Hughes SH, Derse D. Roles of viral and cellular proteins in the expression of alternatively spliced HTLV-1 pX mRNAs. Virology. 2003;317(1):136–145. doi: 10.1016/j.virol.2003.09.010. [DOI] [PubMed] [Google Scholar]
- 6.Matsuoka M. HTLV-1 bZIP factor gene: Its roles in HTLV-1 pathogenesis. Mol Aspects Med. 2010;31(5):359–66. doi: 10.1016/j.mam.2010.06.002. [DOI] [PubMed] [Google Scholar]
- 7.Lairmore M, Franchini G. Human T-cell leukemia virus types 1 and 2. In: Knipe DM, Howley PM, et al., editors. Fields Virology, Fifth Edition. Vol 2. Philadelphia, PA: Lippincott Williams and Wilkins; 2007. pp. 2071–2106. [Google Scholar]
- 8.Younis I, Green PL. The human T-cell leukemia virus Rex protein. Front Biosci. 2005;10:431–445. doi: 10.2741/1539. [DOI] [PMC free article] [PubMed] [Google Scholar]
- 9.Hidaka M, Inoue J, Yoshida M, Seiki M. Post-transcriptional regulator (rex) of HTLV-1 initiates expression of viral structural proteins but suppresses expression of regulatory proteins. EMBO J. 1988;7(2):519–523. doi: 10.1002/j.1460-2075.1988.tb02840.x. [DOI] [PMC free article] [PubMed] [Google Scholar]
- 10.Grone M, Koch C, Grassmann R. The HTLV-1 Rex protein induces nuclear accumulation of unspliced viral RNA by avoiding intron excision and degradation. Virology. 1996;218(2):316–325. doi: 10.1006/viro.1996.0200. [DOI] [PubMed] [Google Scholar]
- 11.Inoue J, Itoh M, Akizawa T, Toyoshima H, Yoshida M. HTLV-1 Rex protein accumulates unspliced RNA in the nucleus as well as in cytoplasm. Oncogene. 1991;6(10):1753–1757. [PubMed] [Google Scholar]
- 12.Dokhelar MC, Pickford H, Sodroski J, Haseltine WA. HTLV-I p27rex regulates gag and env protein expression. J Acquir Immune Defic Syndr. 1989;2(5):431–440. [PubMed] [Google Scholar]
- 13.Li M, Kesic M, Yin H, Yu L, Green PL. Kinetic analysis of human T-cell leukemia virus type 1 gene expression in cell culture and infected animals. J Virol. 2009;83(8):3788–3797. doi: 10.1128/JVI.02315-08. [DOI] [PMC free article] [PubMed] [Google Scholar]
- 14.Corradin A, DIC B, Rende F, Ciminale V, Toffolo GM, Cobelli C. Retrovirus HTLV-1 gene circuit: a potential oscillator for eukaryotes. Pac Symp Biocomput. 2010:421–432. [PubMed] [Google Scholar]
- 15.Hanon E, Hall S, Taylor GP, et al. Abundant tax protein expression in CD4+ T cells infected with human T-cell lymphotropic virus type I (HTLV-I) is prevented by cytotoxic T lymphocytes. Blood. 2000;95(4):1386–1392. [PubMed] [Google Scholar]
- 16.Derse D, Mikovits J, Polianova M, Felber BK, Ruscetti F. Virions released from cells transfected with a molecular clone of human T-cell leukemia virus type I give rise to primary and secondary infections of T cells. J Virol. 1995;69(3):1907–1912. doi: 10.1128/jvi.69.3.1907-1912.1995. [DOI] [PMC free article] [PubMed] [Google Scholar]
- 17.Kimata JT, Wong FH, Wang JJ, Ratner L. Construction and characterization of infectious human T-cell leukemia virus type 1 molecular clones. Virology. 1994;204(2):656–664. doi: 10.1006/viro.1994.1581. [DOI] [PubMed] [Google Scholar]
- 18.Schwartz S, Felber BK, Benko DM, Fenyo EM, Pavlakis GN. Cloning and functional analysis of multiply spliced mRNA species of human immunodeficiency virus type 1. J Virol. 1990 Jun;64(6):2519–2529. doi: 10.1128/jvi.64.6.2519-2529.1990. [DOI] [PMC free article] [PubMed] [Google Scholar]
- 19.MacNamara A, Rowan A, Hilburn S, et al. HLA class I binding of HBZ determines outcome in HTLV-1 infection. PLoS Pathog. 2010;6(9):pii:e1001117. doi: 10.1371/journal.ppat.1001117. [DOI] [PMC free article] [PubMed] [Google Scholar]
- 20.Hilburn S, Rowan A, Demontis MA, et al. In vivo expression of human T-lymphotrophic virus type 1 basic leucine-zipper protein generates specific CD8+ and CD4+ T-lymphocyte responses that correlate with clinical outcome. J Infect Dis. 2011;203(4):529–536. doi: 10.1093/infdis/jiq078. [DOI] [PMC free article] [PubMed] [Google Scholar]
- 21.Satou Y, Yasunaga J, Yoshida M, Matsuoka M. HTLV-I basic leucine zipper factor gene mRNA supports proliferation of adult T cell leukemia cells. Proc Natl Acad Sci U S A. 2006;103(3):720–725. doi: 10.1073/pnas.0507631103. [DOI] [PMC free article] [PubMed] [Google Scholar]
- 22.Popovic M, Lange-Wantzin G, Sarin PS, Mann D, Gallo RC. Transformation of human umbilical cord blood T cells by human T-cell leukemia/lymphoma virus. Proc Natl Acad Sci U S A. 1983;80(17):5402–5406. doi: 10.1073/pnas.80.17.5402. [DOI] [PMC free article] [PubMed] [Google Scholar]
- 23.Lee B, Tanaka Y, Tozawa H. Monoclonal antibody defining tax protein of human T-cell leukemia virus type-I. Tohoku J Exp Med. 1989;157(1):1–11. doi: 10.1620/tjem.157.1. [DOI] [PubMed] [Google Scholar]
- 24.Bhat NK, Adachi Y, Samuel KP, Derse D. HTLV-1 gene expression by defective proviruses in an infected T-cell line. Virology. 1993;196(1):15–24. doi: 10.1006/viro.1993.1450. [DOI] [PubMed] [Google Scholar]