Original citation: J. Clin. Invest. 114:1354–1360 (2004). doi:10.1172/JCI200420631
Citation for this erratum: J. Clin. Invest. 114:1686 (2004). doi:10.1172/JCI200420631E1
Figures 6, 7, and 8 of this manuscript contain errors in units. The correct figures appear below. We regret these errors.
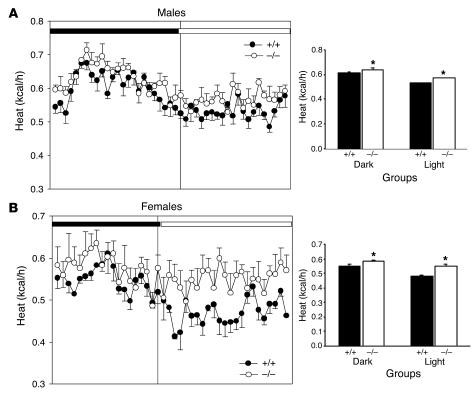
Figure 6.
Comparison of oxygen consumption of syndecan-3–/– and wild-type mice. (A and B) Indirect calorimetry of male (A) and female (B) syndecan-3–/– mice (n = 4) and wild-type mice (n = 4) on the HF diet. Heat (kcal/h) was measured for 24 hours in an indirect calorimeter. The mean energy expenditure (kcal/h) was calculated separately during the light and dark cycles for each group of mice. Syndecan-3–/– mice exhibited greater energy expenditure during both the light and dark cycles (*P < 0.001 wild type vs. syndecan-3–/– for each sex, Student's t test).
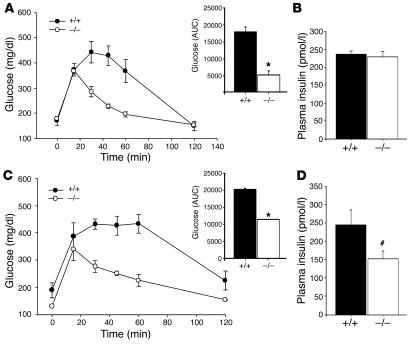
Figure 7.
Glucose tolerance of syndecan-3–/– and wild-type mice. (A and C) Glucose tolerance of female (A) and male (C) syndecan-3–/– mice (n = 3) compared with wild-type mice (n = 3). Glucose (20% D-glucose) was administered intraperitoneally and tail blood samples were drawn for glucose measurements (at 0, 15, 30, 45, 60, and 120 minutes after glucose administration). The area under the curve (AUC) was calculated (using trapezoidal analysis) during the IPGTT and was compared between wild-type and syndecan-3–/– mice using a Student’s t test (*P < 0.001). (B and D) Plasma insulin was measured in female (B) and male (D) syndecan-3–/– and wild-type mice. In a second IPGTT administered identically to the first, a blood sample was drawn 15 minutes following glucose administration for analysis of plasma insulin. Insulin was compared between wild-type and syndecan-3–/– mice using a Student’s t test (#P < 0.05). No difference was seen between plasma insulin levels between female mice.
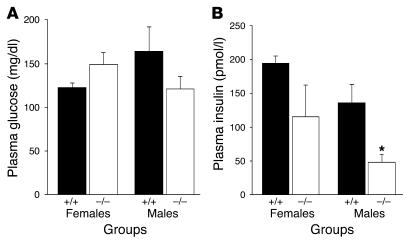
Figure 8.
Fasting plasma glucose and insulin following a HF diet. (A and B) Fasting plasma glucose (A) and plasma insulin (B) of wild-type (n = 3) and syndecan-3–/– (n = 3) mice after 14 weeks on the HF diet (*P < 0.05, Student’s t test).


