Significance
It has been suggested that the transcriptional repressor Bcl6 suppresses T helper 2 (TH2) immune responses underlying allergic diseases. However, the molecular role of B-cell CLL/lymphoma 6 (Bcl6) in TH2 cells is incompletely understood in pathophysiological settings. We found that Bcl6 suppressed cytokine production in memory TH2 cells through binding to intron 2 of the Interkeukin 4 (Il4) locus using murine models. Furthermore, IL-33 controlled Bcl6 function at the chromatin level and consequently, augmented cytokine production in memory TH2 cells. Therefore, pro-TH2 cytokines, such as IL-33, play a role in chronic allergic diseases via the functional breakdown of Bcl6. This study identifies a relationship between TH2-promoting factors and Bcl6 in TH2 cells, which may lead to therapeutic strategies against chronic allergic diseases.
Keywords: Bcl6, memory TH2 cells, asthma
Abstract
Mice deficient in the transcriptional repressor B-cell CLL/lymphoma 6 (Bcl6) exhibit similar T helper 2 (TH2) immune responses as patients with allergic diseases. However, the molecular mechanisms underlying Bcl6-directed regulation of TH2 cytokine genes remain unclear. We identified multiple Bcl6/STAT binding sites (BSs) in TH2 cytokine gene loci. We found that Bcl6 is modestly associated with the BSs, and it had no significant effect on cytokine production in newly differentiated TH2 cells. Contrarily, in memory TH2 (mTH2) cells derived from adaptively transferred TH2 effectors, Bcl6 outcompeted STAT5 for binding to TH2 cytokine gene loci, particularly Interleukin4 (Il4) loci, and attenuated GATA binding protein 3 (GATA3) binding to highly conserved intron enhancer regions in mTH2 cells. Bcl6 suppressed cytokine production epigenetically in mTH2 cells to negatively tune histone acetylation at TH2 cytokine gene loci, including Il4 loci. In addition, IL-33, a pro-TH2 cytokine, diminished Bcl6’s association with loci to which GATA3 recruitment was inversely augmented, resulting in altered IL-4, but not IL-5 and IL-13, production in mTH2 cells but no altered production in newly differentiated TH2 cells. Use of a murine asthma model that generates high levels of pro-TH2 cytokines, such as IL-33, suggested that the suppressive function of Bcl6 in mTH2 cells is abolished in severe asthma. These findings indicate a role of the interaction between TH2-promoting factors and Bcl6 in promoting appropriate IL-4 production in mTH2 cells and suggest that chronic allergic diseases involve the TH2-promoting factor-mediated functional breakdown of Bcl6, resulting in allergy exacerbation.
Thelper 2 (TH2) cells produce various effector cytokines [Interleukin (IL)-4, IL-5, and IL-13] (1, 2). GATA binding protein 3 (GATA3), a key regulator of TH2 cell differentiation, subsequently facilitates TH2 cytokine gene transcription in TH2 cells (3, 4). In mice and humans, IL-4 is a key cytokine in TH2 response initiation and IgE isotype class switching (5), whereas IL-5 and IL-13 are important in focal inflammation in allergic settings (5). The generation of lineage-committed effector TH cells peaks within approximately 1 wk. Some of the effectors will survive and become long-lived memory cells. TH2 effector cells can become memory TH2 (mTH2) cells (6), which are likely to be involved in maintaining allergic pathogenesis, although the regulatory mechanisms in these cells remain unclear.
The protooncogene B-cell CLL/lymphoma 6 (Bcl6) is a sequence-specific transcriptional repressor (7, 8). Increased TH2 cytokine production has been observed after ex vivo T-cell stimulation in Bcl6-KO mice. We previously reported that Bcl6 repressed Il5 expression (9). However, the molecular mechanisms underlying Bcl6-directed regulation of TH2 cytokine genes remain unclear. Bcl6-binding DNA sequences resemble the IFN-γ–activated sequence motif bound by STAT proteins (10), suggesting that Bcl6 represses TH2 cytokine gene expression via competitive binding against STAT factors in TH2 cytokine gene loci (7). However, TH2 cell differentiation was not influenced by the absence of Bcl6 under TH2-skewing conditions (11). Additionally, TH1 cell differentiation was similar between WT and Bcl6-KO cells under TH1-skewing conditions (11). Conversely, the differentiation of T-follicular helper (TFH) cells is believed to result from Bcl6-mediated suppression of differentiation to other TH cell lineages (12–14). Conversely, we showed that excess exogenous Bcl6 in T cells suppressed TH2 cytokine production in a murine model of chronic pulmonary inflammation (15). Therefore, considerable uncertainty surrounds the molecular mechanisms by which Bcl6 regulates TH2 cell differentiation and cytokine production.
Recent studies recognized nonlymphoid-derived cytokines [thymic stromal lymphopoietin (TSLP), IL-25, and IL-33] as integral factors in promoting TH2-type responses; however, their pathophysiological roles in mTH2 cells are incompletely understood. The IL-33 receptor is expressed on TH2 and innate immune cells, including basophils, mast cells, eosinophils, and type 2 innate lymphoid cells (16–18). In vitro-differentiated TH2 cells are also activated to produce IL-5 and IL-13 but not IL-4 in response to IL-33, regardless of T-cell receptor (TCR) engagement (19, 20). Accordingly, IL-33 may regulate cellular functions in allergic diseases by cross-linking innate and adaptive immune responses. For example, IL-33 administration to WT mice induces TH2 cytokines in the lungs. This pro-TH2 inflammatory effect appears independently of the adaptive immune response because mice deficient in the recombinase-activating gene 2 (RAG2) develop a comparable response to IL-33 (21). Exogenous IL-33 can enhance allergen-nonspecific IgE Ab production in naïve WT mice by inducing IL-4 production mainly in innate cells (22). However, treatment with an Ab against ST2, an IL-33 receptor subunit (23), largely abrogated allergic airway inflammation and reduced antigen-specific IgE Ab and TH2 cytokine production in a murine ovalbumin (OVA)-immunized allergy model. IL-33 does not induce IL-4 production in newly differentiated TH2 cells (19, 20), and whether it induces the same in mTH2 cells is uncertain.
In this study, we found that Bcl6 down-regulates TH2 cytokine gene expression in mTH2 cells. Furthermore, the findings of this study indicate that TH2 cytokine gene regulation mediated by TH2-promoting factors, such as IL-33, is associated with modulated Bcl6 function in mTH2 cells, resulting in allergic exacerbation via enhanced TH2 cytokine production.
Results
Role of Bcl6 in Cytokine Production.
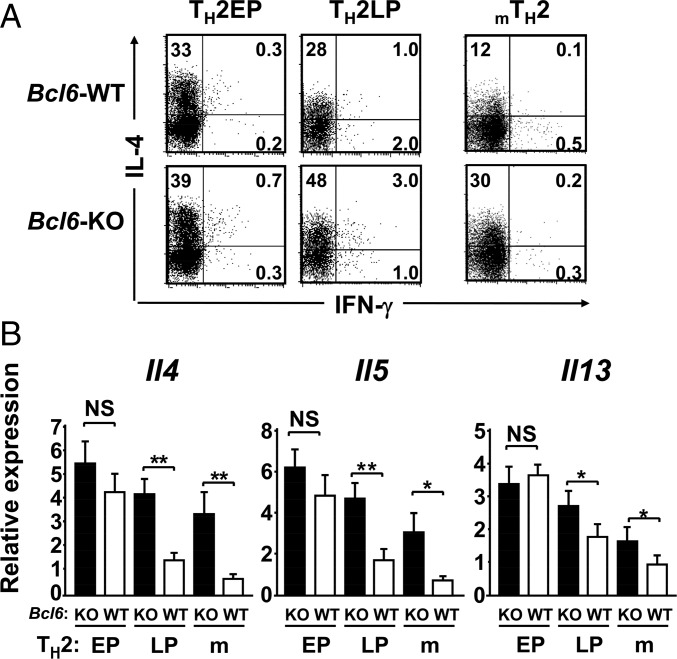
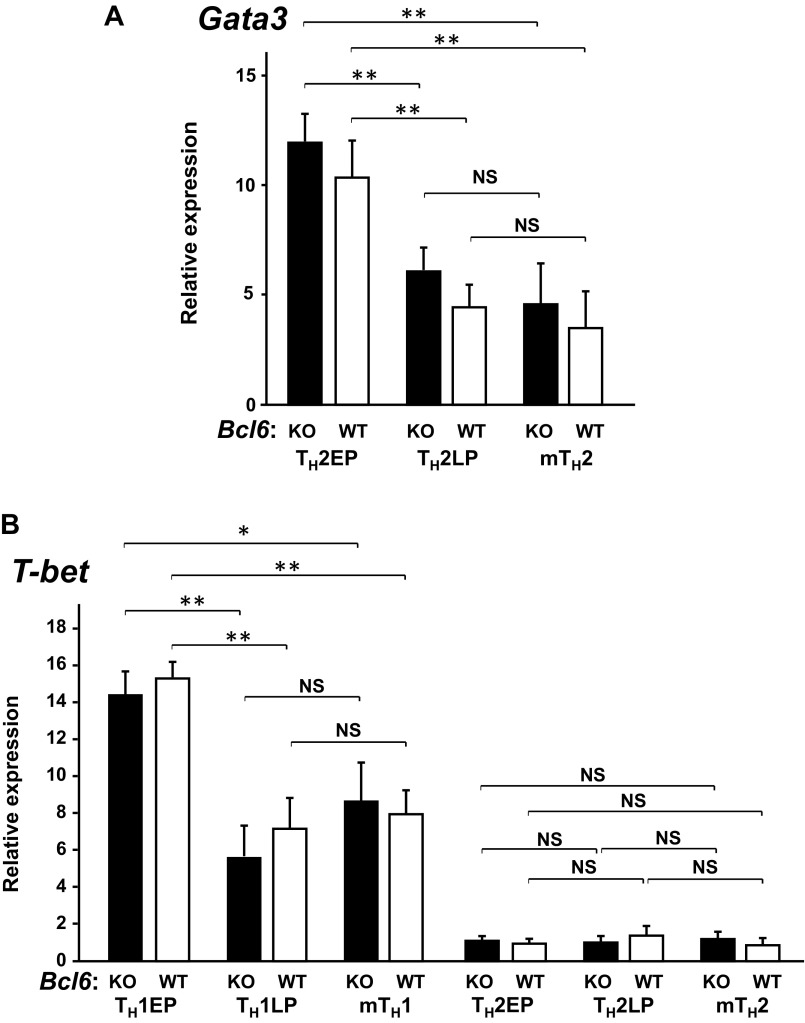
To investigate the role of Bcl6 in TH2 cell differentiation and in vitro and in vivo maintenance, cultured naïve CD4+ T cells were stimulated with antigen under TH2-skewing conditions and expanded with IL-2 until day 7 or sequentially maintained with IL-7 for 28 d to yield TH2 cells of in vitro early-phase (EP) or late-phase (LP) postdifferentiation types [TH2 early-phase cells (TH2EPs) and TH2 late-phase cells (TH2LPs), respectively]. TH2EPs were also adoptively transferred into BALB/c WT mice to generate mTH2 cells in vivo. T cell-intrinsic Bcl6 expression did not affect TH2EP differentiation (Fig. 1A). However, the frequency of IL-4+ WT TH2LPs was decreased compared with that of Bcl6-KO TH2LPs (Fig. 1A). Il4, Il5, and Il13 mRNA expression levels were similar between Bcl6-KO and WT TH2EPs, whereas their levels, particularly Il4 and Il5, in Bcl6-KO TH2LPs were significantly higher than those in WT cells (Fig. 1B). Bcl6-KO mTH2 cells also exhibited augmented TH2 cytokine production at the mRNA and protein level compared with WT mTH2 cells (Fig. 1). However, the mRNA expression levels of Gata3 in TH2EPs, TH2LPs, and mTH2 cells were similar between Bcl6-KO and the WT, whereas their levels were decreased over time after TH differentiation (Fig. S1A). According to TH1 function, IFN-γ production was not significantly affected by Bcl6 at any TH2-cell phase (Fig. 1A), and the mRNA levels of the TH1 transcription factor Tbox protein expressed in T cells (T-bet) in both TH1 and TH2 cells were constant between Bcl6-KO and the WT (Fig. S1B).
Fig. 1.
Regulatory role of Bcl6 in the differentiation of TH2 cells. TH2 cells were differentiated from naïve T cells from Bcl6-KO and WT DO11.10 mice, which express the clonotypic KJ-1-26 TG TCR specific for the OVA peptide. (A) FACS analysis of IL-4 and IFN-γ–producing cells in KJ-1-26+ CD4 T cells restimulated with anti-CD3 Abs. The figure shows representative data for TH2EPs, TH2LPs, or mTH2 cells. TH2EPs from WT or Bcl6-KO mice were adaptively transferred into BALB/c WT mice. Twenty-eight days later, mTH2 cells were isolated as KJ-1+CD4 T cells from the recipient spleens. All FACS data are representative of three independent experiments with similar results. The numbers in each corner represent the percentages of T cells in the column. (B) TH2 cytokine mRNA expression in KJ-1+ TH2EPs, TH2LPs, and mTH2 cells from WT and Bcl6-KO was measured by qRT-PCR after restimulation for 24 h. Data are shown as means ± SDs (n = 5). All results are representative of five or six independent experiments with similar outcomes. NS, not significant. *P < 0.05; **P < 0.01.
Fig. S1.
Expression of lineage-specific master transcriptional factors for differentiating TH1 and TH2 cells at EP, LP, and memory stages in Bcl6-KO and WT backgrounds. mRNA expression levels of (A) GATA3 in TH2 cells and (B) T-bet in TH1 and TH2 cells were measured by qRT-PCR. Data are shown as means ± SDs (n = 5). All results are representative of three independent experiments with similar outcomes. NS, not significant. *P < 0.05; **P < 0.01.
Bcl6-Mediated Histone Modification at TH2 Cytokine Gene Loci.
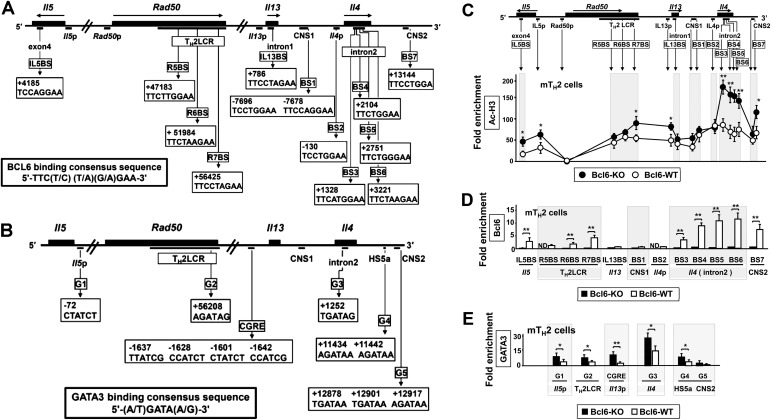
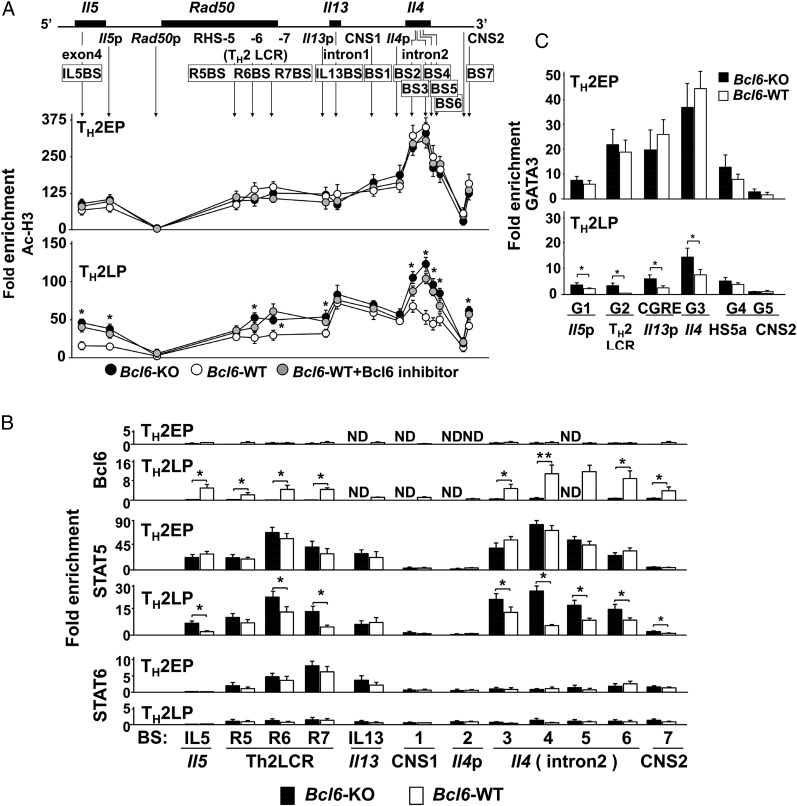
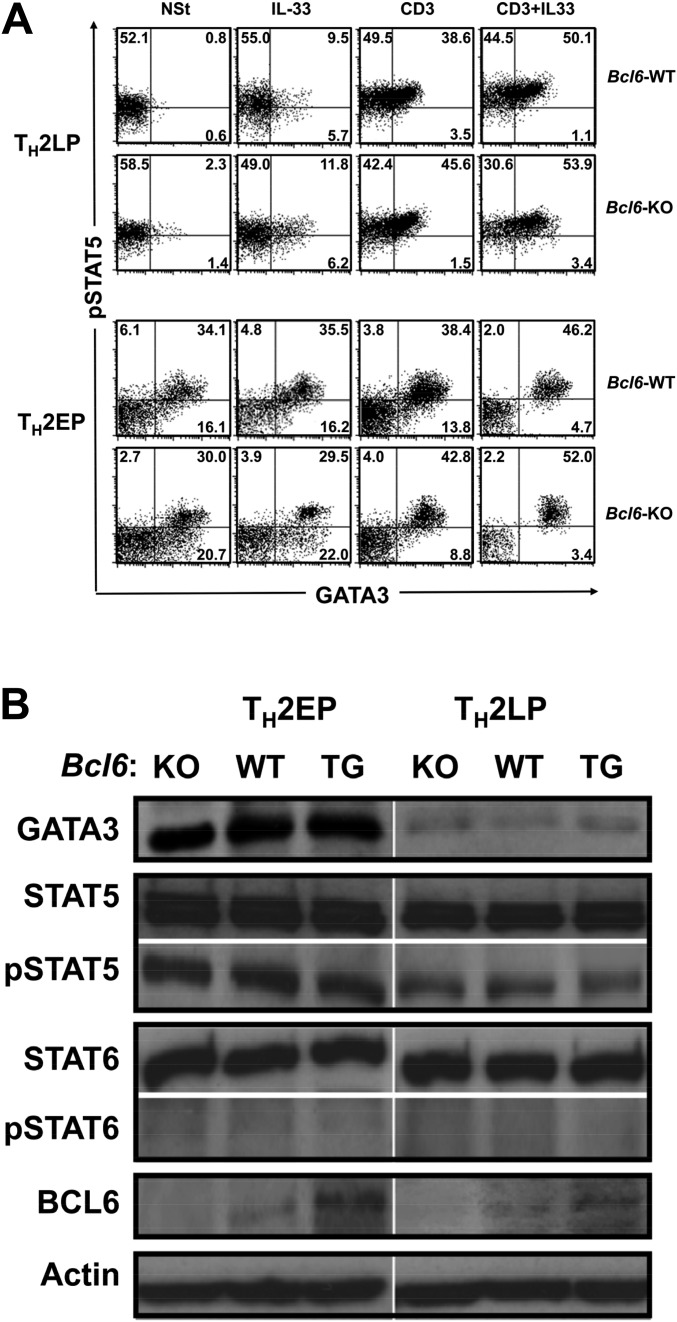
To investigate chromatin modification at Bcl6/STAT (BS) binding regions [IL5BS (9) and putative BSs] (Fig. S2A), we analyzed the acetylation levels of histone H3 (Ac-H3) at lysines (K9 and K14), which are known to play important roles in transcriptional activation and chromatin assembly at TH2 cytokine gene loci in TH2 cells at different phases using a ChIP assay (Fig. 2A). Bcl6-KO and WT TH2EPs exhibited similar Ac-H3 levels, with particularly high levels at the Il4 intron 2 region. Compared with Bcl6-KO cells, WT TH2LPs displayed decreased Ac-H3 levels at each BS, excluding IL5BS, IL13BS, BS1, and BS2, and promoter regions of Il4 (Il4p), Il5p, and Il13p. These decreased levels in WT TH2LP cells were rescued after Bcl6 inhibition (Fig. 2A). A ChIP assay (Fig. 2B) revealed modest Bcl6 binding to each region in WT TH2EPs; conversely, binding of STAT5 rather than STAT6 was observed at each BS in both WT and Bcl6-KO cells. In all cultures, STAT5 associated with the TH2 locus control region (LCR) and Il4 intron 2 but not with BS1 and BS2. In WT TH2LPs, broad Bcl6 binding was observed from IL5BS to BS7 (excluding IL13BS, BS1, and BS2), particularly at Il4 intron 2 (BS3–S6), whereas STAT5 binding was lower in WT cells than in Bcl6-KO cells. GATA3 binding was observed at each major GATA (G) binding region [G1 in Il5p (24), G2 in Rad50 hypersensitive site 7 in TH2LCR, CGRE upstream of the proximal Il13p (25), G3 in Il4 intron 2 (26), G4 in HS5a (24), and G5 in conserved noncoding sequence 2 (CNS2) (Fig. 2C, Upper and Fig. S2B)], similar to WT and Bcl6-KO TH2EPs. GATA3 binding was completely attenuated in both WT and Bcl6-KO TH2LPs compared with in TH2EPs (Fig. 2C). Whereas GATA3 predominantly associated with G3 among G sites in both WT and KO cells in all cultures, GATA3 binding was significantly greater in Bcl6-KO TH2LPs than in WT cells. Regarding mTH2 cells, Ac-H3 levels, and Bcl6, STAT5 and GATA3 binding to TH2 cytokine gene loci resembled the findings in TH2LPs (Fig. S2 C–E). Therefore, in TH2LPs and mTH2 cells, Bcl6 seems to directly outcompete STAT5 and indirectly attenuate GATA3 binding to TH2 cytokine gene loci. To investigate the effect of Bcl6 on the level of corresponding transcriptional regulators for chromatin remodeling, we examined TH2EPs and TH2LPs from WT, Bcl6-KO, and Bcl6-transgenic (Bcl6-TG) mice. Intracellular staining (Fig. S3A) and Western blotting (Fig. S3B) revealed similar levels of critical activators, including GATA3 and phosphorylated STAT5 (pSTAT5), regardless of Bcl6 levels at each culture phase. Notably, the pSTAT5+ population of TH2EPs is mainly included in the GATA3-expressing population and present at a similar ratio in WT and Bcl6-KO mice, regardless of IL-33 and/or TCR restimulation. TH2LPs exhibited no significant GATA3+ population but consistently expressed some pSTAT5, regardless of the Bcl6 genotype. Notably, GATA3 protein expression levels were similar between WT and Bcl6-KO TH2LPs after restimulation (Fig. S3A). Bcl6 protein levels had no apparent changes at each culture phase in WT and TG cells (Fig. S3B).
Fig. S2.
Ac-H3 levels and Bcl6 and GATA3 binding to TH2 cytokine gene loci in mTH2 cells. (A and B) Bcl6/STAT BSs and GATA3 BSs in the chromatin remodeling of TH2 cytokine gene loci. (A) Diagram of TH2 cytokine gene loci indicating regulatory regions [TH2 LCR, CNS, gene promoter regions, and Bcl6/STAT BS IL5BS in Il5; R5BS, R6BS, and R7BS in the TH2 LCR (RHS-5, RHS-6, and RHS-7) within Rad50; IL13BS in Il13 intron 1; BS1 and BS7 in the CNS1 and CNS2, respectively; BS2 in the Il4p; and BS3, BS4, and BS5 in the Il4 intron 2]. The positions of BSs and their sequences are indicated. The numbers indicate positions relative to the transcriptional start site of each gene, which is designated as +1. (B) Diagram of TH2 cytokine gene loci indicating GATA3 BSs (G1 in Il5p, G2 in RHS-7 within Rad50, CGRE in Il13p, G3 in the Il4 intron 2, G4 in the HS5a, and G5 in the CNS2). The positions of G sites are indicated. The numbers indicate positions relative to the transcriptional start site of each gene, which is designated as +1. (C) Levels of Ac-H3 in Bcl6-KO and WT mTH2 cells harvested from recipient spleens 28 d after the adoptive transfer using the same method described for Fig. 1. (D) Binding of Bcl6 and STATs to each BS in Bcl6-KO and WT mTH2 cells. (E) GATA3 binding to each G site in transferred (day 28) Bcl6-KO and WT TH2 cells (n = 4–5). Data are shown are means ± SEMs. Data are representative of (C and D) five or (E) four independent experiments with (C and D) n = 3 or (E) n = 4 recipient mice in each group. ND, not detected. *P < 0.05; **P < 0.01.
Fig. 2.
Role of Bcl6 in chromatin remodeling of TH2 cytokine gene loci. In vitro or transferred KJ-1-26+ TH2 cells [immunoprecipitation (IP) and LP] were analyzed by ChIP–quantitative PCR. The IP level at each site is presented as the relative fold enrichment compared with the minimum values. (A) Acetylation level of histone H3 at K9 and K14 in Bcl6-KO, WT, and Bcl6 inhibitor-pretreated WT TH2 cells. (B) Binding of Bcl6, STAT5, and STAT6 to each BS in Bcl6-KO and WT TH2 cells. (A and B) Data are pooled from five to seven independent experiments. (C) GATA3-binding G sites in Bcl6-KO and WT TH2 cells. Data shown are means ± SDs (n = 5–6). All results are representative of (A) six or (B and C) seven independent experiments with similar outcomes. ND, not detected. *P < 0.05; **P < 0.01.
Fig. S3.
Analysis of the expression of Bcl6 and critical transcriptional factors for cytokine production in Bcl6-KO, Bcl6-WT, and Bcl6-TG TH2 cells at the EP and LP stages. (A) FACS analysis of pSTAT5- and GATA3-expressing cells among KJ-1-26+ CD4 T cells before and after IL-33 and/or TCR restimulation. The figure shows representative data for TH2EPs and TH2LPs. The numbers in each corner represent the percentages of T cells in the column. NSt, nonstimulation. (B) All FACS data are representative of three independent experiments with similar results.
Dampening of Bcl6-Mediated Suppressor Activity by an Intron Enhancer in the Il4 Locus.
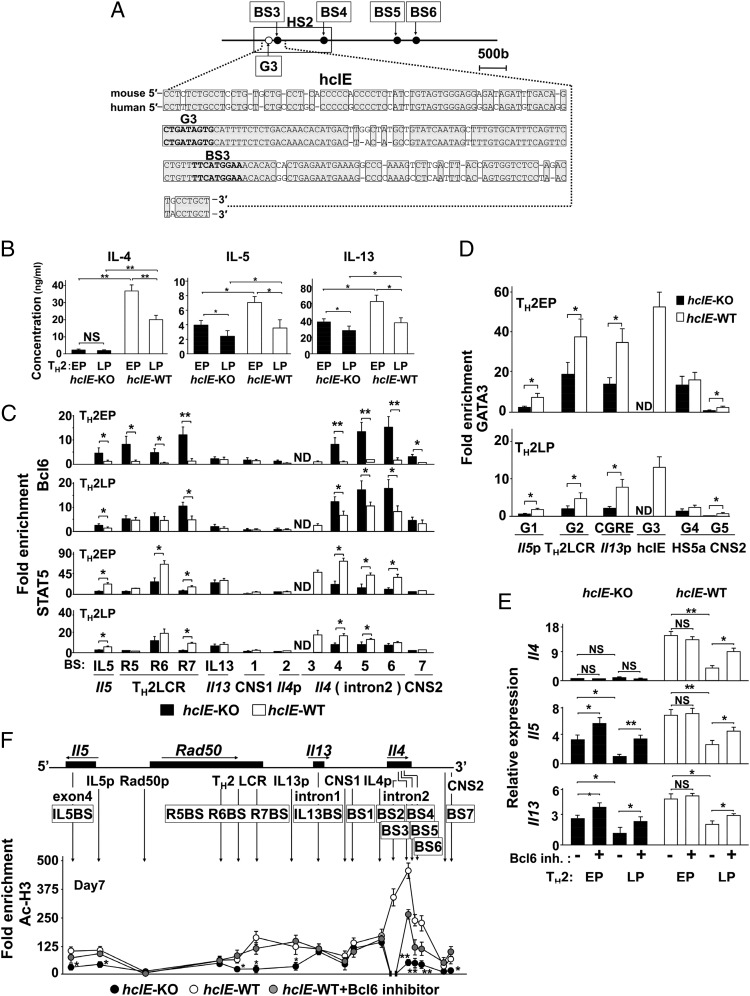
We focused on the Il4 intron 2 region, wherein Bcl6/STAT5 strongly associates with multiple sites in mTH2 cells. The DNA sequences of this 222-bp region, which included BS3 and G3, are highly conserved between mice and humans and designated as the highly conserved intron enhancer (hcIE) (Fig. 3A). The hcIE was included in DNase I hypersensitive sites (HS)2 (1.2 kbp), at which G3 was identified as a critical regulatory region for GATA3 binding-mediated Il4 expression in a study of HS2-KO mice (26). To examine the role of hcIE, we generated hcIE-KO mice (Fig. S4) and observed markedly diminished IL-4 production in both hcIE-KO TH2EPs and TH2LPs compared with that in WT cells. Notably, hcIE-KO TH2EPs and TH2LPs also displayed reduced, albeit partially reduced, IL-5 and IL-13 production relative to WT cells, even in the presence of abundant exogenous IL-4 (Fig. 3B). In TH2EPs, increased Bcl6 binding and decreased STAT5 binding at Il5, Rad50, and Il4 intron 2 (BS4–BS6) and decreased GATA3 binding at Il5, Rad50, Il13, and CNS2 were widely observed across the TH2 cytokine gene loci when hcIE was abolished (Fig. 3 C and D). The differences in transcriptional factor binding dwindled between WT and hcIE-KO TH2LPs.
Fig. 3.
Role of hcIE in the Bcl6 suppressive function for TH2 cytokine gene loci. (A) A conserved sequence [positions +1,180 to +1,401 relative to the transcription start site; Mouse Genome Informatics (MGI) accession no. 96556] in the HS2 region of mouse hcIE is shown along with human hcIE. Conserved sequences between mice and humans are indicated by shaded boxes. (B) Cytokine production (EP and LP) by WT and hcIE-KO TH2 cells estimated after restimulation with anti-CD3 Abs for 48 h. (C and D) Analysis of binding levels of (C, Upper) Bcl6, (C, Lower) STAT5, and (D) GATA3 by ChIP–quantitative PCR for hcIE-KO and WT TH2 cells. (E and F) Effect of Bcl6 on cytokine gene expression estimated in EPs and LPs after restimulation for 24 h and acetylation of histone H3 at K9 and K14 in EPs at rest with/without Bcl6 inhibitor in hcIE-KO and WT TH2 cells. Data are shown as means ± SDs. Data are representative of (B) four, (C) eight, (D and E) six, or (F) seven independent experiments with (B) n = 4–5, (C) n = 7–8, (D) n = 5–6, (E) n = 6–8, or (F) n = 6–7 samples in each experiment. ND, not detected; NS, not significant. *P < 0.05; **P < 0.01.
Fig. S4.
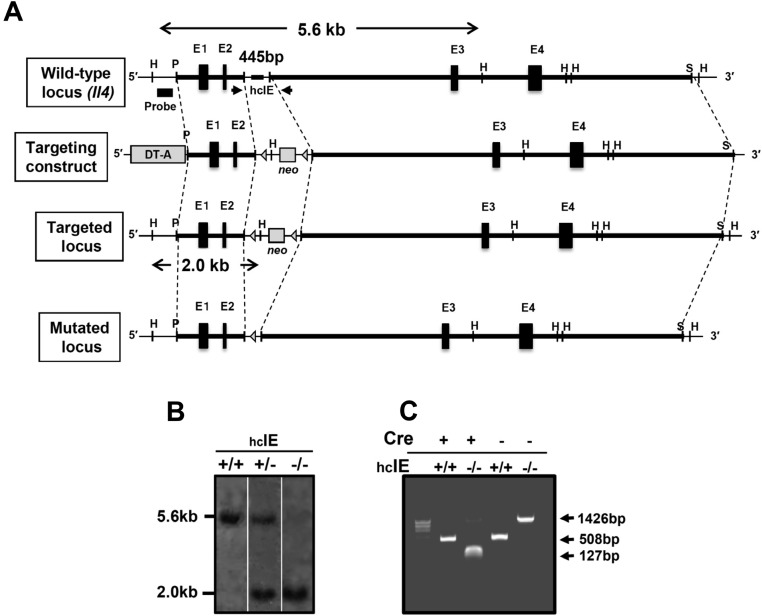
Strategy for targeted deletion of hcIE in ES cells. (A) WT allele: genomic organization and a partial restriction map of the Il4 locus, including hcIE. Targeting construct: a 445-bp segment that included hcIE was replaced by an loxP-flanked neo. Mutated locus after Cre recombination: Cre-mediated excision of the neo cassette in the germ line resulted in the final arrangement. DT-A, diphtheria toxin A chain expression cassette; E1–E4, four exons of the Il4 gene; H, HindIII; P, PstI; S, SmaI; triangles, loxP sites. (B) Southern blot analysis to ensure correct integration of the targeting construct in hcIE-KO mice. Genomic DNA was prepared from mouse tail biopsies, digested with PstI and HindIII, separated by electrophoresis, and hybridized with the indicated probe. The WT and targeted alleles yielded 5.6- and 2.0-kbp fragments, respectively. (C) PCR analysis of Cre-mediated neo cassette excision from the targeting construct in hcIE-KO mice on the CD4-Cre-Tg background. Cre-mediated excision from genomic DNA was confirmed by PCR. Primers were designed for the 3′- and 5′-flanking regions of the targeted locus and are indicated by arrows. The WT, targeted, and mutated alleles yielded 508-, 1,426-, and 127-bp fragments, respectively.
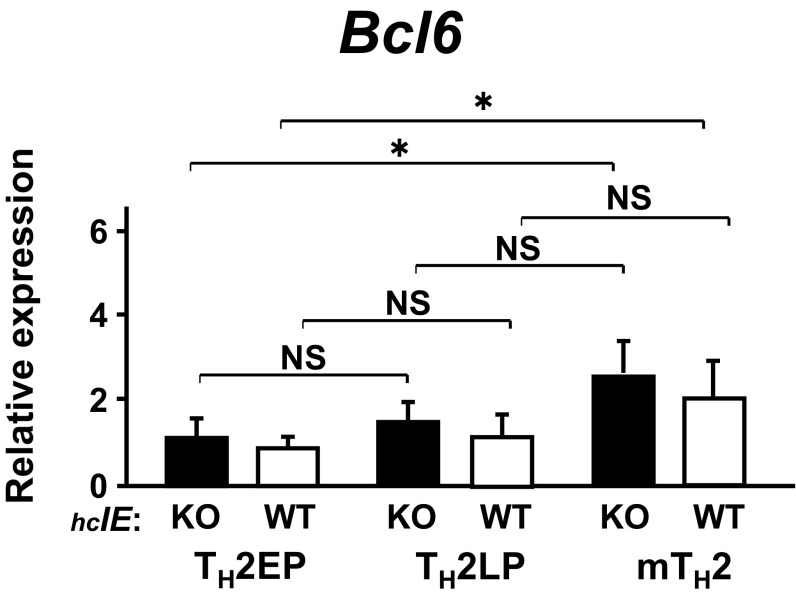
Because Bcl6 binding was augmented in hcIE-KO TH2 cells, hcIE may dampen this Bcl6-mediated suppressor activity. In fact, TH2 cytokine gene expression, excluding Il4, was significantly restored in hcIE-KO TH2EPs and TH2LPs as well as in WT TH2LPs after Bcl6 inhibitor treatment (Fig. 3E). In accordance with gene expression, Ac-H3 levels at Il5p and Il13p (except at Il4p) and those at various BSs (excluding Il13BS, BS1, and BS2) were distinctly reduced in hcIE-KO TH2EPs compared with those in WT TH2EPs (Fig. 3F). The reduced Ac-H3 levels were significantly restored in hcIE-KO TH2EPs after Bcl6 inhibitor treatment, although this inhibitor had less effect on the residual intron 2 region relative to other sites. The Bcl6 mRNA expression level in WT mTH2 cells but not in WT TH2LPs cells was slightly elevated compared with that in WT TH2EPs, whereas the level in each TH2 cell type was constant, regardless of hcIE function (Fig. S5). Therefore, hcIE is critical for chromatin remodeling of TH2 cytokine gene loci in TH2 cells through the regulation of Bcl6-mediated suppressor activity.
Fig. S5.
Expression of Bcl6 in TH2 cells at EP, LP, and memory stages of hcIE-KO and WT. The amounts of mRNA were measured by qRT-PCR. Data are shown as means ± SD (n = 6). All results are representative of three independent experiments with similar outcomes. NS, not significant. *P < 0.05.
Association Between IL-33 and Bcl6 in TH2 Cells.
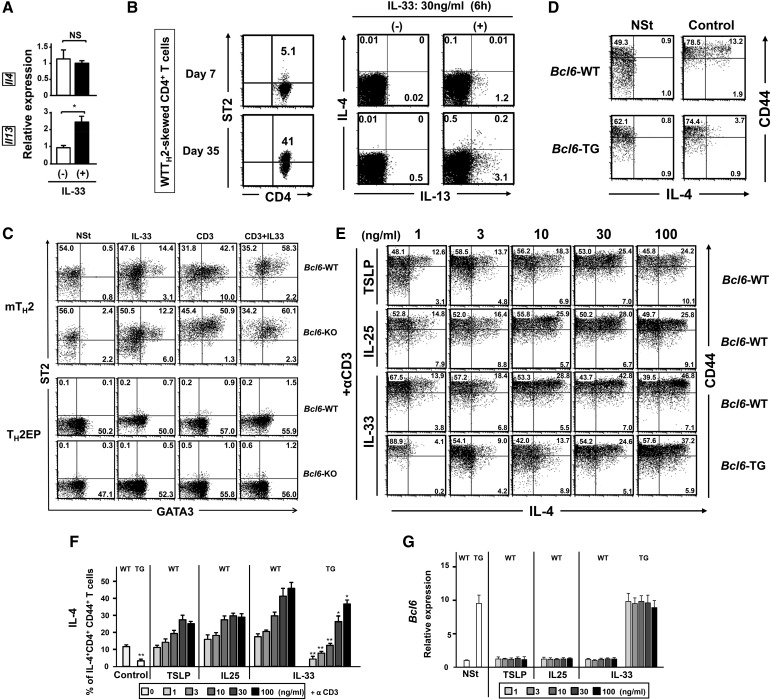
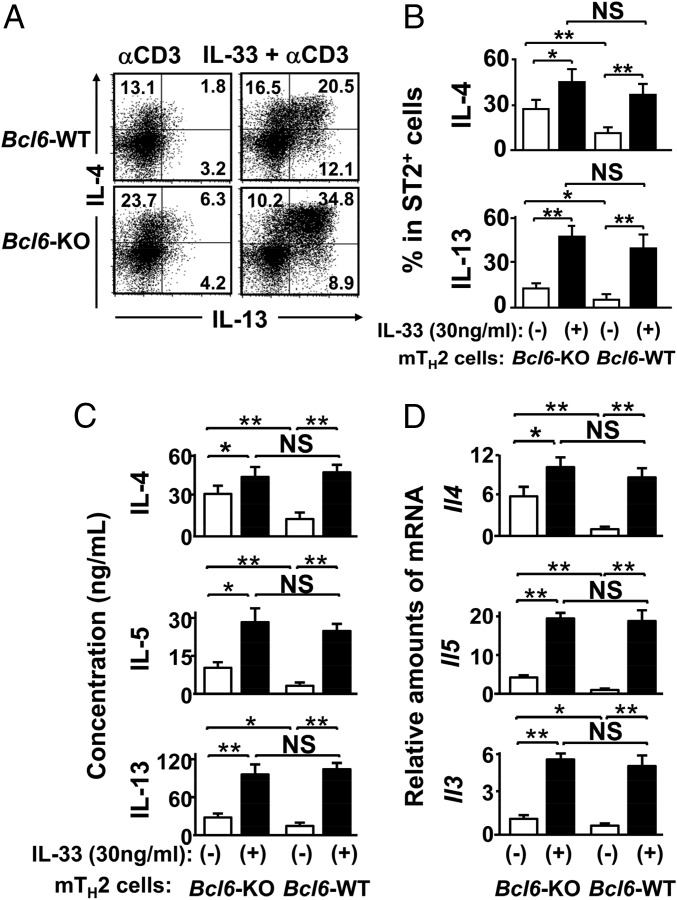
The TH2-promoting cytokine IL-33 is known to induce IL-5 and IL-13, but not IL-4, production in TH2 cells (19, 20). We confirmed this effect of IL-33 on TH2EPs (Fig. S6A). Increased expression of ST2, an IL-33 receptor subunit, has been shown in ex vivo WT mTH2 cells (27), and we also confirmed augmented ST2 expression in WT TH2LPs (Fig. S6B) as well as WT mTH2 cells (Fig. S6C). The range of effective concentrations of IL-33 for inducing IL-4 in WT mTH2 cells was wider than those of the other TH2-promoting cytokines, namely TSLP and IL-25 (Fig. S6D). TCR-restimulated IL-4 production was significantly reduced in Bcl6-TG mTH2 cells compared with that in WT cells. In contrast, there was no significant difference in IL-4 production between WT and Bcl6-KO mTH2 cells in the presence of IL-33 (Fig. 4). To examine TH2 phenotypes, TH2 cells were simultaneously analyzed for ST2 and intracellular GATA3 expression levels. No significant differences were observed between the WT and Bcl6-KO for TH2EPs and mTH2 cells, regardless of IL-33 and/or TCR restimulation (Fig. S6C). Restimulation induced no apparent changes in ST2 expression or GATA3 protein levels in WT or Bcl6-KO TH2EPs, whereas both ST2 expression and GATA3 expression levels were similarly increased in WT and Bcl6-KO mTH2 cells after IL-33 and TCR restimulation. When we focused on the functional association between IL-33 and Bcl6 in mTH2 cells, 30 ng/mL IL-33 augmented IL-4 production strongly in WT mTH2 cells and modestly in Bcl6-KO mTH2 cells (Fig. 4 A–C) and concomitantly, induced Il4 expression after TCR stimulation (Fig. 4D). The effects of IL-33 on IL-5 (Fig. 4C) and IL-13 (Fig. 4 A–C) production and their gene expression (Fig. 4D) were apparently observed in WT mTH2 and Bcl6-KO cells. These effects of IL-33 on each TH2 cytokine were similar in the cell types, although cytokine production was dominated by Bcl6-KO cells rather than WT cells in the absence of IL-33.
Fig. S6.
Effects of TH2-promoting cytokines on cytokine production by TH2 cells of Bcl6-WT or Bcl6-TG. (A, B, and D–F) Effect of IL-33 on TCR activation-induced cytokine production by TH2EPs. TH2 cells were incubated with IL-33 (30 ng/mL) or medium alone for 3 h before restimulation with anti-CD3 Abs. (A) Levels of mRNA of Il4 and Il13 in WT TH2EPs 24 h after restimulation. mRNA levels were measured by qRT-PCR. (B) FACS analysis of (Left) ST2 surface expression and (Right) intracellular TH2 cytokines (IL-4 and IL-13) in TH2EPs and TH2LPs in the presence of IL-33 alone without restimulation. (C) FACS analysis of ST2 surface expression and intracellular GATA3 in TH2EPs and mTH2 cells before and after IL-33 and/or TCR restimulation. (D and E) Effect of IL-33, IL-25, or TSLP on TCR activation-induced IL-4 production by mTH2 cells (CD44+). TH2 cells were incubated with (D and F) medium alone (control) or (E and F) each cytokine (1, 3, 10, 30, or 100 ng/mL) for 3 h before restimulation with anti-CD3 Abs. (B–E) The numbers in the FACS analysis represent the percentages of T cells in the column in the flow cytometry data. (F) Percentage of IL-4+ population in mTH2 cells (CD44+) of WT or TG. (G) Expression of Bcl6 mRNA of mTH2 cells of WT or TG. mRNA levels were measured by qRT-PCR. Data are shown as means ± SDs (n = 3–6). (A–F) All results are representative of three independent experiments with similar outcomes. NS, not significant; NSt, nonstimulation; TG, Bcl6-TG; WT, Bcl6-WT. **P < 0.01 vs. WT; *P < 0.05 vs. WT.
Fig. 4.
Role of IL-33 in cytokine production by mTH2 cells. KJ-1-26+ TH2EPs from WT or Bcl6-KO mice were adaptively transferred into naïve WT BALB/c mice. Twenty-eight days later, mTH2 cells were isolated from the recipient spleens. These mTH2 cells were incubated ex vivo with IL-33 or medium alone for 3 h before reactivation with anti-CD3 Abs. (A) FACS analysis for IL-4– and IL-13–producing cells among TH2 cells (gate: ST2+ populations) after restimulation. The figure shows representative FACS data. The numbers in each corner represent the percentages of T cells in the column. (B) Percentage of the indicated cytokine-positive population (gate: ST2+ TH2 cells). (C) Protein concentration in culture supernatants at 48 h and (D) mRNA levels at 24 h for IL-4, IL-5, and IL-13 produced by the sorted ST2+ TH2 cells after restimulation. (B–D) Data are shown as means ± SEMs (n = 7–8). All results are representative of eight independent experiments with similar outcomes. NS, not significant. *P < 0.05; **P < 0.01.
Effects of IL-33 on Bcl6-Mediated Histone Modification.
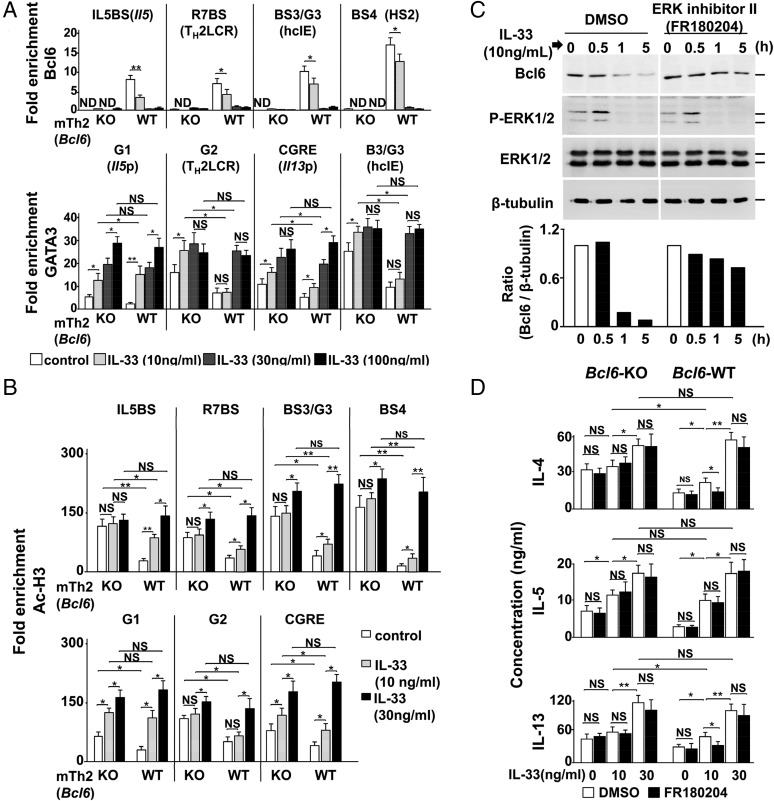
Because differences in TCR-stimulated cytokine production between WT and Bcl6-KO mTH2 cells were diminished by IL-33 pretreatment in a concentration-dependent manner, we hypothesized that IL-33 may exert its effect by attenuating the function of Bcl6. In WT mTH2 cells, Bcl6 binding to BSs was reduced by exogenous IL-33 partially at 10 ng/mL and fully at concentrations exceeding 30 ng/mL (Fig. 5A, Upper), at which histone acetylation within TH2 cytokine gene loci resembled that in Bcl6-KO cells. Bcl6 mRNA expression did not significantly change in mTH2 cells after IL-33 treatment (Fig. S6E). Because GATA3 protein levels were minimal in TH2LPs (Fig. S3) and mTH2 cells (Fig. S6C) at rest in WT and Bcl6-KO mice, we examined GATA3 binding to these loci by IL-33, which induces Gata3 expression and/or phosphorylation and subsequent IL-5 and/or IL-13 production (27).
Fig. 5.
Role of IL-33 in the functioning of Bcl6 at TH2 cytokine gene loci. (A and B) ChIP analyses of (A, Upper) Bcl6 and (A, Lower) GATA3 binding and (B) Ac-H3 in the TH2 cytokine gene loci of Bcl6-WT KJ-1-26+ mTH2 cells isolated from recipient spleens. Cells were incubated with IL-33 (10, 30, or 100 ng/mL) or medium alone as a control for 6 h before the analysis. (C) Bcl6 protein levels in TH2LPs from immediately before (0 h) until 5 h after stimulation with IL-33 (30 ng/mL) in the presence of an ERK inhibitor (FR180204) or vehicle. Bcl6, pERK-1/2, and ERK-1/2 protein levels were analyzed. β-Tubulin was used as a loading control. The figure shows representative data from (C, Upper) a Western blot and (C, Lower) densitometric analysis. The quantified amount of each protein is indicated as the ratio of densitometric values of bands containing the protein between controls and experimental samples. (D) TH2 cytokine production by Bcl6-WT mTH2 cells. Concentrations of TH2 cytokines in the culture supernatants of mTH2 cells preincubated ex vivo with IL-33 for 3 h followed by activation with anti-CD3 Abs in the presence of IL-33 with/without FR180204 for 48 h. Data are shown as means ± SEMs (n = 5–12). All results are representative of (A–C) six or (D) seven independent experiments with similar outcomes. NS, not significant. *P < 0.05; **P < 0.01.
Although the isolated WT mTH2 cells displayed inferior GATA3 binding to the major sites compared with Bcl6-KO cells, IL-33 could significantly augment this binding (Fig. 5A, Lower) along with increases in histone acetylation at the responsible sites (Fig. 5B) to similar levels between Bcl6-KO and WT cells. The effects of IL-33 on histone acetylation within TH2 cytokine gene loci occurred in a concentration-dependent manner. Bcl6 detaching and GATA3 binding were particularly associated with histone acetylation regarding TH2 cytokine genes. Chromatin modification of Il5 occurred in response to IL-33 at lower concentrations than those observed for Il4 and Il13 in WT mTH2 cells, indicating that regulation of Il5 is sensitive to IL-33 function among the gene foci. A maximum concentration of IL-33 broadly increased histone acetylation levels at BSs other than G sites to a similar extent in both WT and Bcl6-KO mTH2 cells.
Because ERK-1– and ERK-2–mediated phosphorylation induces Bcl6 degradation (28), we hypothesized that IL-33–induced MAPK activation (19) is important for Bcl6-mediated decreases in TH2 cytokine production in mTH2 cells. In cultured TH2LPs, ERK phosphorylation levels increased within 30 min of stimulation with 10 ng/mL IL-33; conversely, Bcl6 protein levels decreased to 10% of baseline, but they were restored in the presence of FR180204, which selectively inhibits ERK-1/2 activity (29) (Fig. 5C). IL-4, IL-5, and IL-13 production was increased by IL-33 in a concentration-dependent manner in WT and Bcl6-KO mTH2 cells. In particular, IL-5 production levels in both cell types were remarkably similar in the presence of IL-33 at any concentration, and its production was not prevented by ERK inhibition. In WT mTH2 cells, 10 ng/mL IL-33 slightly increased the production of IL-4 and IL-13, and their levels in WT cells approached those in KO cells. This effect of IL-33 was significantly suppressed by ERK inhibition in WT mTH2 cells but not KO cells. A higher concentration of IL-33 (100 ng/mL) further augmented IL-4 and IL-13 production; meanwhile, their levels were not reduced by ERK inhibition, and they were similar between WT and Bcl6-KO mTH2 cells (Fig. 5D), indicating that IL-33 could introduce permissive chromatin modification of TH2 cytokine genes via some critical functions, such as GATA3 activation, in addition to Bcl6 degradation.
Role of Bcl6 in the Effects of IL-33 Regarding an mTH2 Cell-Mediated Allergic Response.
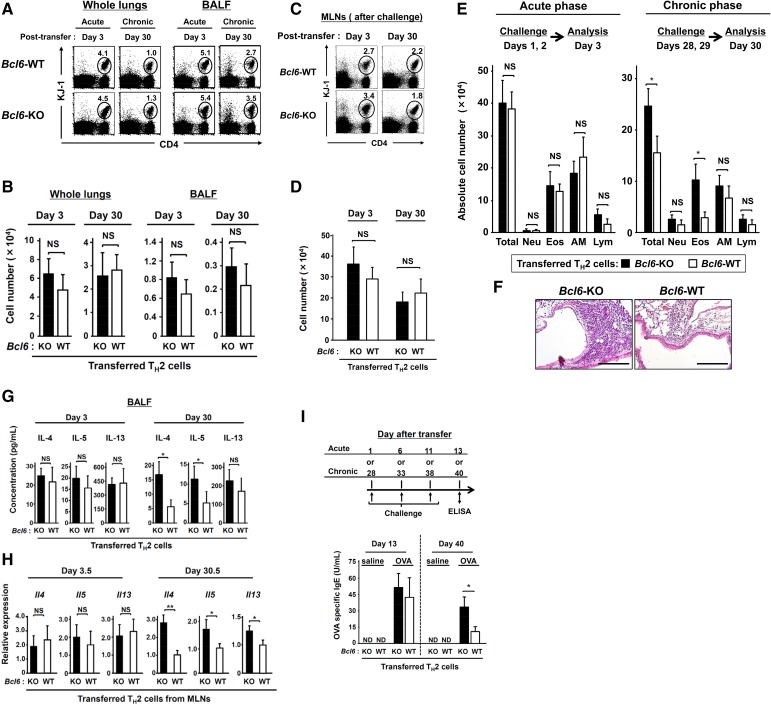
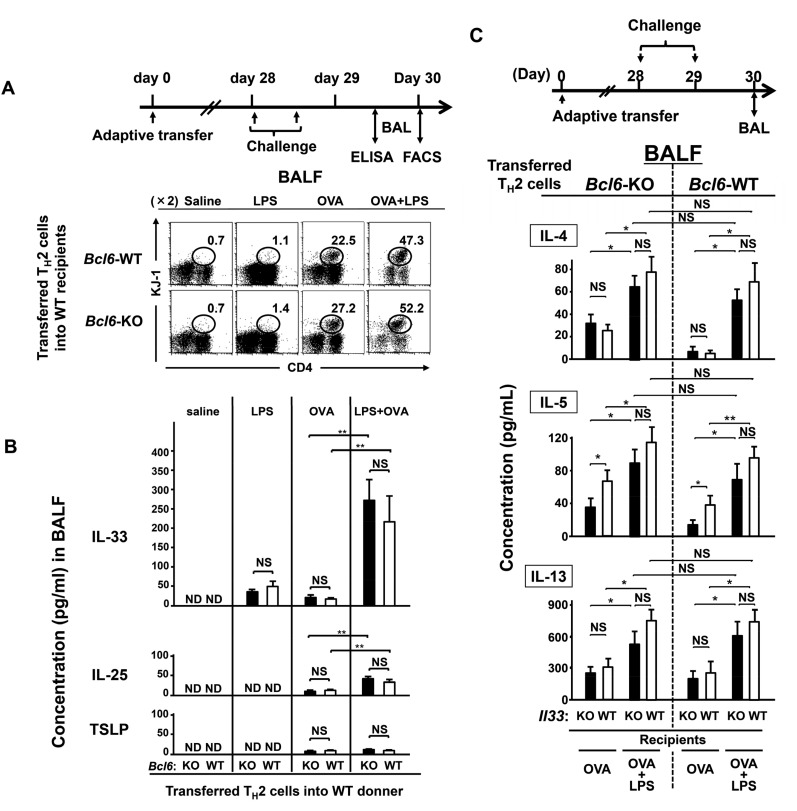
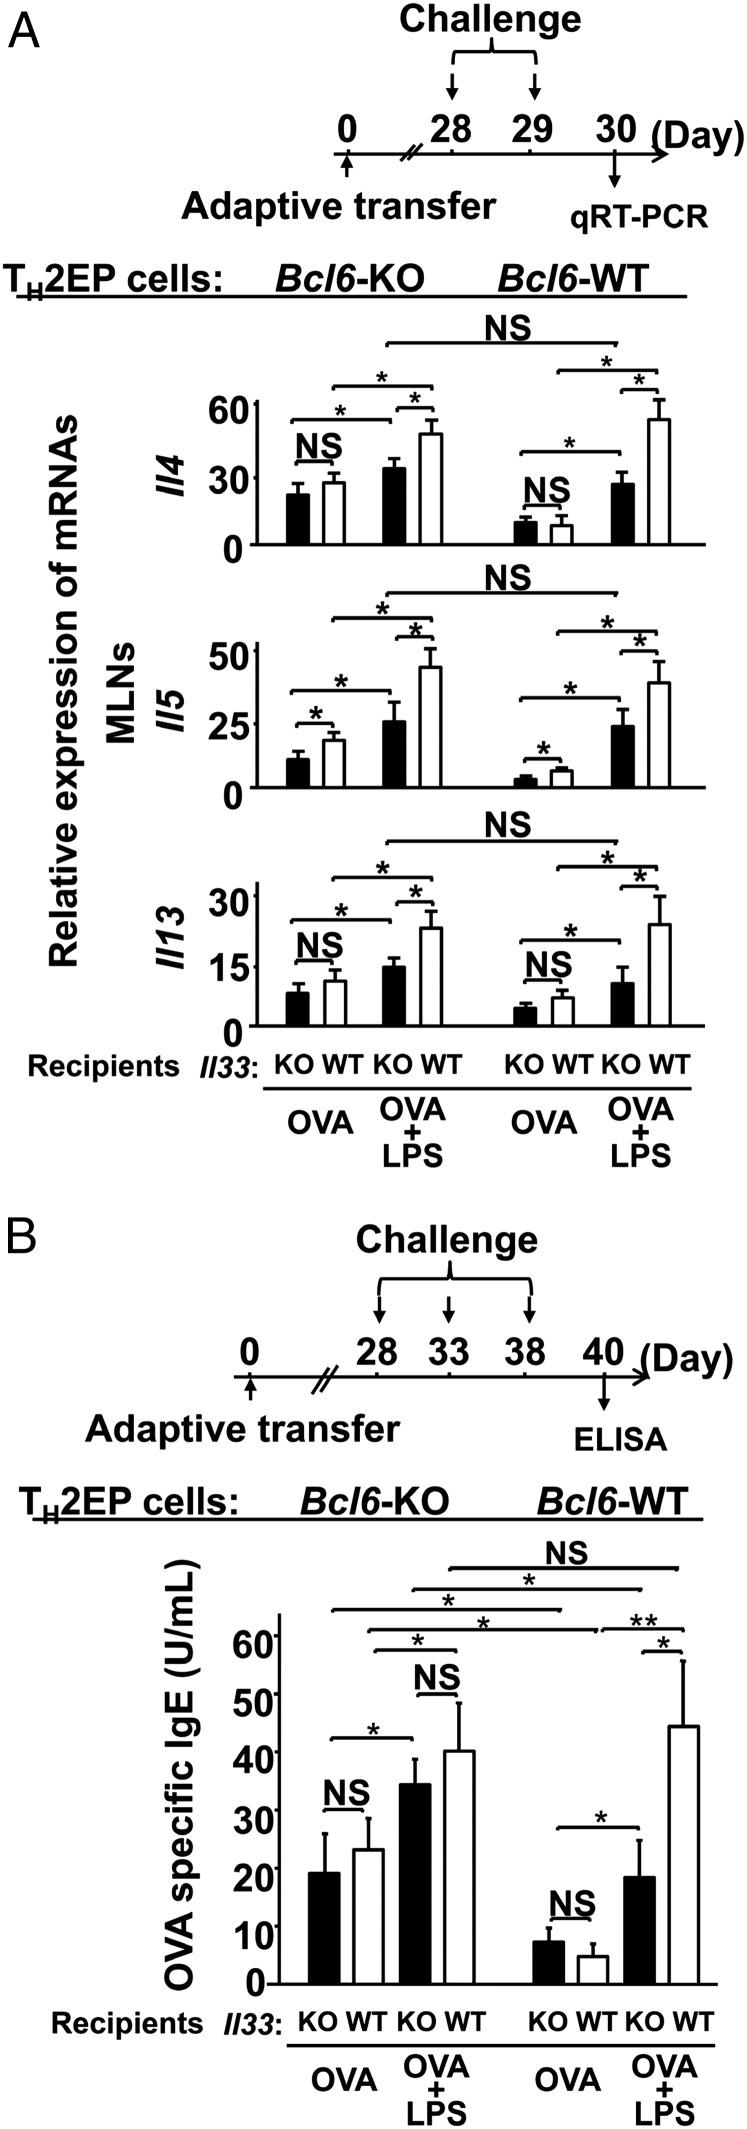
When Bcl6-KO or WT TH2EPs on a DO11.10 background were adoptively transferred into naïve WT mice, we observed that Bcl6-KO mTH2 cells exacerbated allergic airway inflammation with increases in TH2 cytokine production and IgE Ab levels during the chronic phase (Fig. S7). Accordingly, to examine the association between Bcl6 and high IL-33 levels, we modified our OVA model by simultaneously administering bacteria-derived LPSs, which are known to induce IL-33 production (30) (OVA-LPS model). When Il33-WT recipients were challenged with OVA or OVA plus LPS during the chronic phase, LPS augmented the OVA-induced recruitment of mTH2 cells (Fig. S8A) and increase in IL-33 levels, which were much larger than those of IL-25 and TSLP (Fig. S8B) in the lungs in both Bcl6-KO and WT TH2 cell recipients. In response to excess IL-33 production in the OVA-LPS model (Fig. 6A), TH2 cytokine gene expression was augmented in mTH2 cells isolated from mediastinal lymph nodes (MLNs) similarly among Il33-WT recipients of Bcl6-KO and WT TH2 cells relative to cells challenged with OVA alone (less IL-33 production). In the OVA-LPS model, Il33-KO recipients displayed a significant attenuation of expression of each cytokine gene, regardless of the Bcl6 genotype of TH2 cells (Fig. 6A). Expression of Il14, Il5, and Il13 was not different between WT mTH2 and Bcl6-KO cells, although differences in Il4 expression in Bcl6-KO cells between Il33-KO and Il33-WT recipients were modest compared with those in WT cells (Fig. 6A). Notably, in the presence of OVA alone, Il4 and Il13 expression was not affected by the presence of IL-33 (Fig. 6A, Middle). Conversely, TH2 cytokine levels in bronchial alveolar lavage fluid (BALF) were apparently increased in the OVA-LPS model for both genotypes of TH2 cells compared with those in the OVA model (Fig. S8C). However, contrary to the gene expression profile in MLNs, cytokine protein levels were not significantly affected by the absence of IL-33 in this model (Fig. S8C). Finally, serum IgE levels were markedly increased to a similar extent among all Il33-WT recipients with WT or Bcl6-KO mTH2 cells in the OVA-LPS model compared with those in the OVA alone model (Fig. 6B). On the contrary, in the OVA alone model, IgE levels in Il33-WT recipients with Bcl6-KO mTH2 cells were more strongly elevated than those in the presence of WT mTH2 cells. However, IL-33 was not significantly involved in IgE Ab production, regardless of the Bcl6 genotype of mTH2 cells in not only the OVA model but also, the OVA-LPS model. The IgE production levels closely corresponded to gene expression levels in MLNs rather than to those in BALF.
Fig. S7.
Role of Bcl6 in mTH2 cell functions for allergic responses. Despite the lack of significant differences between WT and Bcl6-KO TH2 cell migration into the recipient lungs and MLNs, Bcl6-KO mTH2 cells exacerbated allergic airway inflammation after OVA challenge during the chronic phase; conversely, no difference was observed in inflammation between recipient groups during the acute phase. TH2 cytokine levels in BALF and mRNA expression levels in MLNs also increased in Bcl6-KO TH2 cell recipients challenged during the chronic phase but not during the acute phase. (A–H) KJ-1-26+ TH2 (3 × 10⁷) cells of WT or Bcl6-KO were transferred i.v. into naïve BALB/c mice and challenged with an instillation of OVA on days 1 and 2 or 28 and 29 posttransfer. Frequencies and absolute numbers of recruited TH2 cells (KJ-1-26+) in the whole lungs and (A and B) BALF or (C and D) MLNs of recipient mice were analyzed via FACS on day 3 or 30 posttransfer (24 h after the final challenge). (A and C) Numbers indicate the percentages of KJ-1-26+ CD4+ cells (within ovals) among total lymphocytes. (E) Absolute numbers of total cells, neutrophils (Neu), eosinophils (Eos), alveolar macrophages (AM), and lymphocytes (Lym) in BALF collected from recipients postchallenge. (F) H&E-stained, formalin-fixed lung sections isolated from mice transferred with (Left) WT-TH2 cells and (Right) Bcl6-KO TH2 cells postchallenge. (Magnification: 200×.) (G) TH2 cytokine concentrations in BALF 24 h after the final challenge. (H) TH2 cytokine mRNA levels in isolated TH2 cells from MLNs at 36 h after final challenge. (I) Recipients were challenged with three instillations of either OVA or saline at 5-d intervals beginning on day 1 or 28 posttransfer. Serum from each recipient was subjected to analysis to determine the titer of OVA-specific IgE at 48 h (day 13 or 40) after the final challenge. (A, C, and F) Representative data are presented. (B, D, E, and G–I) Data are shown as means ± SEMs (n = 6–7). (A–H) All results are representative of (A–G) three and (H) four independent experiments with similar outcomes. (I) Data (means ± SDs; n = 10–12) were pooled from three independent experiments. ND, not detected; NS, not significant. *P < 0.05; **P < 0.01.
Fig. S8.
Role of Bcl6 in the effects of IL-33 on mTH2 cell-mediated allergic responses. (A and B) WT or Bcl6-KO KJ-1-26+ TH2EPs (3 × 10⁷) were adoptively transferred into Il33-WT BALB/c background recipient mice. The recipients were challenged with LPS, OVA, or OVA plus LPS twice during the chronic phase. (C) WT and Bcl6-KO KJ-1-26+ TH2EPs were adoptively transferred into Il33-WT or Il33-KO BALB/c background recipient mice. The recipient mice were given two intratracheal administrations of OVA or LPS plus OVA at a 12-h interval on day 28 posttransfer. (A) Representative results of a flow cytometric analysis of mTH2 cells in BALF from each recipient at 36 h (day 30) after the final challenge. Numbers indicate the percentages of KJ-1-26+ CD4+ cells (ovals) among the total lymphocytes. (B) IL-33, IL-25, and TSLP concentrations in BALF from the indicated recipients at 24 h after the final challenge (day 29). (C) Concentrations of TH2 cytokines in BALF collected from the recipients at 36 h after the last challenge (day 30). Data are shown as means ± SEMs (n = 7–10). All results are representative of (A) three, (B) five, or (C) six independent experiments with similar outcomes. NS, not significant; ND, not detected. *P < 0.05; **P < 0.01.
Fig. 6.
Role of Bcl6 on the effects of IL-33 regarding mTH2 cell-mediated allergic responses. WT and Bcl6-KO KJ-1+ TH2EPs (3 × 10⁷) were adoptively transferred into IL-33–WT or –KO BALB/c background recipient mice. (A) The recipient mice were given two intratracheal administrations of OVA or LPS plus OVA at a 12-h interval on day 28 posttransfer. Levels of Il4, Il5, and Il13 mRNA in mTH2 cells isolated from MLNs 36 h after the final challenge (day 30) are shown. (B) Recipients were challenged with three instillations of either OVA or saline at 5-d intervals beginning on day 1 or 28 posttransfer. Serum from each recipient was subjected to analysis to determine the titer of OVA-specific IgE Abs at 48 h (day 40) after the final challenge. Data are shown as means ± SEMs with (A) n = 7–10 or (B) n = 10–13. (A) Results are representative of three independent experiments with similar outcomes. (B) Data are pooled from five independent experiments. NS, not significant. *P < 0.05; **P < 0.01.
Discussion
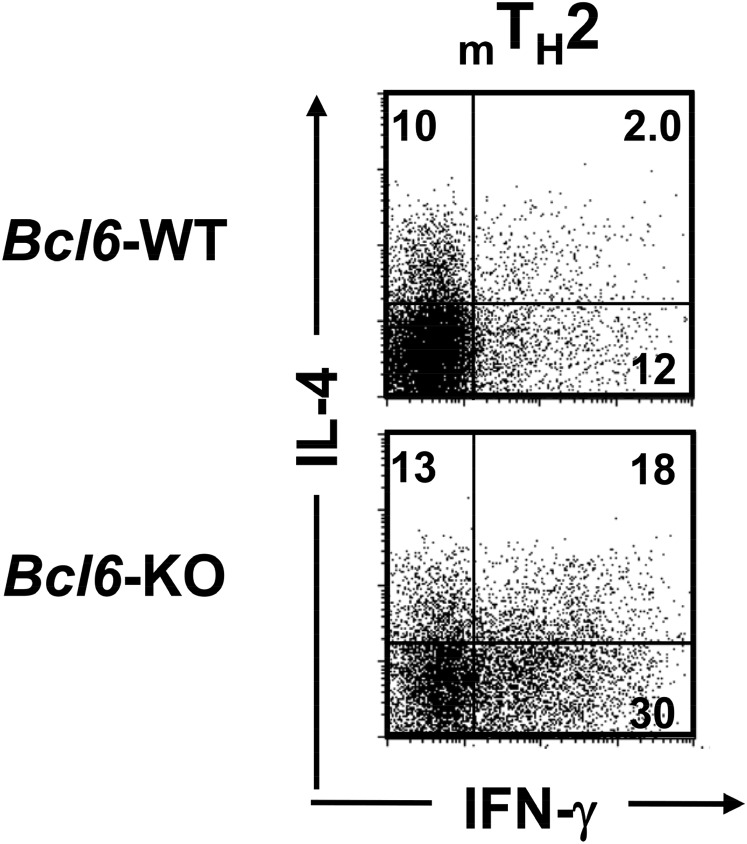
We showed that TH2 cytokine genes are negatively regulated by Bcl6 through chromatin remodeling and that interactions between Bcl6 and STAT5 physiologically contribute to histone modulation and consequently, cytokine production in mTH2 cells rather than to TH2 cell differentiation. Although Bcl6-KO mice exhibit severe general tissue eosinophilia with striking cytokine production of the TH2 type but not the TH1 type, the intrinsic functions of Bcl6 for TH cell differentiation, in particular TH1 and TH2, remain obscure. In earlier reports, we and other groups previously showed that Bcl6 has no significant intrinsic function for both TH1 and TH2 differentiation in the full commitment experiments in vitro. In later studies, which focused on TFH cells, Bcl6 was shown to suppress effector T cells, including TH1, TH2, and TH17 cells, resulting in the induction of TFH cell differentiation. For TFH differentiation, exogenous Bcl6 in T cells was found to suppress T-bet at the gene level. Conversely, Bcl6 suppressed GATA3 function by reducing protein stability or repressing gene expression via microRNA. By contrast, we observed in this study that the expression of T-bet as well as Gata3 was not influenced by Bcl6 in TH2EPs, TH2LPs, or mTH2 cells. T-bet expression in each type of TH1 cells was also not reduced by intrinsic Bcl6. On the contrary, intrinsic Bcl6 attenuated TH2 but not TH1 cytokine production by TH2EP-derived memory T cells in BALB/c-recipient mice. However, when TH2EPs were adaptively transferred into nude mice, Bcl6 appeared to play an antagonistic role for both TH1 and TH2 cytokine production in the memory donor T cells (Fig. S9). There was a possibility that TH2EPs transferred into nude mice possibly experience homeostatic proliferation. It was previously indicated that a memory phenotype, central memory (CM) T cells, was maintained by homeostatic proliferation induced under a lymphopenic condition. Because CM T cells display plasticity of helper function (31), TH2EPs might proliferate to give rise to CM TH1 cells in nude mice, especially under the Bcl6-KO condition, suggesting that Bcl6 could be involved in TH cell functions other than TH2 cells under certain settings. In this study, to focus on authentic mTH2 cells, we analyzed WT BALB/c mice as a more representative physiological condition as opposed to nude mice (32).
Fig. S9.
Regulatory role of Bcl6 in mTH2 cells expanded in nude mice. TH2 cells were differentiated from naïve T cells obtained from Bcl6-KO and WT DO11.10 mice, which express the clonotypic KJ-1-26 TG TCR specific to the OVA peptide. TH2EPs from WT or Bcl6-KO mice were adaptively transferred into nude mice. Twenty-eight days later, mTH2 cells were isolated as KJ-1-26+ CD4 T cells from the recipient spleens. FACS analysis of IL-4– and IFN-γ–producing cells in KJ-1-26+ CD4 T cells restimulated with anti-CD3 Abs. The figure shows representative data for mTH2 cells. All FACS data are representative of three independent experiments with similar results. The numbers in each corner represent the percentages of T cells in the column.
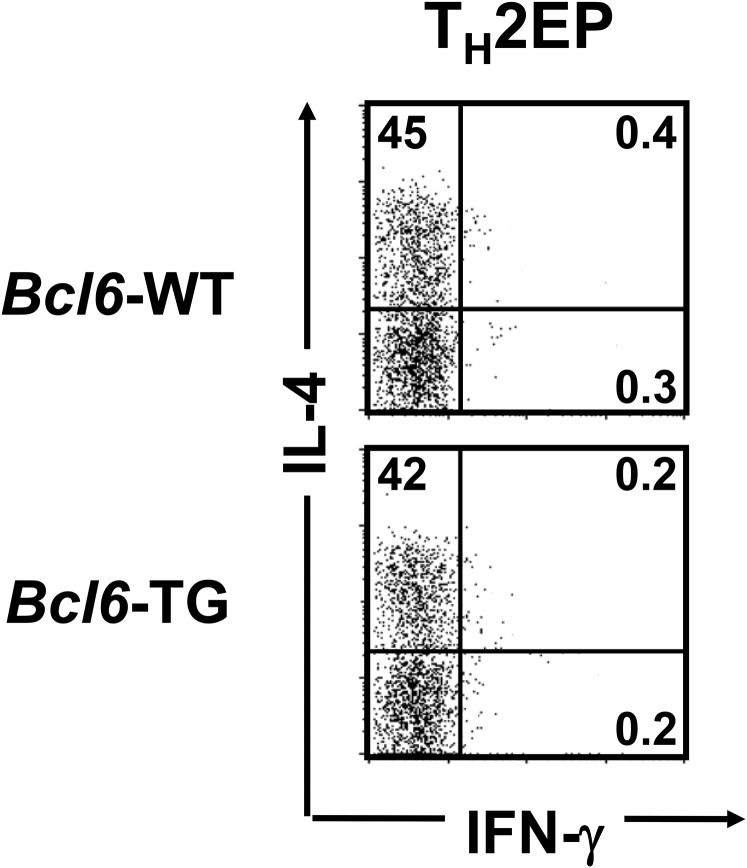
For STAT5, GATA3 is required for rapid histone acetylation at HS2 during early TH2 cell differentiation (33). Zhu et al. (33) also showed that STAT5-induced chromatin accessibility at the TH2 cytokine loci of TH2 cells was augmented by GATA3 overexpression, indicating that GATA3 binding to G3 may support STAT5 binding to BSs in TH2 cytokine loci and maintain the permissive chromatin remodeling of TH2 cells. Therefore, STAT5 and GATA3 cooperate in permissive histone modification of the Il4 locus by binding to hcIE during TH2 cell differentiation and memory development. GATA3 directly activates Il5p and Il13p but not Il4p (34, 35). IL-5 and IL-13 production is completely lost after the conditional deletion of Gata3 after TH2 cell lineage commitment (35). However, the IL-4 production level is apparently reduced in these Gata3-deleted TH2 cells, despite no change in IL-4+ cell frequency. Thus, hcIE may induce and maintain active chromatin structures of the Il4 locus to control the efficiency and rate of transcription by protecting them against epigenetic silencing, similar to a globin gene enhancer (36). Accordingly, to induce chromatin activation effectively in the Il4 locus, STAT5- and GATA3-mediated epigenetic activity of hcIE may be induced in differentiating TH2 cells by directly and/or indirectly protecting the Bcl6-mediated silencing, because Bcl6 binding was augmented in the absence of hcIE. Regarding the relationship with STAT5, Bcl6-binding DNA sequences resemble the IFN-γ–activated sequence motif bound by STAT proteins (10), suggesting that Bcl6 represses TH2 cytokine expression via competitive binding against STAT factors in TH2 cytokine gene loci (7), which results in a shift toward histone deacetylation. On the contrary, it is certain that Bcl6 reduces GATA3 binding based on data from the Bcl6-KO study. In TH2LPs, GATA3 and pSTAT5 levels decreased, whereas Bcl6 protein levels remained nearly unchanged throughout the long-term culture period. Accordingly, during the memory phase, hcIE activity may be suppressed by Bcl6. However, uncertainty largely remains regarding the Bcl6-mediated machinery for GATA3 binding without changes in its gene expression. Therefore, additional studies are required in the future. Bcl6 might function in a concentration-dependent manner; however, we believe that the suppressor activity does not simply depend on its levels, because we observed that cytokine production by TH2EPs derived from Bcl6-TG mice was not reduced compared with that in Bcl6-KO TH2EPs (Fig. S10). Dent et al. (37) also showed that Bcl6-KO TH1 cells have no ability to produce TH2 cytokines. Accordingly, we think that some activators (GATA3 and STATs) are essential for transcriptional processes in which the repressor activity of Bcl6 can be determined in functional balance with transcriptional activators, such as GATA3 and STATs. Therefore, in mTH2 cells, Bcl6 properly tunes Il4 chromatin modification by preventing exaggerated activation of the gene, because it is strongly suggested that hcIE regulates chromatin remodeling at the Il4 locus by Bcl6 through direct competition with STAT5 and/or through indirect functional competition with GATA3. We previously reported that Bcl6 binds to Il5BS (9), also revealing that Il13 was regulated by Bcl6, despite the apparent lack of Bcl6 binding to IL13BS. However, histone acetylation levels at Il13p and GATA3 binding to CGRE were influenced by Bcl6 in mTH2 cells. Regarding this result, Bcl6 might be involved in chromatin remodeling at the TH2LCR, which positively affects the coordinated expression (38) of Il4 and Il13. Accordingly, Bcl6 seems to negatively regulate these genes by directly regulating the function of TH2LCR, raising a query about the effects of hcIE on Il5 and Il13, because Bcl6 inhibitor treatment restored their expression levels in hcIE-KO TH2 cells. Although there is a possibility of cooperative repression by Bcl6 via binding to hcIE for TH2 cytokine gene foci, additional studies are required to investigate this obscure mechanism.
Fig. S10.
Regulatory role of Bcl6 in the differentiation of TH2 cells. TH2 cells were differentiated from naïve T cells from Bcl6-TG and WT DO11.10 mice, which express the clonotypic KJ-1-26 TG TCR specific for the OVA peptide. FACS analysis of IL-4– and IFN-γ–producing cells in KJ-1-26+ CD4 T cells restimulated with anti-CD3 Abs. The figure shows representative data for TH2EPs. All FACS data are representative of three independent experiments with similar results. The numbers in each corner represent the percentages of T cells in the column.
We investigated whether the function of Bcl6 is physiologically modified at the protein level in some pathological settings without gene manipulation, resulting in regulatory perturbation of TH2 cytokine genes. Because ERK-phosphorylated Bcl6 is degraded by the ubiquitin–proteasome system (28), we observed a decrement of Bcl6 protein expression in mTH2 cells in an IL-33–induced ERK-1/2 activation-dependent manner in vitro. As was observed in TH2 cytokine production by mTH2 cells, in which Bcl6 dissociated from target chromatin in the presence of IL-33, we hypothesized that the ERK signaling-mediated Bcl6 decrement might have a prominent role in cytokine gene regulation. Unfortunately, ERK inhibition did not reduce the IL-33–induced hyperproduction of TH2 cytokines, such as IL-4, indicating that mTH2 cell exposure to excess IL-33 reinforces permissive TH2 cytokine gene modification by both decreasing Bcl6 protein levels and inducing GATA3, a representative IL-33–induced activator. In contrast, IL-33 augments the production of IL-5 and IL-13, but not IL-4, in TH2EPs after TCR restimulation (19), supporting the hypothesis that, in highly polarized TH2 cells, intron 2 of the Il4 locus is completely opened by activated GATA3 before IL-33 exposure, which activates Il5 and Il13 but not Il4 by inducing GATA3 binding to the respective promoters. In addition to IL-33, IL-25 and TSLP are also known to induce TH2 cytokine production via the expression of some critical transcriptional activators, such as Gata3, in TH2 cells. Among the TH2-promoting cytokines, we observed a wider range of effective concentrations of IL-33 than IL-25 and TSLP for inducing IL-4 in ex vivo WT mTH2 cells. Because we observed that IL-33 exhibited a greater increase than IL-25 and TSLP in the OVA-LPS model, we expected IL-33 to play an important role in not only antagonizing Bcl6 function via protein degradation but also, inducing GATA3 for the activation of TH2 cytokine genes, particularly Il4, in mTH2 cells. Consistent with this finding, higher concentrations of IL-33 enhance the production of TH2 cytokines, such as IL-4, in both WT and Bcl6-KO mTH2 cells. These data imply that IL-33 at lower levels can function as an inducer by mainly suppressing Bcl6 via histone deacetylation; however, IL-33 at higher levels can function as a strong inducer via an additional function of activating GATA3. Conversely, in the presence of large amounts of Bcl6 (i.e., Bcl6-TG mTH2 cells), TCR restimulation-induced IL-4 production was lower in Bcl6-TG mTH2 cells; however, the inhibitory effect became moderate with increased IL-33 levels. Thus, Bcl6 could play an important role as an attenuator of hyperimmune response and inflammation against allergic pathology, whereas IL-33–induced functions could overcome Bcl6 activity in the highly severe pathology of asthma. In this pathology, IL-33 could induce robust inflammation with increases in IL-4 production and IgE serum levels, regardless of the presence of Bcl6 in the OVA-LPS model. These results indicate that Bcl6 functions as a repressor for the TH2 cytokine production in the OVA model, whereas in the OVA-LPS model, IL-33 did more for the cytokine production in mTH2 cells than alleviate BCL6-mediated suppression in a more severe allergy pathology. However, the possibility of there being other significant activating factors other than GATA3 for TH2 response induction remains.
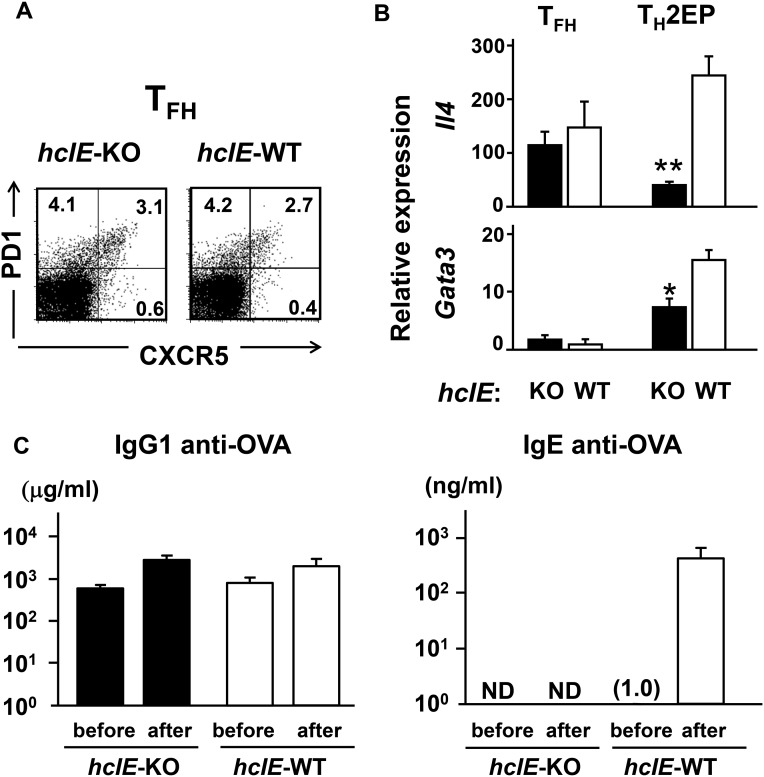
IL-4 should critically contribute to the development of allergic diseases, including asthma, because STAT6 phosphorylation in B cells is required for IgE class switching, depending on IL-4 in mice and either IL-4 or IL-13 in humans. In addition, Il4/Il13-KO mice exhibited completely abolished IgE production (39). Recently, IL-4–producing TFH cells with low-level Gata3 expression were shown to induce IgE class switch recombination (CSR) by direct Ig class switching in the germinal center (GC), resulting in short-lived plasma cells producing low-affinity IgE Ab (40). Thus, transfer TH2 cell-derived TFH cells might be involved in CSR to IgE. On the contrary, it has been reported that high-affinity memory IgG+ B cells derived from GC migrate to the outer follicle and differentiate into high-affinity IgE+ B cells via sequential Ig class switching with IL-4 (41). Furthermore, it has been suggested that IL-4 derived from TH2 cells, rather than TFH cells, is critical at the outer follicle for sequential class switching for memory allergic responses (39). When we examined OVA-specific Ab production in an allergic model (Fig. S11), hcIE-KO mice, in which TFH cells could produce sufficient IL-4 similarly to WT mice (Fig. S11 A and B), exhibited a normal memory response for IgG1 production after antigen challenge (Fig. S11C). By contrast, IgE production, the primary response of which was not detected, was strikingly impaired in hcIE-KO mice after challenge (Fig. S11C), supporting that IgE production is mainly conducted as a memory response depending on mTH2 cells but not TFH cells. In addition, because Bcl6 is a critical master regulator for TFH cell differentiation, it is unlikely that Bcl6-KO TH2 cells give rise to TFH cells that augment IgE production because of the impairment of TFH cell differentiation caused by deficiency of T cell-intrinsic Bcl6 (12–14).
Fig. S11.
Distinct roles of hcIE in TH2 cytokine production by TFH and TH2 cells. (A) Fraction of TFH (PD1+ CXCR5+) in spleens of hcIE-KO and WT mice 9 d after immunization with DNP-OVA was analyzed within the gated CD4+ T-cell population by flow cytometry. Data are presented as a representative of three independent experiments. The numbers in each corner represent the percentages of T cells in the quadrants. TFH- and TH2-committed cells were isolated from the spleens by FACS. (B) TFH cells isolated from spleens postimmunization and TH2EPs were stimulated with plate-bound anti-CD3 Abs for 8 h. Il4 and Gata3 mRNA expression in TFH cells was analyzed by qRT-PCR. Data are indicated as means ± SEMs from three independent experiments. *P < 0.05 vs. WT; **P < 0.01 vs. WT. (C) Normal memory IgG1 response but no IgE response in hcIE-KO mice. hcIE-KO and WT mice were hyperimmunized i.p. with OVA and alum three times and then, challenged intranasally with OVA for 7 consecutive days. Data are indicated as means ± SEMs from three mice. Titers of IgG1 and IgE anti-OVA Abs in sera from the immunized mice before the first intranasal challenge and after the last challenge were measured by ELISA. ND, not detected.
It is known that IL-33 induces innate cells to produce IL-4, leading to allergen-nonspecific IgE production and TH2 cell differentiation (22). However, the molecular mechanism by which IL-33 regulates cytokine production, in particular IL-4 production, by mTH2 cells remains unclear. Our TH2 cell transfer murine models showed that IL-33 is involved in the augmentation of IL-4 and antigen-specific IgE Ab levels by mTH2 cells. However, the use of Il33-KO recipients in the OVA-LPS model illustrated a partial effect of IL-33 on both Bcl6-KO and WT mTH2 cells in this severe asthma model. This result suggests that some unidentified mechanisms/factors, including IL-25 and TSLP, are also involved in the TH2-promoting function in vivo. However, we propose that functional competition for epigenetic regulation via a balance between activation induced by TH2-promoting factors, such as IL-33, and Bcl6-mediated suppression has enormous significance in the development of allergic diseases. Because some pathogenic bacteria contribute to the severity of asthma (42), the OVA-LPS model implies that the pathogenesis of chronic allergic diseases, particularly asthma and its exacerbation, is caused by the elevation of numerous risk factors, including IL-33 and IL-25. These factors may play an important role in conquering the protective function of Bcl6 against TH2-type allergic immune responses.
Concerning the role of Bcl6 in the regulation of cytokine gene expression, we discovered a function of Bcl6 that directly regulates Il4 and Il5 and indirectly regulates Il13 at the chromatin level. We considered that Bcl6 physiologically promotes appropriate TH2 cytokine production in mTH2 cells and that functional balance between Bcl6 and activators may critically direct Il4 activation in particular. Such a function of Bcl6 could be involved in protection against the development of allergic disease. Because the repressor activity of Bcl6 must be influenced by activators, including GATA3 and STAT5, even in the presence of excess Bcl6, activators overcoming the repressor can induce Il4 expression. Therefore, we propose a mechanism whereby the interaction between TH2-promoting factors and Bcl6 tunes TH2 cytokine gene activation and contributes to the pathology of severe allergic diseases, and therefore, dampening of Bcl6 may be involved in the maintenance and exacerbation of chronic allergic pathogenesis. Thus, TH2-promoting factors that suppress Bcl6 function may represent therapeutic targets for TH2 cell-mediated disease.
Materials and Methods
Abs and Reagents.
The Abs and reagents are described in SI Materials and Methods.
Mice.
Bcl6-KO (43) and Bcl6-TG mice with exogenous Bcl6 under the control of the Lck proximal promoter (44) have been described previously. These mice were backcrossed with BALB/c mice more than 10 times. DO11.10-TG mice were purchased from The Jackson Laboratory. Il33-KO mice (45) have been described previously. hcIE-KO mice were generated at the Biomedical Research Center, Chiba University (SI Materials and Methods). All mice were used at 8–12 wk of age. All procedures conformed to the Chiba University Resolution on the Use of Animals in Research, and they were approved by the Institutional Animal Care and Use Committee at Chiba University School of Medicine. Mice were maintained under specific pathogen-free conditions in the animal center of Chiba University Graduate School of Medicine.
Purification of CD4 T Cells and Induction of TH Cells.
Splenic naïve CD4 T cells and transferred T cells were isolated by a cell sorter (FACSVantage; BD Biosciences). Naïve T cells were stimulated for differentiation of TH1 and TH2 cells as previously described (11). Details of the experimental methods are described in SI Materials and Methods.
FACS Analysis of Intracellular Cytokines.
As previously described (11), TH cells were restimulated for 6 h and treated with monensin (2 μM) for the last 3 h. After intracellular cytokine staining, cells were subjected to flow cytometric analysis. Details of the experimental procedure are described in SI Materials and Methods.
ChIP Assay.
ChIP was performed as described previously (9). Details of the experimental procedure are described in SI Materials and Methods.
mRNA Measurements.
cDNA was synthesized from total RNA with the SuperScript III First-Strand Synthesis as described previously (9). System (Invitrogen) was used for quantitative real-time RT-PCR (qRT-PCR) analysis. A list of primer sets used is included in SI Materials and Methods.
ELISA.
The levels of IL-4 and IL-5 in culture supernatants or BALF were determined using a BD Cytometric Bead Array Kit (BD Biosciences). The levels of IL-13 and IL-33 in the samples were measured using ELISA kits (R&D Systems). Mouse IgE and IgG1 anti-OVA Abs were measured using assay kits (Chondrex). Specific absorbance was measured, and OD was quantified at 410 nM using a Multiskan JX Plate Reader (Thermo Lab System).
Western Blot Analysis.
In vitro-differentiated TH2 cells were subjected to the analysis. Details of the experimental procedure are described in SI Materials and Methods.
Analysis of Antigen-Induced Airway Inflammation.
Details of the examination are described in SI Materials and Methods.
Statistical Analysis.
Statistical significance was determined using Student’s t tests (two-tailed) for two groups or one-way ANOVA (with Tukey’s multiple comparisons tests) for three or more groups. P values <0.05 were considered significant.
SI Materials and Methods
Abs and Reagents.
The Abs and reagents used in the study were purchased from the following suppliers: rat allophycocyanin (APC)- and FITC-conjugated anti-CD4 mAb (GK1.5), rat APC-conjugated anti–IFN-γ mAb (XMG1.2), rat phycoerythrin (PE)-conjugated anti-CD44 mAb (IM7), mouse PE-conjugated and unconjugated anticlonotypic DO11.10 TCR mAb (KJ-1-26), rat PE-conjugated and unconjugated anti–IL-4 mAb (11B11), rat FITC-conjugated anti-CD62L mAb (MEL-14), mouse Alexa Fluor 647-conjugated anti-pSTAT5 mAb (46), PE-conjugated anti-PD1 mAb (J43), and APC-conjugated anti-CXCR5 mAb (2G8) from BD Biosciences; rat Alexa Fluor 647-conjugated anti–IL-13 mAb (eBio13A), rat peridinin chlorophyll protein complex (PerCP)-cyanine 5.5-conjugated anti-CD4 mAb (RM4-5), Armenian hamster unconjugated anti-CD3ε mAb (145-2C11), and rat PE-conjugated anti-GATA3 mAb (TWAJ) from eBioscience; rat FITC-conjugated anti-T1/ST2 mAb (DJ8) from MD Biosciences; mouse APC-conjugated and FITC-conjugated anti-human p75 nerve growth factor receptor mAb (ME20.4) from Cedarlane Laboratories; Armenian hamster unconjugated anti-CD28 mAb (PV-1) from Southern Biotech; mouse FITC-conjugated anticlonotypic DO11.10 TCR mAb (KJ-1-26) from CALTAG; mouse anti–β-tubulin mAb (E7) from Developmental Studies Hybridoma Bank; rabbit BCL6 mAb (D65C10), rabbit anti–phospho-p44/42 ERK-1/2 mAb (Thr202/Tyr204; D13.14.4E), rabbit anti-p44/42 ERK-1/2 mAb (137F5), and rabbit anti-pSTAT5 (Tyr694) mAb (D47E7) from Cell Signaling Technology; rabbit anti-pSTAT6 (Tyr641) polyclonal Ab from Abcam; rabbit anti-Bcl6 (N-3), anti-STAT5 (C-17), anti-STAT6 (N-20), anti-GATA3 (HG3-31), and normal rabbit IgG from Santa Cruz Biotechnology; and rabbit antiacetylated histone H3 polyclonal Ab (acetyl K9 and K14) from Upstate Biotechnology. The reagents used in this study were purchased from the following suppliers: recombinant mouse IL-2, IL-4, IL-7, IL-12, and IL-33 were obtained from PeproTech. The OVA peptide (Loh15: residues 323–339; ISQAVHAAHAEINEAGR) was synthesized by BEX Co. Ltd. The Bcl6 inhibitory peptide was synthesized by Scrum Inc. LPS (Escherichia coli O127:B8) was obtained from Sigma-Aldrich.
Gene Targeting and Generation of hcIE-KO Mice.
A targeting vector was used to delete a 445-bp (positions +1,067 to +1,511 relative to the transcription start site of Il4; Mouse Genome Informatics (MGI) accession no. 96556) region that included hcIE. Details of the procedures for gene targeting to generate hcIE-KO mice are subsequently described (Fig. S11). A 1.4-kbp PstI-digested fragment of the 5′-flanking region and an 8.8-kbp AccIII/SmaI fragment of the 3′-flanking region of a 16-kbp genomic clone that contained Il4, which had been isolated from a mouse BAC clone RP23-153C8 (Roswell Park Cancer Institute Mouse BAC Library; Invitrogen), were inserted into the XhoI and SalI sites, respectively, of pBS-DTA-loxP-neomycin selection cassette (neo)-loxP by blunt end ligation to generate the targeting vector. A 1.2-kbp XhoI/SalI fragment from the pMC1 neo cassette (Stratagene) was initially cloned between two flanked 34-bp loxP signal sequences in pBS246 (Life Technologies/Invitrogen), which had been modified by the insertion of polylinkers containing XhoI and SalI into the EcoRI and SpeI sites, respectively (pBS-loxP-neo-loxP). For negative selection of random integration events, a 1.75-kbp SalI/XhoI fragment from the pMC1 DTA cassette (Oriental Koubo) was inserted into the XhoI site of the pBS-loxP-neo-loxP (pBS-DTA-loxP-neo-loxP), which was used as a targeting vector. R1 ES cells were transfected with the linearized targeting vector via electroporation and subjected to positive selection with G418 for 14 d. Selected colonies were picked, replated individually, and subjected to genotype analysis by Southern blotting. Two independent targeted clones were used to generate chimeric mice via the aggregation method with slight modification. Tail DNA from agouti pups obtained from a mating with C57BL/6 mice was analyzed via Southern blotting. Heterozygous mutant mice were backcrossed with BALB/c mice for more than seven generations. To generate hcIE-KO mice without the neo cassette, heterozygous mutant mice were mated with CD4-cre TG mice (obtained from Christopher Wilson, University of Washington, Seattle, WA) (46) on the BALB/c background, and their offspring were sequentially intercrossed. Cre-mediated excision was confirmed by PCR of genomic DNA. To distinguish the WT (+/+; 508 bp), targeted (neo; 1,426 bp), and recombined (−/−; 127 bp) hcIE alleles, primers (forward, 5′-ACCTAACAGTCATCTGATGGTGGC-3′ and reverse, 5′-CTCATTCTGCATCAGACTCCTGGA-3′) were designed to amplify the 3′- and 5′-flanking regions of the targeted locus.
Purification of CD4 T Cells and Induction of TH Cells.
To isolate splenic naïve CD4 T cells (CD44lowCD62L+), we used a CD4+CD62L+ T-Cell Isolation Kit (Miltenyi Biotec) and a cell sorter (FACSVantage; BD Biosciences). Naïve T cells were stimulated to differentiate TH1 and TH2 cells as previously described. Sorted naïve CD4+ KJ-1-26+ T cells (2 × 10⁵ cells per 1 mL) on the DO11.10 background were stimulated with cognate OVA peptides (Loh15; 1 μg/mL) plus irradiated splenocytes (1 × 10⁶ cells per 1 mL) as antigen-presenting cells; the latter had been depleted of CD4 and CD8 T cells using streptavidin MACS Micro Beads (Miltenyi Biotec) in the presence of recombinant IL-2 (25 U/mL). In some experiments, splenic naïve CD4 T cells were stimulated with combined plate-bound anti-CD3 mAbs (10 µg/mL; 145-2C11) and soluble anti-CD28 mAbs (PV-1) in the presence of recombinant IL-2 (25 U/mL). TH1 or TH2 cells were generated from naïve CD4 T cells cultured with recombinant IL-12 (100 U/mL)/anti–IL-4 mAbs (5 μg/mL) or recombinant IL-4 (1,000 U/mL)/anti–IL-12 mAbs (10 μg/mL)/anti–IFN-γ mAbs (10 μg/mL) for 7 d, respectively. These TH1 or TH2 cells were further cultured with recombinant IL-7 (10 U/mL) for another 28 d. Seven days after this TH2-skewing culture, some effector TH2 cells (3 × 10⁷) on a DO11.10 background were injected i.v. into BALB/c, BALB/c nu/nu, or Il33-KO recipient mice followed by an analysis of mTH2 cells isolated as CD4+ KJ-1-26+ T cells from spleen or lung tissues. Some TH cells were restimulated in vitro or ex vivo with plate-bound anti-CD3 mAbs (2 µg/mL) after pretreatment with a Bcl6 inhibitor for 12 h, IL-33 for 3 h, or vehicle.
FACS Analysis of Intracellular Cytokines and Transcriptional Factors.
TH cells were restimulated for 6 h and treated with monensin (2 μM) for the last 3 h. DO11.10 mouse-derived TH2 cells were detected by staining with FITC-conjugated anti–KJ-1-26 and PerCP-conjugated anti-CD4 Abs. For intracellular cytokine staining, cells were washed once with FACS buffer [PBS with 3% (vol/vol) FCS and 0.1% sodium azide] and then, permeabilized with Perm2 (BD Biosciences) for 10 min at room temperature followed by two washes in FACS buffer. Finally, cells were stained in an appropriate combination of anti–IFN-γ–APC, anti–IL-4–PE, and anti–IL-13–Alexa Fluor 647 for 30 min at room temperature, washed, and resuspended in FACS buffer. Intracellular staining of transcription factors was performed using the FoxP3 fixation/permeabilization kit (eBioscience) according to the manufacturer’s recommendation as well as pSTAT5 and GATA3. All flow cytometric analyses were performed using an FACSCalibur with CellQuest software (BD Biosciences).
ChIP Assay.
The ChIP assay was performed as previously described. Before the assay, some TH cells were pretreated with a Bcl6 inhibitor for 12 h, IL-33 for 3 h, or vehicle. Protein and chromatin in TH cells were cross-linked by adding formaldehyde solution (Thermo Fisher Scientific), after which the cells were lysed in SDS lysis buffer. Subsequently, the precleared and sonicated chromatin and protein G agarose (Millipore) were incubated with specific Abs for the protein of interest or control IgG (rabbit). Some of the untreated chromatin was used as an input sample. Quantitative PCR (qPCR) was used to quantify the DNA region in the immune-precipitated chromatin and the input DNA. Relative ChIP DNA quantification was performed using the comparative Ct method. The cycle threshold (Ct) value of ChIP DNA was normalized to that of the input DNA: ΔCt[normalized ChIP] = Ct[ChIP] − Ct[input]. The normalized Ct values were adjusted to the normalized background Ct value: ΔΔCt[ChIP/IgG] = ΔCt[normalized ChIP] − ΔCt[normalized IgG]. ChIP fold enrichment above the sample-specific background was calculated as 2−ΔΔCt[ChIP/IgG]. The following primers were used for qPCR: Il5BS: 5′-TGGGCCTTACTTCTCCGTGTAACT-3′ (forward), 5′-CTCCAGTGACCCTGATACCTGAAT-3′ (reverse); R5BS: 5′-TCTGTTTCCCTGTGCAGTTCTCCT-3′ (forward), 5′-TATGGACTGAAAGGGAGGAGCCAA-3′ (reverse); R6BS: 5′-ATGACCTTAGTTGCCAGCTTTGCC-3′ (forward), 5′-TCTGCTGCAGCCAATATGAGTCGT-3′ (reverse); R7BS: 5′-TTGAAAGAAGTCTGGGAGTCTGGG-3′ (forward), 5′-GCTGCTACTGATGCAGCAGAAAGTCT-3′ (reverse); Il13BS: 5′-TTCTACTAGCTCGGGACTCTTCCA-3′ (forward), 5′-ATGGACATGACATGGGAAACCCAG-3′ (reverse); BS1: 5′-AGGTCCATGGAAGGGACAGATCA-3′ (forward), 5′-CGGATCCTTTCCTGGAATTGCTGA-3′ (reverse); BS2: 5′-TCCAATTGGTCTGATTTCACAGGA-3′ (forward), 5′-ACACCAGATTGTCAGTTATTCTGGGC-3′ (reverse); BS3: 5′-ACAGATGTGACAGGCTGATAGTGC-3′ (forward), 5′-GGCCTTTCATTCTCAGTGGTGTGT-3′ (reverse); BS4: 5′-CCTGGCTTCTGAGATGCAATGAGT-3′ (forward), 5′-GGGTAAGAGGAAAGCCAGCATGA-3′ (reverse); BS5: 5′-TTCAAGGATAAGCAAGTGGCAGGC-3′ (forward), 5′-ATTGGAACTAAGCCAGCCGATGGA-3′ (reverse); BS6: 5′-CGCCTCTCCTGTAAGG-TACACAAT-3′ (forward), 5′-TTGCCTTGCAACCATGAAGACCTG-3′ (reverse); BS7: 5′-CACTCACCAATTTGTCTGGAGGCT-3′ (forward) 5′-ATGGTGATCACAGTCCAAGTCCAG-3′ (reverse); G1: 5′-CCCTGAGTTTCAGGACTCGCCTTTAT-3′ (forward), 5′-TTCAGCAAAGGAAGAGCGCAGA-3′ (reverse); G2: 5′-ACCTAGTTCTTAGCCAGATGGGTGG-3′ (forward), 5′-TCAACCTAGGCAGGTAAGAGTCCT-3′ (reverse); G3: 5′-GCAGGGACACATGATCCTTACAGA-3′ (forward), 5′-ACAGAGACAGACAGGCAGAGAGAT-3′ (reverse); CGRE: 5′-ATCTCCCGTTACATAAGGCCGC-3′ (forward), 5′-CCCTCAAGACAAGCAGAAGGCAT-3′ (reverse); G4: the same primer pair as used for BS3; G5: 5′-GTGTCTACATATGTGTCTGTCTCTTTCTC-3′ (forward), 5′-GACTCAGTTTCTGGTAGGACTCAG-3′ (reverse); G6: 5′-TTGTGTGTGCATGTGTGTGGTGTG-3′ (forward), 5′-ACAAAGTGAGTTCCAGGACAGCCA-3′ (reverse); G7: 5′-TCAGCGAGAGCCATAACGGTGTTT-3′ (forward), 5′-TGTGTGGGAAAGTGATCGTGAGGA-3′ (reverse); Il5p: 5′-CCCTGAGTTTCAGGACTCGCCTTTAT-3′ (forward), 5′-TTCAGCAAAGGAAGAGCGCAGA-3′ (reverse); RAD50 promoter (p): 5′-AAGCAAACAGTGATAGGTGGCAGC-3′ (forward), 5′-AAGTGGGAGTCCTAAGCAACACGA-3′ (reverse); Il13p: 5′-ATGCCCACCGTGGAAATAAACCAC-3′ (forward), 5′-TGGCCGCTAAAGGAAAGAGTCTGA-3′ (reverse); Il4p: 5′-AGGTGTGCTCAAGGCAGACTTTCT-3′ (forward), 5′-TCTTATCAGCGTAGGGTTGCCACT-3′ (reverse); CNS1: 5′-GGCTTGCAACGAACTTTCCCAGAT-3′ (forward), 5′-TTCTGGGATTTCGAGTGGCTTCGT-3′ (reverse); and CNS2: 5′-TCGGCTGTAAAGTCCCAGTTGAGT-3′ (forward), 5′-AACACCGTTATGGCTCTCGCTGAA-3′ (reverse).
mRNA Quantification.
cDNA synthesized from total RNA with the SuperScript III First-Strand Synthesis System (Invitrogen) was used for qRT-PCR analysis. Real-time PCR was performed in 25-μL reaction volumes containing iQ SYBR-Green Supermix, 200 nM each primer, and 0.5 μL cDNA. The PCR cycle parameters were as follows: 3 min at 95 °C and 40 cycles of 30 s at 95 °C, 30 s at 60 °C, and 30 s at 72 °C followed by melting curve analysis. Relative quantification of cytokine mRNA expression was calculated using the comparative Ct method. The relative quantification value of the target in stimulated T cells normalized to an endogenous control β-actin gene and relative to a calibrator is expressed as 2−ΔΔCt (fold), where ΔCt = Ct of targeTgene − Ct of endogenous control gene (β-actin) and ΔΔCt = ΔCt of stimulated samples for targeTgene − ΔCt of the untreated control as a calibrator for the targeTgene. All data in T cells were expressed as arbitrary units relative to the expression level. The primers were as follows: β-actin: 5′-CCAGCCTTCCTTCTTGGGTAT-3′ (forward), 5′-TGGCATAGAGGTCTTTACGGATGT-3′ (reverse); Il4: 5′-TCTCGAATGTACCAGGAGCCATATC-3′ (forward), 5′-AGCACCTTGGAAGCCCTACAGA-3′ (reverse); Il5: 5′-CGATGAGGCTTCCTGTCCCTA-3′ (forward), 5′-TTGGAATAGCATTTCCACAGTACCC-3′ (reverse); Il13: 5′-CAATTGCAATGCCATCTACAGGAC-3′ (forward), 5′-CGAAACAGTTGCTTTGTGTAGCTGA-3′ (reverse); Gata3: 5′-AGAGATTTCAGATCTGGGCAATGG-3′ (forward), 5′-CAGGGACTGATTCACAGAGCATGTA-3′ (reverse); and T-bet: 5-AGGCTGCCTGCAGTGCTTCTA-3′ (forward), 5′-GGACACTCGTATCAACAGATGCGTA-3′ (reverse).
Western Blot Analysis.
In vitro-differentiated TH2 cells were lysed with lysis buffer [1% Nonidet P-40, 5% (vol/vol) glycerol, 50 mM Tris⋅HCl, pH 7.5, 100 mM NaCl, 10 μg/mL leupeptin, 0.1 mM PMSF, 1 mM DTT, 1 μg/mL pepstatin A, 10 mM Na3VO4, 10 mM NaF]. For immunoblotting, anti-Bcl6, anti–ERK-1/2, anti–pERK-1/2, or anti–β-tubulin Abs were used. Immunoreactive bands were visualized using a Phototope-HRP Western Blot Detection System (Cell Signaling Technology). For a quantitative analysis of Western blots, the intensities of individual bands were quantified using ImageJ software (NIH).
Analysis of Antigen-Induced Airway Inflammation.
OVA challenge.
After transfer, mice were challenged with a 1% chicken OVA (grade V; Sigma-Aldrich) solution or PBS (control mice) delivered with a nebulizer for 30 min. In some experiments, the mice were challenged simultaneously with OVA and LPS.
Bronchial alveolar lavage (BAL).
After mice were euthanized with pentobarbital sodium (Nembutal; Dai-Nippon Pharmaceuticals) 24 or 72 h after antigen challenge, BAL was immediately performed using six serial injections of PBS (0.5 mL) followed by fluid (BALF) aspiration. BALF was centrifuged, and the supernatant was stored at −80 °C. Each cell pellet was resuspended in PBS for cell counting and subjected to a cytospin. The preparations on slides were stained with Diff-Quick (Sysmex International Reagents) for a differential analysis of cell counts. After BAL, lungs were treated with collagenase II (1 mg/mL) for 30 min at 37 °C, and leukocytes were isolated on a Percoll gradient.
Histological examination.
After BAL, the left lobes of lungs were extracted, washed with PBS, and fixed in 4% (wt/vol) formaldehyde in sodium phosphate buffer for more than 2 d at room temperature. After fixation, lungs were embedded in paraffin, and H&E staining was performed. The images of each tissue section were captured using a Zeiss Axioscope 2 Microscope equipped with a video camera (AxioCam ERc5s; Carl Zeiss) and processed using Axiovision V.4 software (Carl Zeiss).
Immunization and Analysis for TFH Cells.
Mice were immunized i.p. with 100 μg DNP-OVA (Biosearch Technologies) and 650 μg alum (Pierce). Ten days after immunization, TFH cells (CD4+, CXCR5high, and PD1+) were sorted from spleens. These sorted cells and TH2EPs were stimulated with anti-CD3 Abs for 8 h to measure the levels of cytokine mRNA by qRT-PCR.
Immunization and Measurement of Antigen-Specific Abs.
To analyze IgE and IgG1 memory response, hyperimmunization was performed i.p. with 100 μg OVA and 4 mg alum once a week for 3 wk. From 1 wk after the last immunization, 500 μg OVA in 20 μL PBS was administered intranasally for 7 consecutive days. Immediately before the first OVA administration, serum was taken from the tail vein of all mice. Twenty-four hours after the last administration, all mice were euthanized, and serum was collected. Levels of serum IgG1 and IgE anti-OVA Abs were measured by ELISA.
Acknowledgments
We thank Dr. Christopher Wilson (University of Washington) for CD4-cre transgenic mice. This work is supported by grants-in-aid from the Ministry of Education, Science, Technology, Sports, and Culture of Japan and the Global Center for Education and Research in Immune System Regulation and Treatment.
Footnotes
The authors declare no conflict of interest.
This article is a PNAS Direct Submission.
This article contains supporting information online at www.pnas.org/lookup/suppl/doi:10.1073/pnas.1613528114/-/DCSupplemental.
References
- 1.Larché M, Robinson DS, Kay AB. The role of T lymphocytes in the pathogenesis of asthma. J Allergy Clin Immunol. 2003;111(3):450–463. doi: 10.1067/mai.2003.169. [DOI] [PubMed] [Google Scholar]
- 2.Hawrylowicz CM, O’Garra A. Potential role of interleukin-10-secreting regulatory T cells in allergy and asthma. Nat Rev Immunol. 2005;5(4):271–283. doi: 10.1038/nri1589. [DOI] [PubMed] [Google Scholar]
- 3.Ray A, Cohn L. Th2 cells and GATA-3 in asthma: New insights into the regulation of airway inflammation. J Clin Invest. 1999;104(8):985–993. doi: 10.1172/JCI8204. [DOI] [PMC free article] [PubMed] [Google Scholar]
- 4.Zheng W, Flavell RA. The transcription factor GATA-3 is necessary and sufficient for Th2 cytokine gene expression in CD4 T cells. Cell. 1997;89(4):587–596. doi: 10.1016/s0092-8674(00)80240-8. [DOI] [PubMed] [Google Scholar]
- 5.Finkelman FD, et al. Lymphokine control of in vivo immunoglobulin isotype selection. Annu Rev Immunol. 1990;8:303–333. doi: 10.1146/annurev.iy.08.040190.001511. [DOI] [PubMed] [Google Scholar]
- 6.Pepper M, Jenkins MK. Origins of CD4(+) effector and central memory T cells. Nat Immunol. 2011;12(6):467–471. doi: 10.1038/ni.2038. [DOI] [PMC free article] [PubMed] [Google Scholar]
- 7.Dent AL, Shaffer AL, Yu X, Allman D, Staudt LM. Control of inflammation, cytokine expression, and germinal center formation by BCL-6. Science. 1997;276(5312):589–592. doi: 10.1126/science.276.5312.589. [DOI] [PubMed] [Google Scholar]
- 8.Ye BH, et al. The BCL-6 proto-oncogene controls germinal-centre formation and Th2-type inflammation. Nat Genet. 1997;16(2):161–170. doi: 10.1038/ng0697-161. [DOI] [PubMed] [Google Scholar]
- 9.Arima M, et al. A putative silencer element in the IL-5 gene recognized by Bcl6. J Immunol. 2002;169(2):829–836. doi: 10.4049/jimmunol.169.2.829. [DOI] [PubMed] [Google Scholar]
- 10.Kawamata N, et al. Recognition DNA sequence of a novel putative transcription factor, BCL6. Biochem Biophys Res Commun. 1994;204(1):366–374. doi: 10.1006/bbrc.1994.2468. [DOI] [PubMed] [Google Scholar]
- 11.Ichii H, et al. Bcl6 is essential for the generation of long-term memory CD4+ T cells. Int Immunol. 2007;19(4):427–433. doi: 10.1093/intimm/dxm007. [DOI] [PubMed] [Google Scholar]
- 12.Nurieva RI, et al. Bcl6 mediates the development of T follicular helper cells. Science. 2009;325(5943):1001–1005. doi: 10.1126/science.1176676. [DOI] [PMC free article] [PubMed] [Google Scholar]
- 13.Johnston RJ, et al. Bcl6 and Blimp-1 are reciprocal and antagonistic regulators of T follicular helper cell differentiation. Science. 2009;325(5943):1006–1010. doi: 10.1126/science.1175870. [DOI] [PMC free article] [PubMed] [Google Scholar]
- 14.Yu D, et al. The transcriptional repressor Bcl-6 directs T follicular helper cell lineage commitment. Immunity. 2009;31(3):457–468. doi: 10.1016/j.immuni.2009.07.002. [DOI] [PubMed] [Google Scholar]
- 15.Hirata H, et al. Effects of Th2 pulmonary inflammation in mice with bleomycin-induced pulmonary fibrosis. Respirology. 2008;13(6):788–798. doi: 10.1111/j.1440-1843.2008.01361.x. [DOI] [PubMed] [Google Scholar]
- 16.Chackerian AA, et al. IL-1 receptor accessory protein and ST2 comprise the IL-33 receptor complex. J Immunol. 2007;179(4):2551–2555. doi: 10.4049/jimmunol.179.4.2551. [DOI] [PubMed] [Google Scholar]
- 17.Akdis M, et al. Interleukins, from 1 to 37, and interferon-γ: Receptors, functions, and roles in diseases. J Allergy Clin Immunol. 2011;127(3):701–21.e1, 70. doi: 10.1016/j.jaci.2010.11.050. [DOI] [PubMed] [Google Scholar]
- 18.Eiwegger T, Akdis CA. IL-33 links tissue cells, dendritic cells and Th2 cell development in a mouse model of asthma. Eur J Immunol. 2011;41(6):1535–1538. doi: 10.1002/eji.201141668. [DOI] [PubMed] [Google Scholar]
- 19.Schmitz J, et al. IL-33, an interleukin-1-like cytokine that signals via the IL-1 receptor-related protein ST2 and induces T helper type 2-associated cytokines. Immunity. 2005;23(5):479–490. doi: 10.1016/j.immuni.2005.09.015. [DOI] [PubMed] [Google Scholar]
- 20.Guo L, et al. IL-1 family members and STAT activators induce cytokine production by Th2, Th17, and Th1 cells. Proc Natl Acad Sci USA. 2009;106(32):13463–13468. doi: 10.1073/pnas.0906988106. [DOI] [PMC free article] [PubMed] [Google Scholar]
- 21.Kondo Y, et al. Administration of IL-33 induces airway hyperresponsiveness and goblet cell hyperplasia in the lungs in the absence of adaptive immune system. Int Immunol. 2008;20(6):791–800. doi: 10.1093/intimm/dxn037. [DOI] [PubMed] [Google Scholar]
- 22.Komai-Koma M, et al. Interleukin-33 amplifies IgE synthesis and triggers mast cell degranulation via interleukin-4 in naïve mice. Allergy. 2012;67(9):1118–1126. doi: 10.1111/j.1398-9995.2012.02859.x. [DOI] [PMC free article] [PubMed] [Google Scholar]
- 23.Kearley J, Buckland KF, Mathie SA, Lloyd CM. Resolution of allergic inflammation and airway hyperreactivity is dependent upon disruption of the T1/ST2-IL-33 pathway. Am J Respir Crit Care Med. 2009;179(9):772–781. doi: 10.1164/rccm.200805-666OC. [DOI] [PMC free article] [PubMed] [Google Scholar]
- 24.Agarwal S, Avni O, Rao A. Cell-type-restricted binding of the transcription factor NFAT to a distal IL-4 enhancer in vivo. Immunity. 2000;12(6):643–652. doi: 10.1016/s1074-7613(00)80215-0. [DOI] [PubMed] [Google Scholar]
- 25.Yamashita M, et al. Identification of a conserved GATA3 response element upstream proximal from the interleukin-13 gene locus. J Biol Chem. 2002;277(44):42399–42408. doi: 10.1074/jbc.M205876200. [DOI] [PubMed] [Google Scholar]
- 26.Tanaka S, et al. The enhancer HS2 critically regulates GATA-3-mediated Il4 transcription in T(H)2 cells. Nat Immunol. 2011;12(1):77–85. doi: 10.1038/ni.1966. [DOI] [PubMed] [Google Scholar]
- 27.Endo Y, et al. The interleukin-33-p38 kinase axis confers memory T helper 2 cell pathogenicity in the airway. Immunity. 2015;42(2):294–308. doi: 10.1016/j.immuni.2015.01.016. [DOI] [PubMed] [Google Scholar]
- 28.Niu H, Ye BH, Dalla-Favera R. Antigen receptor signaling induces MAP kinase-mediated phosphorylation and degradation of the BCL-6 transcription factor. Genes Dev. 1998;12(13):1953–1961. doi: 10.1101/gad.12.13.1953. [DOI] [PMC free article] [PubMed] [Google Scholar]
- 29.Ohori M, et al. Identification of a selective ERK inhibitor and structural determination of the inhibitor-ERK2 complex. Biochem Biophys Res Commun. 2005;336(1):357–363. doi: 10.1016/j.bbrc.2005.08.082. [DOI] [PubMed] [Google Scholar]
- 30.Zhao J, et al. F-box protein FBXL19-mediated ubiquitination and degradation of the receptor for IL-33 limits pulmonary inflammation. Nat Immunol. 2012;13(7):651–658. doi: 10.1038/ni.2341. [DOI] [PMC free article] [PubMed] [Google Scholar]
- 31.Messi M, et al. Memory and flexibility of cytokine gene expression as separable properties of human T(H)1 and T(H)2 lymphocytes. Nat Immunol. 2003;4(1):78–86. doi: 10.1038/ni872. [DOI] [PubMed] [Google Scholar]
- 32.Löhning M, et al. Long-lived virus-reactive memory T cells generated from purified cytokine-secreting T helper type 1 and type 2 effectors. J Exp Med. 2008;205(1):53–61. doi: 10.1084/jem.20071855. [DOI] [PMC free article] [PubMed] [Google Scholar]
- 33.Zhu J, et al. Conditional deletion of Gata3 shows its essential function in T(H)1-T(H)2 responses. Nat Immunol. 2004;5(11):1157–1165. doi: 10.1038/ni1128. [DOI] [PubMed] [Google Scholar]
- 34.Zhang DH, Yang L, Ray A. Differential responsiveness of the IL-5 and IL-4 genes to transcription factor GATA-3. J Immunol. 1998;161(8):3817–3821. [PubMed] [Google Scholar]
- 35.Lavenu-Bombled C, Trainor CD, Makeh I, Romeo PH, Max-Audit I. Interleukin-13 gene expression is regulated by GATA-3 in T cells: Role of a critical association of a GATA and two GATG motifs. J Biol Chem. 2002;277(21):18313–18321. doi: 10.1074/jbc.M110013200. [DOI] [PubMed] [Google Scholar]
- 36.Walters MC, et al. Transcriptional enhancers act in cis to suppress position-effect variegation. Genes Dev. 1996;10(2):185–195. doi: 10.1101/gad.10.2.185. [DOI] [PubMed] [Google Scholar]
- 37.Dent AL, Hu-Li J, Paul WE, Staudt LM. T helper type 2 inflammatory disease in the absence of interleukin 4 and transcription factor STAT6. Proc Natl Acad Sci USA. 1998;95(23):13823–13828. doi: 10.1073/pnas.95.23.13823. [DOI] [PMC free article] [PubMed] [Google Scholar]
- 38.Lee GR, Fields PE, Griffin TJ, Flavell RA. Regulation of the Th2 cytokine locus by a locus control region. Immunity. 2003;19(1):145–153. doi: 10.1016/s1074-7613(03)00179-1. [DOI] [PubMed] [Google Scholar]
- 39.Turqueti-Neves A, et al. The extracellular domains of IgG1 and T cell-derived IL-4/IL-13 are critical for the polyclonal memory IgE response in vivo. PLoS Biol. 2015;13(11):e1002290. doi: 10.1371/journal.pbio.1002290. [DOI] [PMC free article] [PubMed] [Google Scholar]
- 40.Yang Z, Sullivan BM, Allen CD. Fluorescent in vivo detection reveals that IgE(+) B cells are restrained by an intrinsic cell fate predisposition. Immunity. 2012;36(5):857–872. doi: 10.1016/j.immuni.2012.02.009. [DOI] [PubMed] [Google Scholar]
- 41.He JS, et al. The distinctive germinal center phase of IgE+ B lymphocytes limits their contribution to the classical memory response. J Exp Med. 2013;210(12):2755–2771. doi: 10.1084/jem.20131539. [DOI] [PMC free article] [PubMed] [Google Scholar]
- 42.Kloepfer KM, et al. Detection of pathogenic bacteria during rhinovirus infection is associated with increased respiratory symptoms and asthma exacerbations. J Allergy Clin Immunol. 2014;133(5):1301–1307. doi: 10.1016/j.jaci.2014.02.030. [DOI] [PMC free article] [PubMed] [Google Scholar]
- 43.Fukuda T, et al. Disruption of the Bcl6 gene results in an impaired germinal center formation. J Exp Med. 1997;186(3):439–448. doi: 10.1084/jem.186.3.439. [DOI] [PMC free article] [PubMed] [Google Scholar]
- 44.Ichii H, Sakamoto A, Kuroda Y, Tokuhisa T. Bcl6 acts as an amplifier for the generation and proliferative capacity of central memory CD8+ T cells. J Immunol. 2004;173(2):883–891. doi: 10.4049/jimmunol.173.2.883. [DOI] [PubMed] [Google Scholar]
- 45.Oboki K, et al. IL-33 is a crucial amplifier of innate rather than acquired immunity. Proc Natl Acad Sci USA. 2010;107(43):18581–18586. doi: 10.1073/pnas.1003059107. [DOI] [PMC free article] [PubMed] [Google Scholar]
- 46.Makar KW, et al. Active recruitment of DNA methyltransferases regulates interleukin 4 in thymocytes and T cells. Nat Immunol. 2003;4(12):1183–1190. doi: 10.1038/ni1004. [DOI] [PubMed] [Google Scholar]


