Significance
Programmed cell death protein ligand 1 (PD-L1)–expressing cells mediate tumor evasion from immune system by suppressing activated T lymphocytes. A bioactive lipid prostaglandin E2 (PGE2) formed from arachidonic acid by COXs and PGE2 synthases (PGESs) facilitates both cancer inflammation and immune suppression. Here, we show that tumor cells can induce PD-L1 expression in bone marrow–derived cells by affecting PGE2 metabolism in hematopoietic cells. The tumor-induced PD-L1 expression was limited to the myeloid cell lineage and, specifically, to the macrophages and myeloid-derived suppressor cells. Collectively, the obtained results demonstrate that selective inhibition of PGE2-forming enzymes COX2, murine PGES1, or genetic overexpression of PGE2-degrading enzyme 15-hydroxyprostaglandin dehydrogenase could provide a novel approach to regulate both PGE2 levels and PD-L1 expression in cancer, thus alleviating the immune suppression and stimulating antitumor immune response.
Keywords: PD-L1, tumor-associated macrophages, PGE2 metabolism, myeloid cells, bone marrow
Abstract
In recent years, it has been established that programmed cell death protein ligand 1 (PD-L1)–mediated inhibition of activated PD-1+ T lymphocytes plays a major role in tumor escape from immune system during cancer progression. Lately, the anti–PD-L1 and –PD-1 immune therapies have become an important tool for treatment of advanced human cancers, including bladder cancer. However, the underlying mechanisms of PD-L1 expression in cancer are not fully understood. We found that coculture of murine bone marrow cells with bladder tumor cells promoted strong expression of PD-L1 in bone marrow–derived myeloid cells. Tumor-induced expression of PD-L1 was limited to F4/80+ macrophages and Ly-6C+ myeloid-derived suppressor cells. These PD-L1–expressing cells were immunosuppressive and were capable of eliminating CD8 T cells in vitro. Tumor-infiltrating PD-L1+ cells isolated from tumor-bearing mice also exerted morphology of tumor-associated macrophages and expressed high levels of prostaglandin E2 (PGE2)-forming enzymes microsomal PGE2 synthase 1 (mPGES1) and COX2. Inhibition of PGE2 formation, using pharmacologic mPGES1 and COX2 inhibitors or genetic overexpression of PGE2-degrading enzyme 15-hydroxyprostaglandin dehydrogenase (15-PGDH), resulted in reduced PD-L1 expression. Together, our study demonstrates that the COX2/mPGES1/PGE2 pathway involved in the regulation of PD-L1 expression in tumor-infiltrating myeloid cells and, therefore, reprogramming of PGE2 metabolism in tumor microenvironment provides an opportunity to reduce immune suppression in tumor host.
In recent years, anti–PD-1/programmed cell death protein ligand 1 (PD-L1) therapy has taken center stage in immunotherapies for human cancer, particularly for solid tumors (1). Cancers with high rates of mutations, including Hodgkin’s lymphoma, unresectable or metastatic melanoma, renal cell carcinoma, non-small cell lung carcinoma, and metastatic urothelial bladder carcinoma, appear to be responsive to anti-PD-1 or anti–PD-L1 Ab therapies (2–6). Interestingly, most human or mouse tumor cell lines do not express PD-L1constitutively but, at the same time, most surgically removed tumors demonstrate high expression of PD-L1. This fact may suggest that PD-L1 can be induced in tumor vicinity via interaction with tumor-recruited inflammatory cells frequently presented in cancer tissues. Bladder cancer, in particularly, is characterized by the marked infiltration with immune and inflammatory cells such as macrophages and myeloid-derived suppressor cells (MDSCs) of bone marrow (BM) origin (6–9). Peripheral blood in cancer patients, including those with bladder cancer, also comprises high numbers of myeloid cells, indirectly indicating that tumors may recruit BM-derived cells to support tumor growth through multiple mechanisms including local immunosuppression in tumor site (10, 11). Taking into account these facts, we hypothesized that close contact of BM-derived myeloid cells with tumor cells could promote expression of immunosuppressive ligand PD-L1.
Results and Discussion
Tumor Cells Promote PD-L1 Expression in BM-Derived CD11b Myeloid Cells, Primarily in Macrophages and MDSCs.
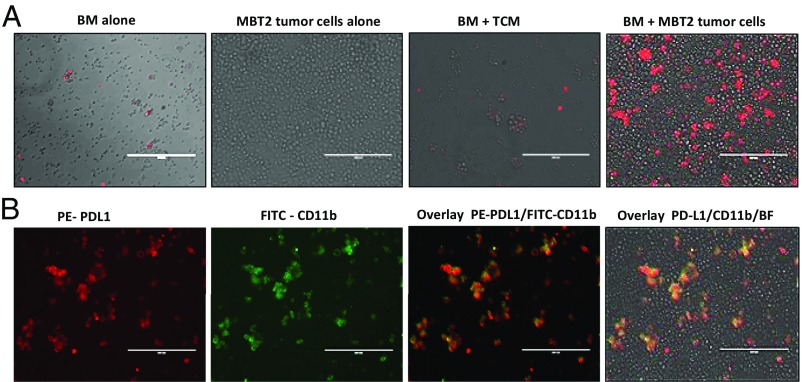
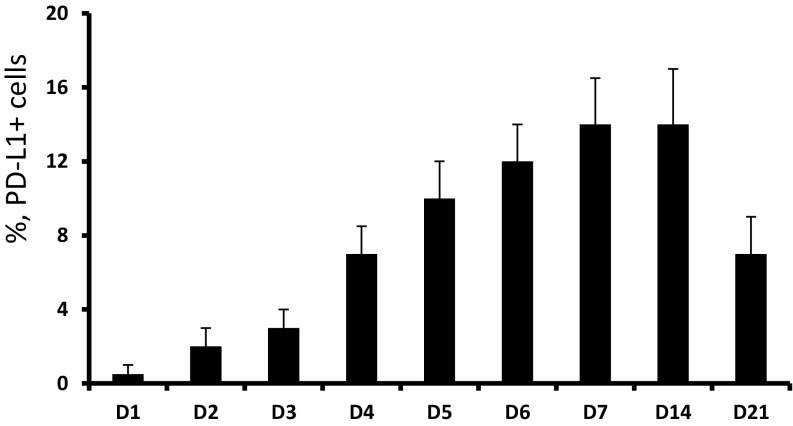
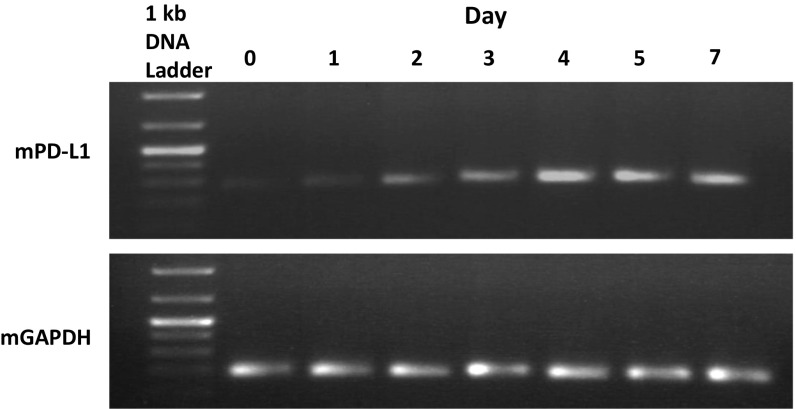
Here, we report that coculture of murine BM cells and a murine MBT-2 bladder tumor cell line resulted in strong up-regulation of PD-L1 expression. As can be seen in Fig. 1A, cultured alone tumor cells did not express PD-L1 on their cell surface, and BM cells cultured alone or in the presence of tumor-conditioned medium (TCM) demonstrated only weak PD-L1 expression. However, coculture of tumor cells with naïve BM cells markedly stimulated PD-L1 expression. Maximal levels of PD-L1 expression reached on day 7 after initiation of BM/tumor cells coculture and remained steady until day 14 (Fig. S1). The levels of PD-L1 mRNA peaked earlier, on days 4–5 (Fig. S2).
Fig. 1.
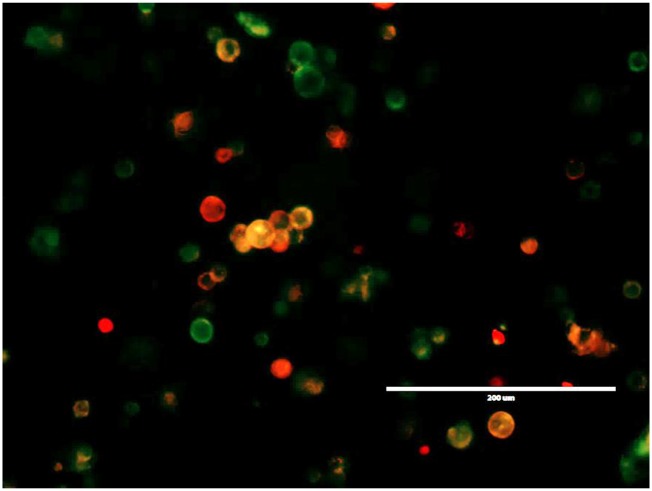
Coincubation of BM cells and tumor cells promotes up-regulation of PD-L1 expression in BM-derived myeloid cells. (A) Representative images demonstrating immunofluorescence staining of PD-L1 (red) in BM cultured alone, tumor cells alone, BM in the presence of TCM (30%), and coculture of BM and tumor cells (cell ratio 2:1). Cells were cultured in 24-well plates (6 × 10⁵ cells per well) for 5 d and then collected and stained with PE-conjugated anti–PD-L1 mAbs. (Scale bar: 200 µm.) BF, bright field. (B) PD-L1 expression in BM and tumor cell cocultures is limited to CD11b myeloid cells. Representative images demonstrating immunofluorescence staining of PD-L1 (red) and CD11b (green) in cocultures of BM and MBT-2 tumor cells. (Scale bar: 200 µm.) Similar results were obtained in three independent experiments.
Fig. S1.
Kinetics of PD-L1 expression in BM and tumor cell cocultures. Naïve BM cells (1 × 10⁵ cells per well) and MBT-2 tumor cells (3 × 10⁴ cells per well) were added to the 96-well flat-bottom plates and cultured in a CO2 incubator at 37 °C. Cells were collected in triplicates at the indicated point times, washed with PBS, and stained with PE-conjugated anti–PD-L1 mAbs. Expression of PD-L1 was measured using flow cytometry. Average means ± SD are shown (n = 3).
Fig. S2.
The levels of PD-L1 mRNA in cocultures of MBT-2 tumor and BM cells were determined by reverse transcriptase. Total RNA was extracted from 1 × 10⁶ cells using the RNeasy Mini Kit (Qiagen), following the standard protocol, and quantified spectrophotometrically using a MBA 2000 spectrophotometer (Perkin-Elmer).
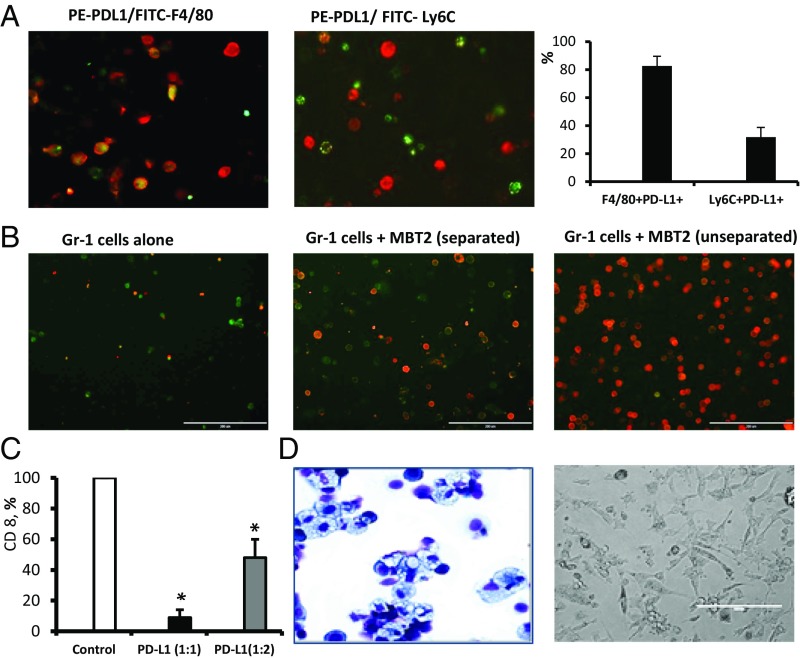
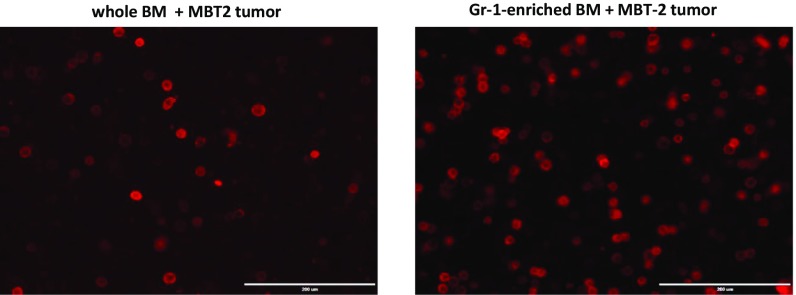
Costaining of mixed BM and tumor cells with fluorochrome-conjugated anti–PD-L1 and anti-CD11b mAbs revealed that expression of PD-L1 was limited to the BM-derived CD11b myeloid cells (Figs. 1B and 2A). To investigate the PD-L1–expressing cells further, we costained PD-L1+ cells with macrophage marker F4/80 or marker of myeloid-derived suppressor cells (MDSCs) (11) and/or inflammatory monocytes (12) Ly-6C (Fig. 2A). The obtained data clearly indicate that most PD-L1+ cells (82.5 ± 4.9%) in coculture coexpress F4/80, and some of PD-L1+ cells also can be found within Ly6C-expressing cells (31.7 ± 6.7%). Gr-1 (Ly6C+/Ly6G+) MDSCs were demonstrated earlier as precursors of tumor-associated macrophages (13). To study possible involvement of these cells in the tumor-induced of PD-L1 expression in BM-derived myeloid cells, we cocultured Gr-1–enriched BM cells or whole BM cells from naïve mice with syngeneic MBT-2 tumor cells. The obtained data demonstrate that Gr-1–enriched BM cells represent a superior source of PD-L1+ cells compared with the whole BM (Fig. S3).
Fig. 2.
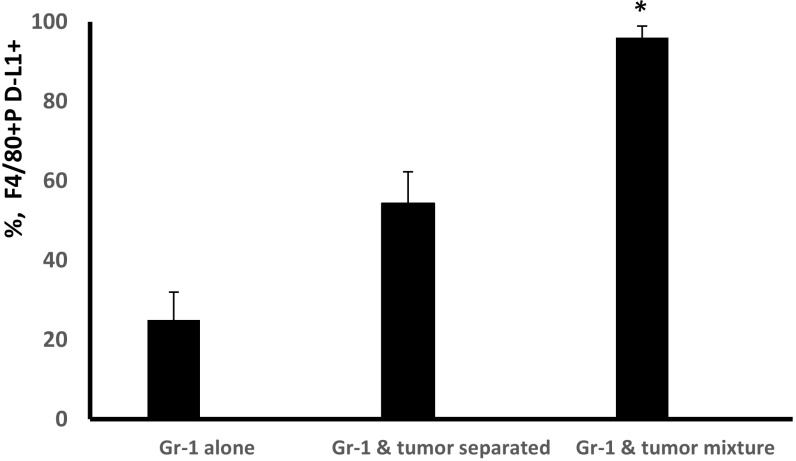
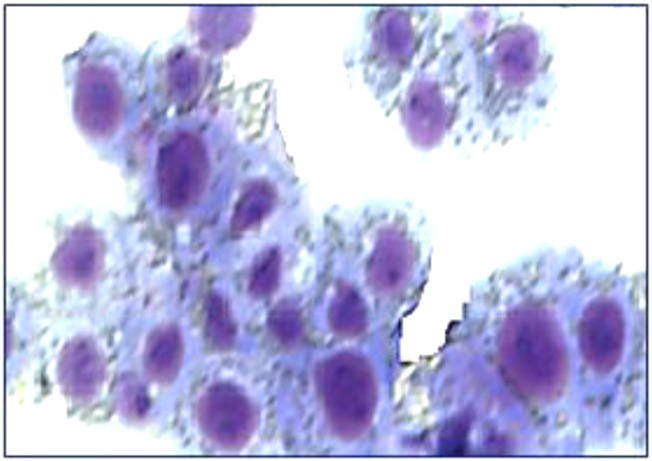
Characterization of PD-L1+ myeloid cells. (A) Cocultured murine BM and MBT-2 tumor cells were collected on day 5, stained with anti–PD-L1 (red), anti-F4/80 (green), or Ly6C (green) mAbs and then analyzed by fluorescent microscope. Representative images and a quantification graph are shown. (Scale bar: 50 µm.) (B) Cell–cell contact between BM-derived Gr-1+ cells and tumor cells stimulates differentiation of F4/80+PD-L1+ cells. Gr-1+ cells were enriched using magnetic beads (Miltenyi Biotec) from BM of naïve C3/He mice. Equal numbers of Gr-1+ cells were plated in 48-well plates (4 × 10⁵ cells per well) alone or mixed with MBT-2 tumor cells (1.5 × 10⁵ cells per/well). In some wells, Gr-1+ cells (bottom) were separated from tumor cells (insert) by 1-μM pore diameter membrane. On day 5, cells were collected and stained with PE–PD-L1 and Alexa 488-F4/80 Abs. The number of F4/80+PD-L1+ cells was counted using immunofluorescent imaging microscope. (C) PD-L1+ cells eliminate activated CD8 T lymphocytes. Purified PD-L1+ cells from BM and tumor cell cocultures were coincubated with naïve splenic T cells stimulated with CD3/CD28 Abs in 96-well plates in triplicates. Seventy-two hours later, the number of CD8 cells was enumerated using fluorescent imaging microscope. The number of cells in control (T cells only, no added PD-L1+ cells) was accounted for 100%. PD-L1+ and T cells were cocultured in cell ratios 1:1 and 1:2. Average means ± SD are shown (n = 3). *P < 0.05. The experiment was repeated twice. (D) Morphology of tumor-infiltrating PD-L1+ cells. Tumor-infiltrating PD-L1+ cells from MBT-2 tumors were purified using magnetic beads as described in Materials and Methods. The portion of purified PD-L1+ cells that we used for preparation of H&E-stained cytospin (D, Left); another portion of cells was cultured in complete culture medium for 72 h before microphotographs were taken (D, Right). Representative images of PD-L1+ cells are shown.
Fig. S3.
Coculture of Gr-1+ cell-enriched BM-derived myeloid cells with tumor cells produce more PD-L1+ cells than unseparated BM. Gr-1+ cells were enriched using magnetic beads (Miltenyi Biotec) from BM of naïve C3/He mice. Equal numbers of whole BM cells (after depletion of red blood cells) or Gr-1+ BM-derived cells (6 × 10⁵ cells per well) were mixed with MBT-2 tumor cells (3 × 10⁵ cells per well) 24-well plates. On day 5, cells were collected and stained with anti–PD-L1 PE-conjugated mAbs. PD-L1 expression was evaluated using an immunofluorescent imaging microscope.
We next investigated whether cell–cell contact could be important for tumor-induced PD-L1 expression in BM-derived myeloid cells. Data presented in Fig. 2B and Fig. S4 show that Gr-1–enriched BM cells produce highest levels of PD-L1 expression in F4/80+ macrophages when myeloid cells have full contact with tumor cells and not separated by the membrane.
Fig. S4.
Cell–cell contact between myeloid and tumor cells stimulates differentiation of F4/80+PD-L1+ macrophages. Gr-1+ cells were enriched using magnetic beads (Miltenyi Biotec) from BM of naïve C3/He mice. Equal numbers of Gr-1+ cells were plated in 48-well plates (4 × 10⁵ cells per well) alone or mixed with MBT-2 tumor cells (1.5 × 10⁵ cells per well). In some wells, Gr-1+ cells (bottom) were separated from tumor cells (insert) by 1-μM pore diameter membrane. On day 5, cells were collected and stained with PE–PD-L1 and Alexa 488-F4/80 Abs. The percentage of F4/80+PD-L1+ cells was evaluated using an immunofluorescent imaging microscope. Average means ± SD are shown. *P < 0.05.
PD-L1–Expressing Macrophages Are Immunosuppressive.
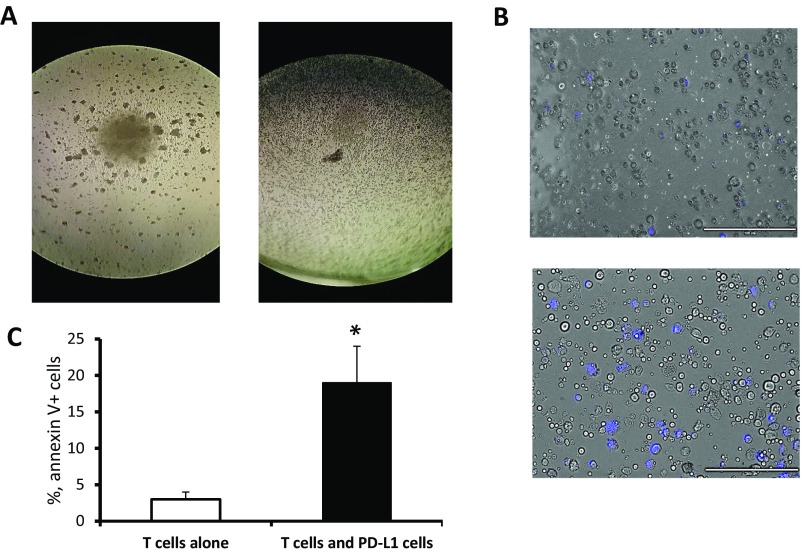
Previous studies showed that PD-L1 expression may mediate immune suppression by facilitating apoptosis of activated T cells (14). To test whether PD-L1–expressing BM-derived myeloid cells could also promote inhibition of T lymphocytes, we isolated PD-L1+ cells from cocultures of MBT-2 tumor cells and BM cells, and then coincubated those PD-L1–expressing cells with murine splenic T lymphocytes activated with CD3/CD28 Abs as previously described (13). Number of CD8 T lymphocyte in cocultures was evaluated using fluorescent microscopy. Data presented in Fig. 2C and Fig. S5 indicate that PD-L1–expressing BM-derived cells are able to reduce numbers of activated T lymphocytes through apoptosis suggesting the potential role of these immunosuppressive cells in tumor-induced immune suppression and tumor evasion from immune system.
Fig. S5.
Naive splenic T cells were stimulated with CD3/CD28 mAbs in 96-well cell culture plates alone or after adding PD-L1+ cells (1:1) isolated from BM and tumor cell cocultures. (A) Microphotographs were taken 36 h after stimulation. The left image shows clusters with control proliferating T cells, and the right image shows the absence of clusters in T-cell/PD-L1+ cell cocultures. (B) Annexin V-positive cells (blue) were detected using Alexa Fluor 350 Annexin V conjugate (Invitrogen) in T-cell/PD-L1 cell cocultures (Lower) and in control (Upper). (Scale bars: 200 µm.) (C) Apoptotic cells were enumerated using fluorescent imaging microscope. Average means ± SD are shown (n = 3). *P < 0.05.
Tumor-Infiltrating PD-L1+ Cells Demonstrate the Macrophage’s Nature and Up-Regulated Expression of the PGE2-Forming Enzymes COX2 and Murine PGE2 Synthase 1.
Because MBT-2 tumor cell line itself is negative for PD-L1 (Fig. 1A), we next investigated whether PD-L1 expression could appear in tumor tissues after injection of MBT-2 tumor cells in mice. After injection of MBT-2 tumor cells into syngeneic C3/He mice, developed tumors were surgically resected. Single-tumor cell suspensions were prepared by digestion of tumor tissue and stained with fluorochrome-conjugated anti–PD-L1 Abs. As expected, in contrast to the cultured alone tumor cell line, tumor tissues obtained from tumor-bearing animals were positive for PD-L1 (Fig. S6). To explore the nature of these PD-L1–expressing cells, the PD-L1+ cells were isolated from tumor tissue. Morphology of tumor-infiltrating PD-L1–expressing cells closely resembled the morphology of tumor-associated macrophages with highly vacuolized cytoplasm and typical macrophage appearance (Fig. 2D, Left, and Fig. S7). When PD-L1+ cells were placed in culture plastic plates (Fig. 2D, Right), these cells, unlike the PD-L1− tumor-enriched cell fraction, became highly adherent and acquired elongated shape characteristic for the cultured macrophages.
Fig. S6.
Representative image demonstrating immunofluorescence staining of PD-L1 (red) and CD11b (green) in an MBT-2 tumor cell suspension prepared from surgically resected tumor tissue. (Scale bars: 200 µm.) Similar results were obtained in three independent experiments.
Fig. S7.
F4/80+CD11b+CD45+ tumor-associated macrophages were sorted from MBT-2 tumors using FACS. Cytospins with purified macrophages were prepared using a Shandon cytospin centrifuge and stained with H&E. A representative image of F4/80+CD11b+CD45+ cells is shown.
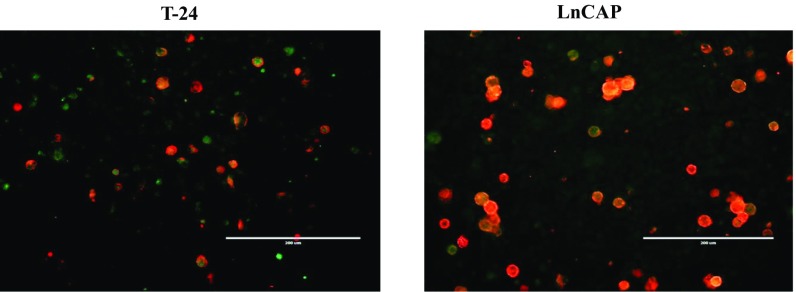
In contrast to PD-L1+ cells, their PD-L1− cell counterparts were mostly represented by tumor cells. Collectively, these results and the data obtained from experiments with cocultured BM and tumors illustrate that recruited myeloid cells of BM origin, such as tumor-associated macrophages (TAMs) and MDSCs, can up-regulate PD-L1 expression in tumor vicinity. Notably, similar up-regulation of PD-L1 expression in tumor-infiltrating myeloid cells was also observed using other tumor models such as T24 bladder and LnCAP prostate tumors grown in NSG mice (Fig. S8).
Fig. S8.
PD-L1 expression in T-24 bladder and LnCAP prostate xenograft tumor tissues. Tumor cells were injected subcutaneously into immunodeficient NSG mice. Established tumors were collected and single cell tumor suspensions were prepared by digestion using collagenase mixture. Expression of PD-L1 (red) and CD11b (green) markers in T-24 tumors and LnCaP tumors was examined using immunofluorescent imaging microscope. (Scale bars: 200 µm.)
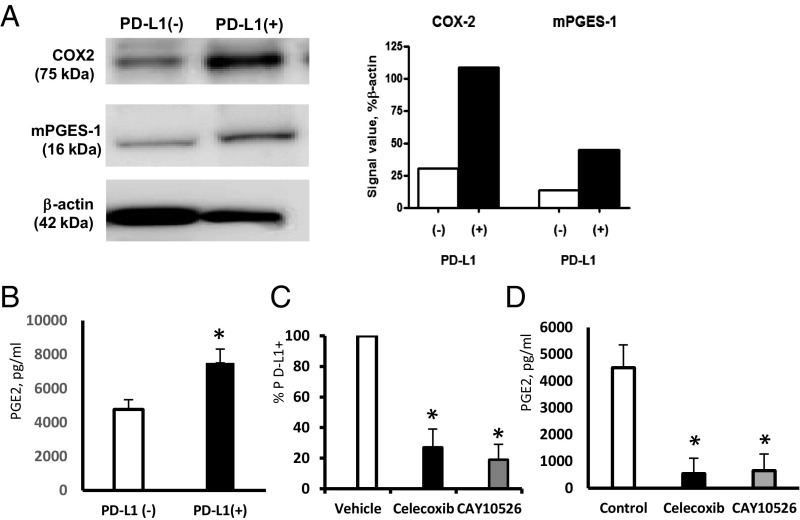
Next, we explored possible mechanisms underlying the tumor-induced PD-L1 expression in myeloid cells. It has been shown earlier that tumors frequently affect metabolism of arachidonic acid (AA) in myeloid cells which results in increased secretion of bioactive inflammatory and immunosuppressive AA lipid metabolites eicosanoids such as prostaglandins or leukotrienes (15–19). We hypothesized that aberrant lipid metabolism in TAMs and MDSCs could affect PD-L1 expression. To test this hypothesis, we first isolated PD-L1+ cells from MBT-2 tumors and measured prostaglandin E2 (PGE2) production by the PD-L1+ and PD-L1− cell fractions. The data presented in Fig. 3A demonstrate that PD-L1+ cells exhibited high levels of expression of PGE2-forming enzymes COX2 and microsomal PGE2 synthase 1 (mPGES1) and also (Fig. 3B) secreted substantial amounts of immunosuppressive lipid PGE2.
Fig. 3.
Pharmacologic PGE2 inhibitors reduce PD-L1 expression in the myeloid cells. (A) Comparative analysis of PGE2-forming enzymes COX2 and mPGES1 expression in PD-L1− and PD-L1+ tumor-infiltrating cells by Western blotting. Quantification of Western blot results was done using ImageJ software from NIH (A, Right). Similar results were obtained in three independent experiments. (B) PGE2 production by PD-L1+ cells. Tumor-infiltrating PD-L1+ and PD-L1− cell fractions from MBT-2 tumors were purified with magnetic beads. Equal numbers of PD-L1+ and PD-L1− cells were added to the 24-well plate and cultured for 7 d. Secreted PGE2 was measured by ELISA. Average means ± SD are shown (n = 3). *P < 0.05. (C) Quantification of the percentage of PD-L1+ cells in the BM and MBT-2 tumor cell cocultures treated by vehicle control or COX2 or mPGES1 inhibitors. Average means ± SD are shown (n = 3). P < 0.05. (D) PGE2 levels in cocultures of BM and tumor cells, treated by vehicle or COX2 or mPGES1 inhibitors, measured by ELISA. Average means ± SD are shown (n = 3). *P < 0.05.
Pharmacologic PGE2 Inhibitors Prevent Tumor-Mediated Induction of PD-L1 Expression.
To clarify whether PGE2 synthesis could regulate expression of PD-L1, we treated cocultures of BM and bladder tumor cells with pharmacologic inhibitors of PGE2-forming enzymes COX2 and mPGES1. Both inhibitors significantly reduced PGE2 production (Fig. 3D) as well as tumor-induced expression of PD-L1 in myeloid cells (Fig. 3C). Taken together, the obtained results demonstrate that tumor-infiltrating PD-L1+ myeloid cells express high levels of PGE2-forming enzymes COX2 and mPEGS1 and, subsequently, secrete substantial levels of PGE2. Moreover, inhibition of PGE2 formation using pharmacologic inhibitors markedly attenuated the tumor-induced PD-L1 expression.
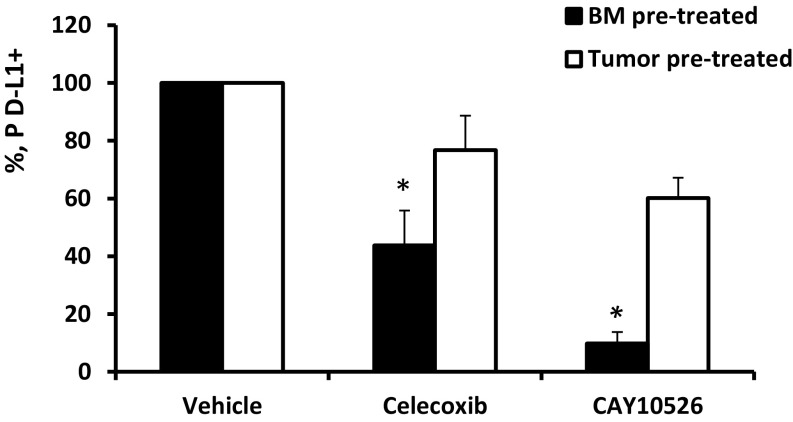
Because both BM-derived myeloid cells and tumor cells secrete PGE2, it was of interest to determine an individual contribution of myeloid and tumor cells to the mechanism of PGE2-dependent induction of PD-L1 expression. To this end, naïve murine BM cells and murine bladder tumor MBT-2 cells were separately pretreated or with pharmacologic PGE2 inhibitors and then cocultured for 5 d before the measurement of PD-L1 expression. The obtained results demonstrated (Fig. S9) that only coculture of pretreated BM cells with untreated tumor cells, but not coculture of naïve untreated BM cells with pretreated tumor cells, prevented the up-regulation of PD-L1 in BM-tumor cells cocultures. These data suggest that expression of PD-L1 expression is regulated through enhanced metabolism of PGE2 in the BM-derived myeloid cells but not in tumor cells. Nevertheless, tumor cells presumably are also involved in up-regulation of PD-L1 expression in macrophages through direct cell–cell contact (Figs. 1 and 2), leading to deregulated PGE2 metabolism in the myeloid cells and stimulating its enhanced PGE2 secretion.
Fig. S9.
Pretreatment of BM cells with mPGES1 inhibitor (filled bars), but not with MBT-2 tumor cells (open bars), prevents the up-regulation of PD-L1 expression in the myeloid cells cocultured with tumor cells. Naïve murine BM cells and murine bladder tumor MBT-2 cells were separately pretreated with the COX2 inhibitor celecoxib, the mPGES1 inhibitor CAY10526, or vehicle control (DMSO). Collected cells were washed with sterile PBS and then cocultured for 5 d before the measurement of PD-L1 expression. Average means ± SD are shown (n = 3). *P < 0.05.
Genetic Overexpression of the PGE2-Degrading Enzyme 15- Hydroxyprostaglandin Dehydrogenase Reduces PD-L1 Expression.
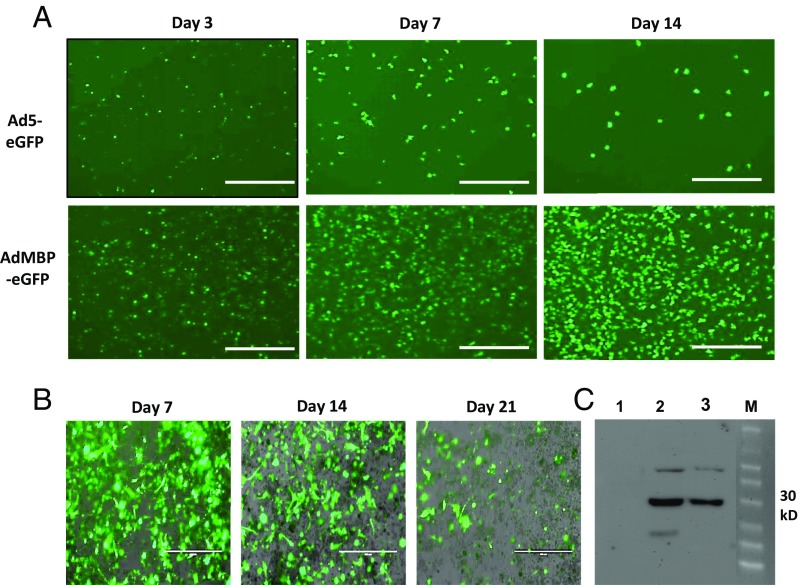
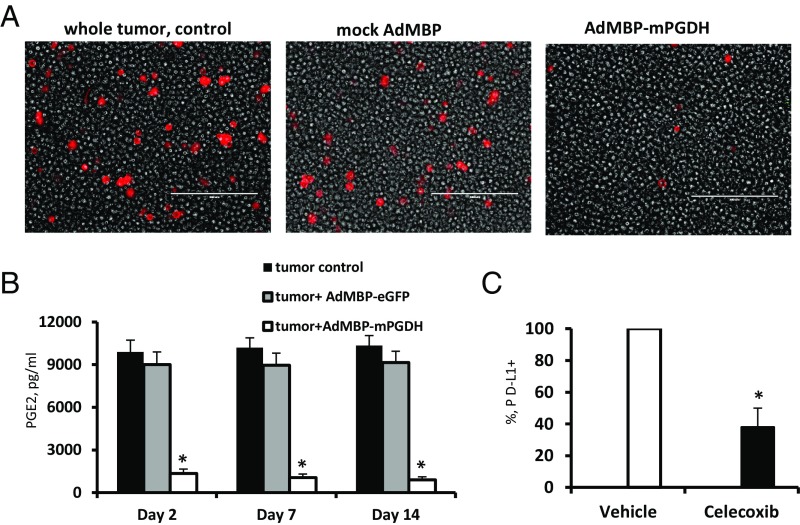
It is well established that PGE2 levels are regulated not only by its synthesis but also by its degradation (20). The key enzyme responsible for the biological inactivation of already formed prostaglandins is NAD+-linked 15-hydroxyprostaglandin dehydrogenase (15-PGDH). By inactivating endogenous PGE2, this enzyme provides a natural way of reducing the level of this lipid mediator. According to previous publications, expression of PGE2-forming enzyme COX2 in bladder cancer is frequently up-regulated (21), whereas expression of PGE2-degrading enzyme 15-PGDH is reduced (22). Moreover, earlier we demonstrated that the tumor-infiltrating myeloid cells also characterized by low 15-PGDH expression (23). Thus, it is plausible that high COX2 and low 15-PGDH expression promotes increased accumulation of PGE2 in tumor tissue leading to increased expression of PD-L1 observed in in patients with advanced bladder cancer (6). To investigate whether genetic restoration of 15-PGDH expression would be sufficient to prevent a tumor-induced up-regulation of PD-L1, we used a AdMBP adenoviral vector (24−25). Unlike original parent Ad5 adenovirus, AdMBP vector efficiently transduces primary myeloid cells (Fig. 4A and Fig. S10A) and provides continuous transgene expression in transduced cells lasting up to 21 d (Fig. 4B). Taking in account high transduction efficiency of this vector, we generated AdMBP–mPGDH vector that encodes the murine 15-PGDH gene (Fig. 4C). To examine effect of AdMBP-mediated delivery of 15-PGDH gene on PD-L1 expression, the whole MBT-2 tumor cell suspensions obtained from surgically resected tumors were ex vivo transduced with AdMBP–mPGDH or control AdMBP vectors. Data presented in Fig. 5A demonstrate that adenoviral-mediated expression of PGE2-degrading enzyme 15-PGDH results in substantial reduction of both PGE2 production and PD-L1 expression (Fig. 5B and Fig. S10B).
Fig. 4.
Adenovirus-mediated overexpression of 15-PGDH in myeloid cells. (A) Modified AdMBP–eGFP adenoviral vector demonstrates superior transduction efficiency of murine BM myeloid cells over parental nonmodified Ad5 adenoviral vector. Representative images demonstrating AdMBP-mediated eGFP expression in transduced cells are shown. CD11b myeloid cells were isolated from murine BM mice using anti-CD11b magnetic beads. Cells were seeded in 96-well plates with complete Roswell Park Memorial Institute (RPMI) medium 1640 supplemented with FBS, antibiotics, and M-CSF. Cells were infected with 5 × 10³ viral particles (vp) per cell AdMBP–eGFP or control nonmodified Ad5–eGFP. eGFP expression was evaluated at days 3, 7, and 14 postinfection using fluorescent microscopy. (Scale bar: 400 µm.) Similar results were obtained in two independent experiments. (B) AdMBP-mediated transduction of tumor cell suspension provides continuous expression of transgene. MBT-2 tumors were grown in mice and then surgically removed. Tumor tissue was digested with collagenase mixture and single tumor cell suspension infected ex vivo with AdMBP–eGFP. Transgene expression was examined on days 7, 14, and 21 using fluorescent microscope; representative images are provided. (Scale bars: 200 µm.) (C) Adenovirus-mediated expression of mouse15-PGDH protein. A549 cells were collected at 48 h after infection with 3 × 10³ vp per cell AdMBP–eGFP (1), Ad5–mPGDH (2), or AdMBP–mPGDH (3) vectors. The protein concentration in the cell lysates were determined by the Biuret method using the BCA Protein Assay Kit (Pierce). Equal amounts of protein were loaded for each sample and separated on SDS/PAGE, followed by transfer to a PVDF membrane (Millipore); 15-PGDH protein (predicted protein molecular mass: ∼31 kDa) expression was detected using anti–15-PGDH rabbit polyclonal Ab (Novus Biological) and then processed with ECL Plus Western Blotting Detection System (Amersham Biosciences).
Fig. S10.
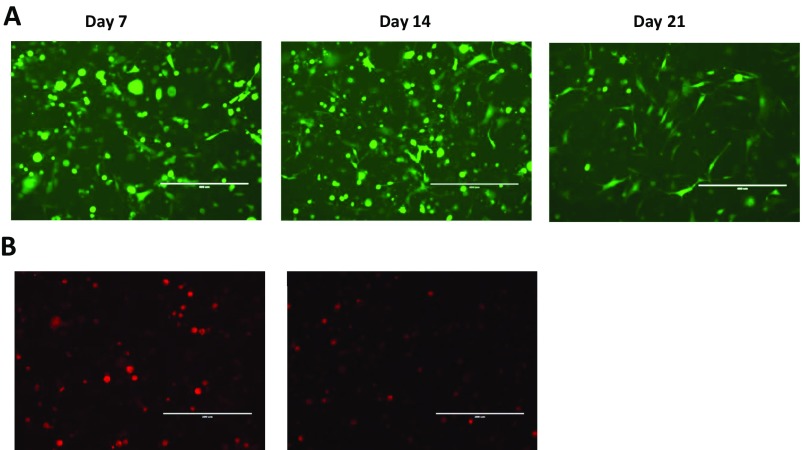
(A) Representative images demonstrating eGFP expression in tumor-infiltrating CD11b myeloid cells isolated from MBT-2 tumors. Tumor-infiltrating CD11b cells were purified from an MBT-2 tumor with anti-CD11b magnetic beads and then infected with AdMBP–eGFP (∼5 × 10³ multiplicities of infection per cell). Infected cells were cultured in complete RPMI 1640 medium in 24-well plates (5 × 10⁵ per well) for 21 d. (Scale bars: 200 µm.) (B) Representative images demonstrating PD-L1 expression in MBT-2 tumors after in vivo administration of PGE2 inhibitor (Right) or vehicle control (Left).
Fig. 5.
Restoration of 15-PGDH expression prevents the tumor-induced PD-L1 expression. (A) AdMBP vector encoding murine 15-PGDH reduces PD-L1 expression in tumor cell suspension prepared from surgically resected MBT-2 murine bladder tumors. Representative images demonstrating overlay of PD-L1 expression (red) and bright field in control tumor suspension, tumor suspensions transduced with mock adenoviral vector, or those transduced with vector encoding murine 15-PGDH. Images taken on day 7 postinfection. (Scale bar: 200 µm.) (B) Forced ex vivo expression of 15-PGDH gene in tumor cell suspension with AdMBP–mPGDH vector results in diminished PGE2 secretion. PGE2 concentration was measured in cell-free supernatants using an ELISA kit. Average means ± SD are shown (n = 4). *P < 0.05. (C) In vivo administration of PGE2 inhibitor in bladder tumor-bearing mice decreases PD-L1 expression in tumor tissue. Mice with palpable MBT-2 tumors were treated with the COX2 inhibitor celecoxib or vehicle control for 3 d as described in Materials and Methods. Twenty-four hours after the last injection, tumors were collected and expression of PD-L1 in tumor tissues was measured using fluorescent imaging microscope. Average means ± SD are shown (n = 4). *P < 0.05.
We next examined whether in vivo administration of commercially available pharmacologic PGE2 inhibitor such as celecoxib could influence the PD-L1 expression in mice with established bladder tumors. Mice with established MBT-2 tumors received daily intraperitoneal injections of celecoxib or vehicle control for 3 d. Twenty four hours after last injection tumors were collected and expression of PD-L1 was evaluated in tumor tissues. The obtained results (Fig. 5C) indicate that in vivo inhibition of PGE2 significantly reduces the PD-L1 expression in tumor tissues. Thus, both in vitro and in vivo studies confirmed that metabolism of PGE2 regulates PD-L1 expression.
The tumor-promoting role of PGE2 in cancer has been demonstrated through multiple mechanisms, including cancer inflammation, tumor-associated immune suppression, tumor angiogenesis, and proliferation/renewal of cancer stem cells (15, 26–28). Of note, it is technically challenging to delineate the individual contribution of cancer cells, inflammatory macrophages, and stromal cells to the enhanced PGE2 production in cancer because all of those cells in the tumor bed interact with each other and can promote induction of COX2/mPGES1 expression through various mechanisms. Our in vitro coculture experiments revealed that tumor cells can induce the PD-L1 expression in BM-derived myeloid cells through cell–cell contact mechanism and in PGE2-depending manner. Further experiments showed that tumor-infiltrating PD-L1+ cells expressed the highest levels of PGE2-forming enzymes COX2 and mPGES1 and produced highest levels of PGE2. PGE2 inhibition resulted in strong down-regulation of PD-L1 expression. Collectively, the obtained results suggest that bladder tumor cells affect PGE2 metabolism in BM-derived myeloid cells driving their differentiation toward PD-L1+ macrophages. Recently published studies suggest that COX2/PGE2 signaling is also important for the proliferation and renewal of bladder stem cancer cells (28). Macrophage-derived PGE2 also promotes tumor cell dissemination, that is, spreading of metastatic malignant cell from parental tumor (29). Therefore, harnessing PGE2 metabolism in the tumor-infiltrating myeloid cells, including tumor-associated macrophages and their predecessors MDSCs, could potentially exert the multipronged cancer therapeutic effects by (i) stimulating anti-tumor response through PD-L1 down-regulation and preserving function of immune T cells, (ii) attenuating renewal of cancer stem cells, and (iii) inhibiting metastatic cancer cell spreading. In addition, improved APC differentiation and reduction of MDSCs in tumor host is also expected.
Generally, inhibition of PGE2 can be achieved in patients using COX2 inhibitors such as celecoxib. However, chronic inhibition of COX2 results in undesirable cardiovascular and gastrointestinal side effects that are due, in part, to reduced levels of prostacyclin PGI2 and thromboxane A2 (30, 31). Thus, based on the obtained results, it is reasonable to suggest that selective targeting PGE2-forming enzyme mPGES1 or targeted genetic overexpression of PGE2-degrading enzyme 15-PGDH could provide more effective and safe way to combat cancer. In summary, our results strongly imply that COX2/mPGES1/PGE2 signaling regulates PD-L1 expression in the tumor-infiltrating myeloid cells of BM origin such as TAMs and MDSCs. Increased expression of PD-L1 in tumor-recruited myeloid cell serves as a mechanism for tumor escape from immune system, and therefore, targeting PGE2 metabolism could help to reduce the PD-L1–mediated immune suppression.
Materials and Methods
Mice and Tumor Models.
All experiments with mice were performed according to protocol approved by the Institutional Animal Care and Use Committee of the University of Florida. Female 6- to 8-wk-old C3/He and NSG mice were obtained from The Jackson Laboratory. The MBT-2 murine bladder carcinoma, human bladder T24, and prostate DU-145 cancer cell lines were purchased from the American Type Culture Collection. Tumor cells were maintained at 37 °C in a 5% CO2 humidified atmosphere in complete culture media. To establish subcutaneous tumors, mice were injected with 1 × 10⁶ MBT-2 tumor cells into the left flank of C3/He mice or 3 × 10⁶ human cancer cells into the left flank immunodeficient NSG mice. Once tumors reached 1–1.5 cm in diameter, tumor-bearing mice were euthanized in a CO2 chamber and tumor cell suspensions were prepared from solid tumors by enzymatic digestion as described in SI Materials and Methods.
Isolation of Tumor-Infiltrating PD-L1+ Cells.
To obtain single-cell tumor suspensions, collected tumor tissues were disaggregated with collagenase mixture as described before (22). For isolation of PD-L1+ cells, we lysed red blood cells with ACK buffer and labeled cells with biotin-conjugated anti–PD-L1 Ab (Biolegend). Positive selection of PD-L1+ cells was conducted using anti-biotin magnetic beads and MACS columns (Miltenyi Biotec). The viability of isolated cells routinely exceeded 90%, as determined by the expression of 7-AAD using flow cytometry and trypan blue exclusion assays.
Immunosuppression Assay.
To induce PD-L1 expression in myeloid cells, red blood cell-free BM cells from C3/He mice were cocultured with syngeneic MBT-2 bladder tumor cells in 6-well plates (cell ratio, 5:1) for 7 d. PD-L1+ cells were isolated from mixture using anti–PD-L1 magnetic beads. Purified PD-L1+cells were coincubated with splenic CD3+ T cells (cell ratio, 1:1 and 0.5:1) in 96-well plates in the presence of anti-CD3 (1 µg/mL) and anti-CD28 (5 µg/mL monoclonal) mAbs (Biolegend), as described previously (12). Seventy-two hours later, cells were collected and labeled with PE-conjugated anti-CD8 mAbs (Biolegend). The number of CD8 cells was enumerated using a fluorescent imaging system. Further experimental details can be found in SI Materials and Methods.
SI Materials and Methods
Reagents and Culture Medium.
The COX2 inhibitor celecoxib and mPGES1 inhibitor CAY10526, as well as anti-COX2 and anti-mPGES1 Abs for Western Blotting, were obtained from Cayman Chemical. In vitro experiments were conducted using RPMI medium 1640 supplemented with 5% (vol/vol) FBS, 20 mM Hepes, 200 U/mL penicillin, and 50 μg/mL streptomycin (all from HyClone).
Immunofluorescent Microscopy and Flow Cytometry.
Immunofluorescent staining and flow cytometric analysis of PD-L1 expression was performed as follows. To block Fc receptors, 106 cells were incubated for 15 min at 4 °C with anti-CD16/CD32 mAbs. Cells were then incubated for 30 min on ice in 50 µL of PBS with 1 µg of relevant fluorochrome-conjugated or matched isotype control Abs. The expression of PD-L1 and myeloid cell lineage markers was assessed using the fluorochrome-conjugated mAbs from Biolegend. Cytometry data were acquired with a FACS Calibur flow cytometer (BD Biosciences) and analyzed with CXP software (Beckman Coulter). Results were expressed as the percentage of positive cells and mean fluorescence intensity. Immunofluorescence was evaluated using an EVOS FL fluorescent imaging microscope (Life Technology).
Morphological Characterization of Tumor-Infiltrating PD-L1+ Cells.
Freshly isolated PD-L1+ cells were spun on slides using Shandon cytospin centrifuge and stained with a Hema3 Stain Pack kit (Fisher Scientific). In addition, tumor-infiltrating PD-L1+ and PD-L1− cell fractions from MBT-2 tumors were purified with magnetic beads and cultured in complete medium for 72 h before microphotographs were taken.
Generation of AdMBP–mPGDH Virus.
Replication incompetent Ad vectors were created using a two-plasmid rescue method. To create Ad5–mPGDH virus the plasmids encoded expression cassettes comprised of the human cytomegalovirus major immediate–early enhancer/promoter (CMV) coupled to the mouse 15-PGDH transgene (mPGDH), followed by the bovine growth hormone polyadenylation signal. These expression cassettes were cloned into a shuttle plasmid (Qbiogene) and confirmed by using restriction enzyme mapping and partial sequence analysis. The shuttle plasmids were linearized with PmeI and integrated into the Ad5 genome by homologous recombination with pAdEasyH5/H3 plasmid in the Escherichia coli strain BJ5183. The recombinant viral genomes were then transfected into HEK293 cells using SuperFect Transfection Reagent (Qiagen), where they were packaged into virus particles. To generate fiber-modified AdMBP–mPGDH vector, the chimeric fiber–fibritin protein contained the N-terminal Ad5 fiber tail region fused to the trimerizing foldon domain of fibritin of bacteriophage T4 following by GGGGS peptide linker connected to the WTLDRGY peptide (MBP) as described previously (24). The insert sequences were confirmed by partial sequencing analysis. The recombinant viral genomes with fiber–fibritin–MBP were linearized with PacI and then transfected into 293F28 cells stably expressing the native Ad5 fiber cells. After additional round of amplification on 293F28 cells, the viruses were amplified in HEK293 cells and purified twice by CsCl gradient centrifugation. The concentration of vp was determined by measuring absorbance of the dissociated virus at A260 nm. To identify Ad-mediated m15-PGDH protein expression, A549 lung cancer cells were infected with Ad5–mPGDH or AdMBP–mPGDH. The infected cells were collected at 48 h after infection, and then protein expression was analyzed by SDS/PAGE, followed by immunoblotting analysis.
RNA Preparation and RT-PCR.
The levels of PD-L1 mRNA were determined by RT-PCR. Total RNA was extracted from 1 × 10⁶ cells using RNeasy Mini Kit (Qiagen), following the standard protocol, and quantified spectrophotometrically using a MBA 2000 spectrophotometer (Perkin-Elmer). cDNA was synthesized using oligo(dT)20 and a SuperScript III First-Strand Synthesis System for RT-PCR (Invitrogen). The first-strand cDNA was used as the template for PCR. For amplification of cDNA encoding mouse PD-L1 the following primers were used 5′-GCATTATATTCACAGCCTGC-3′ [mPD-L1 forward (f)] and 5′-CCCTTCAAAAGCTGGTCCTT-3′ [mPD-L1 reverse (r)] (PCR product: 267 bp). The murine GAPDH (mGAPDH) cDNA was used as an internal standard for template loading of PCR by using primers 5′-GTTGTCTCCTGCGACTTCA-3′ (mGAPDHf) and 5′-GGTGGTCCAGGGTTTCTTA-3′ (mGAPDHr) (PCR product: 184 bp). After the initial denaturation (2 min at 95 °C), amplification was performed with 25 cycles of 30 s at 95 °C, 15 s at 55 °C, and 30 s 72 °C, final extension of 10 min at 72 °C. PCR products were analyzed by 1% agarose electrophoresis with ethidium bromide staining.
Western Blotting.
Cells were lysed in mammalian protein extraction reagent (M-PER) (Thermo Scientific) containing protease and phosphatase inhibitors. Whole-cell lysates (30 µg per lane) were subjected to 10% SDS/PAGE and blotted onto PVDF membranes. Membranes were blocked for 1 h at room temperature with 5% dry skimmed milk in TBS [20 mM Tris⋅HCl (pH 7.6), 137 mM NaCl plus 0.1% (vol/vol) Tween 20] and probed with appropriate primary Abs overnight at 4 °C. Membranes were washed and incubated for 1 h at room temperature with secondary Ab conjugated with HRP. Results were visualized by chemiluminescence detection using a SuperSignal West Pico substrate (Thermo Scientific). To confirm equal loading, membranes were stripped using Restore Western blot stripping buffer (Thermo Scientific) and reprobed with Ab against β-actin (Santa Cruz Biotechnology).
PGE2 Production.
Analysis of PGE2 production was performed using an EIA kit and the protocol developed by Cayman Chemical.
In Vivo Treatment.
To establish subcutaneous tumors, mice were injected with 1 × 10⁶ MBT-2 tumor cells into the left flank of C3/He mice. Once tumors reached palpable size (6–7mm in diameter), mice were assigned into two groups: the vehicle control group (n = 4) and the celecoxib treatment group (n = 4). Celecoxib (50 mg/kg) or vehicle control (10% DMSO in PBS) were administrated in mice by daily intraperitoneal injections for 3 d. Twenty-four hours after the last injection, mice were euthanized in a CO2 chamber, and single-tumor cell suspensions were prepared by enzymatic digestion, as described. Cells were stained with fluorochrome-conjugated anti–PD-L1 Abs, and PD-l expression was measured using a fluorescent imaging system.
Statistical Analysis.
The statistical significance between values was determined by the Student t test. All data were expressed as means ± SD. Probability values ≥0.05 were considered nonsignificant. Flow cytometry data and the microscope images shown are representative of at least two separate determinations.
Acknowledgments
We thank Duane Mitchell (University of Florida) for critical reading of manuscript and valuable suggestions. This work has been supported by James and Esther King Biomedical Research Program Grant 10KN-10 (to S. Kusmartsev).
Footnotes
The authors declare no conflict of interest.
This article is a PNAS Direct Submission.
This article contains supporting information online at www.pnas.org/lookup/suppl/doi:10.1073/pnas.1612920114/-/DCSupplemental.
References
- 1.Chen L, Han X. Anti-PD-1/PD-L1 therapy of human cancer: past, present, and future. J Clin Invest. 2015;125(9):3384–3391. doi: 10.1172/JCI80011. [DOI] [PMC free article] [PubMed] [Google Scholar]
- 2.Ansell SM, et al. PD-1 blockade with nivolumab in relapsed or refractory Hodgkin’s lymphoma. N Engl J Med. 2015;372(4):311–319. doi: 10.1056/NEJMoa1411087. [DOI] [PMC free article] [PubMed] [Google Scholar]
- 3.Robert C, et al. KEYNOTE-006 investigators Pembrolizumab versus ipilimumab in advanced melanoma. N Engl J Med. 2015;372(26):2521–2532. doi: 10.1056/NEJMoa1503093. [DOI] [PubMed] [Google Scholar]
- 4.Garon EB, et al. KEYNOTE-001 Investigators Pembrolizumab for the treatment of non-small-cell lung cancer. N Engl J Med. 2015;372(21):2018–2028. doi: 10.1056/NEJMoa1501824. [DOI] [PubMed] [Google Scholar]
- 5.Brahmer JR, et al. Safety and activity of anti-PD-L1 antibody in patients with advanced cancer. N Engl J Med. 2012;366(26):2455–2465. doi: 10.1056/NEJMoa1200694. [DOI] [PMC free article] [PubMed] [Google Scholar]
- 6.Powles T, et al. MPDL3280A (anti-PD-L1) treatment leads to clinical activity in metastatic bladder cancer. Nature. 2014;515(7528):558–562. doi: 10.1038/nature13904. [DOI] [PubMed] [Google Scholar]
- 7.Moussa M, Omran Z, Nosseir M, Lotfy A, Swellam T. Cyclooxygenase-2 expression on urothelial and inflammatory cells of cystoscopic biopsies and urine cytology as a possible predictive marker for bladder carcinoma. APMIS. 2009;117(1):45–52. doi: 10.1111/j.1600-0463.2008.00014.x. [DOI] [PubMed] [Google Scholar]
- 8.Eruslanov E, et al. Circulating and tumor-infiltrating myeloid cell subsets in patients with bladder cancer. Int J Cancer. 2012;130(5):1109–1119. doi: 10.1002/ijc.26123. [DOI] [PubMed] [Google Scholar]
- 9.Sjödahl G, et al. Infiltration of CD3+ and CD68+ cells in bladder cancer is subtype specific and affects the outcome of patients with muscle-invasive tumors. Urol Oncol. 2014;32(6):791–797. doi: 10.1016/j.urolonc.2014.02.007. [DOI] [PubMed] [Google Scholar]
- 10.Kusmartsev S, Vieweg J. Enhancing the efficacy of cancer vaccines in urologic oncology: new directions. Nat Rev Urol. 2009;6(10):540–549. doi: 10.1038/nrurol.2009.177. [DOI] [PubMed] [Google Scholar]
- 11.Gabrilovich DI, Ostrand-Rosenberg S, Bronte V. Coordinated regulation of myeloid cells by tumours. Nat Rev Immunol. 2012;12(4):253–268. doi: 10.1038/nri3175. [DOI] [PMC free article] [PubMed] [Google Scholar]
- 12.Egawa M, et al. Inflammatory monocytes recruited to allergic skin acquire an anti-inflammatory M2 phenotype via basophil-derived interleukin-4. Immunity. 2013;38(3):570–580. doi: 10.1016/j.immuni.2012.11.014. [DOI] [PubMed] [Google Scholar]
- 13.Kusmartsev S, Gabrilovich DI. STAT1 signaling regulates tumor-associated macrophage-mediated T cell deletion. J Immunol. 2005;174(8):4880–4891. doi: 10.4049/jimmunol.174.8.4880. [DOI] [PubMed] [Google Scholar]
- 14.Dong H, et al. Tumor-associated B7-H1 promotes T-cell apoptosis: a potential mechanism of immune evasion. Nat Med. 2002;8(8):793–800. doi: 10.1038/nm730. [DOI] [PubMed] [Google Scholar]
- 15.Wang D, Dubois RN. Eicosanoids and cancer. Nat Rev Cancer. 2010;10(3):181–193. doi: 10.1038/nrc2809. [DOI] [PMC free article] [PubMed] [Google Scholar]
- 16.Rodriguez PC, et al. Arginase I in myeloid suppressor cells is induced by COX-2 in lung carcinoma. J Exp Med. 2005;202(7):931–939. doi: 10.1084/jem.20050715. [DOI] [PMC free article] [PubMed] [Google Scholar]
- 17.Sinha P, Clements VK, Fulton AM, Ostrand-Rosenberg S. Prostaglandin E2 promotes tumor progression by inducing myeloid-derived suppressor cells. Cancer Res. 2007;67(9):4507–4513. doi: 10.1158/0008-5472.CAN-06-4174. [DOI] [PubMed] [Google Scholar]
- 18.Kalinski P. Regulation of immune responses by prostaglandin E2. J Immunol. 2012;188(1):21–28. doi: 10.4049/jimmunol.1101029. [DOI] [PMC free article] [PubMed] [Google Scholar]
- 19.Samuelsson B, Morgenstern R, Jakobsson PJ. Membrane prostaglandin E synthase-1: a novel therapeutic target. Pharmacol Rev. 2007;59(3):207–224. doi: 10.1124/pr.59.3.1. [DOI] [PubMed] [Google Scholar]
- 20.Tai HH, Cho H, Tong M, Ding Y. NAD+-linked 15-hydroxyprostaglandin dehydrogenase: structure and biological functions. Curr Pharm Des. 2006;12(8):955–962. doi: 10.2174/138161206776055958. [DOI] [PubMed] [Google Scholar]
- 21.Kömhoff M, et al. Enhanced expression of cyclooxygenase-2 in high grade human transitional cell bladder carcinomas. Am J Pathol. 2000;157(1):29–35. doi: 10.1016/S0002-9440(10)64513-0. [DOI] [PMC free article] [PubMed] [Google Scholar]
- 22.Tseng-Rogenski S, et al. Loss of 15-hydroxyprostaglandin dehydrogenase expression contributes to bladder cancer progression. Am J Pathol. 2010;176(3):1462–1468. doi: 10.2353/ajpath.2010.090875. [DOI] [PMC free article] [PubMed] [Google Scholar]
- 23.Eruslanov E, Daurkin I, Ortiz J, Vieweg J, Kusmartsev S. Pivotal advance: tumor-mediated induction of myeloid-derived suppressor cells and M2-polarized macrophages by altering intracellular PGE2 catabolism in myeloid cells. J Leukoc Biol. 2010;88(5):839–848. doi: 10.1189/jlb.1209821. [DOI] [PMC free article] [PubMed] [Google Scholar]
- 24.Alberti MO, et al. A myeloid cell-binding adenovirus efficiently targets gene transfer to the lung and escapes liver tropism. Gene Ther. 2013;20(7):733–741. doi: 10.1038/gt.2012.91. [DOI] [PMC free article] [PubMed] [Google Scholar]
- 25.Lu ZH, et al. The myeloid-binding peptide adenoviral vector enables multi-organ vascular endothelial gene targeting. Lab Invest. 2014;94(8):881–892. doi: 10.1038/labinvest.2014.78. [DOI] [PMC free article] [PubMed] [Google Scholar]
- 26.Balkwill F, Charles KA, Mantovani A. Smoldering and polarized inflammation in the initiation and promotion of malignant disease. Cancer Cell. 2005;7(3):211–217. doi: 10.1016/j.ccr.2005.02.013. [DOI] [PubMed] [Google Scholar]
- 27.Zelenay S, et al. Cyclooxygenase-dependent tumor growth through evasion of immunity. Cell. 2015;162(6):1257–1270. doi: 10.1016/j.cell.2015.08.015. [DOI] [PMC free article] [PubMed] [Google Scholar]
- 28.Kurtova AV, et al. Blocking PGE2-induced tumour repopulation abrogates bladder cancer chemoresistance. Nature. 2015;517(7533):209–213. doi: 10.1038/nature14034. [DOI] [PMC free article] [PubMed] [Google Scholar]
- 29.Le CP, et al. Chronic stress in mice remodels lymph vasculature to promote tumour cell dissemination. Nat Commun. 2016;7:10634. doi: 10.1038/ncomms10634. [DOI] [PMC free article] [PubMed] [Google Scholar]
- 30.Dowd NP, Scully M, Adderley SR, Cunningham AJ, Fitzgerald DJ. Inhibition of cyclooxygenase-2 aggravates doxorubicin-mediated cardiac injury in vivo. J Clin Invest. 2001;108(4):585–590. doi: 10.1172/JCI11334. [DOI] [PMC free article] [PubMed] [Google Scholar]
- 31.Lévesque LE, Brophy JM, Zhang B. Time variations in the risk of myocardial infarction among elderly users of COX-2 inhibitors. CMAJ. 2006;174(11):1563–1569. doi: 10.1503/cmaj.051679. [DOI] [PMC free article] [PubMed] [Google Scholar]


