Significance
The world’s population is growing older, and senescence of the immune system is a fundamental factor underlying morbidity and mortality. We report a direct molecular characterization of the effects of aging on the adaptive immune system by high-throughput sequencing of antibody transcripts in the peripheral blood of humans. Using a phylogenetic approach to quantify dissimilarity, we compared the immunoglobulin repertoires of young and elderly individuals at baseline and during a well-defined immunogenic perturbation in the form of influenza vaccination; we also studied the long-term effects of chronic infection. Our work reveals previously unappreciated signatures of immune senescence that may find diagnostic use and guide approaches for improving elderly patients’ antibody responses.
Keywords: aging, antibody repertoire, influenza vaccine, CMV, UniFrac
Abstract
The elderly have reduced humoral immunity, as manifested by increased susceptibility to infections and impaired vaccine responses. To investigate the effects of aging on B-cell receptor (BCR) repertoire evolution during an immunological challenge, we used a phylogenetic distance metric to analyze Ig heavy-chain transcript sequences in both young and elderly individuals before and after influenza vaccination. We determined that BCR repertoires become increasingly specialized over a span of decades, but less plastic. In 50% of the elderly individuals, a large space in the repertoire was occupied by a small number of recall lineages that did not decline during vaccine response and contained hypermutated IgD+ B cells. Relative to their younger counterparts, older subjects demonstrated a contracted naive repertoire and diminished intralineage diversification, signifying a reduced substrate for mounting novel responses and decreased fine-tuning of BCR specificities by somatic hypermutation. Furthermore, a larger proportion of the repertoire exhibited premature stop codons in some elderly subjects, indicating that aging may negatively affect the ability of B cells to discriminate between functional and nonfunctional receptors. Finally, we observed a decreased incidence of radical mutations compared with conservative mutations in elderly subjects’ vaccine responses, which suggests that accumulating original antigenic sin may be limiting the accessible space for paratope evolution. Our findings shed light on the complex interplay of environmental and gerontological factors affecting immune senescence, and provide direct molecular characterization of the effects of senescence on the immune repertoire.
The deterioration of immune function with age, a process referred to as immunosenescence, is well recognized. Notable changes contributing to immunosenescence include, among others, decreased proliferation of lymphocytes, reduced T-cell receptor repertoire, and defects in antibody production (1, 2). This phenomenon contributes to an age-related increase in susceptibility to viral and bacterial infections and decreased response to vaccination (3–5). Indeed, individuals over the age of 65 y are less than half as protected by standard influenza vaccines as younger individuals (6), and pneumonia and influenza represent the fourth most common cause of death among aging individuals (4).
Antibody-mediated immunity is the result of an evolutionary arms race between the pathogens to which an individual is exposed and antibody-producing B cells. A tremendous diversity of potential antibody affinities is generated by the mechanisms of V(D)J recombination, random junctional insertions/deletions, and somatic hypermutation (7). Preferential proliferation of activated B cells upon encounter with a cognate antigen then exerts a selective pressure for B-cell receptors (BCRs) with a high binding affinity to the antigen (7). The clonal history of B cells circulating in the blood can be traced using next-generation sequencing of the hypervariable complementarity-determining region 3 (CDR3) in Ig heavy-chain (IGH) transcripts (8, 9).
Elderly individuals’ B-cell repertoires have been reported to exhibit restricted clonal diversity, oligoclonal character, increased baseline mutation levels, and persistent clonal expansions in previous studies of IGH sequence diversity (8, 10). However, previous work was limited by small numbers of elderly individuals analyzed (8), did not analyze in detail the composition of the oligoclonal lineages (8), or did not study the effect of applying an immune stimulus such as a vaccine (10). Furthermore, previous B-cell repertoire studies have focused only on isolated aspects of B-cell mutation counts, V/D/J-gene use levels, lineage sizes, and convergent CDR3 sequences (8, 10–13) without analyzing the character of mutations and without using the full phylogenetic information inherent in the IGH repertoire to quantify dissimilarities between immune systems.
Here, we identify signatures of immune aging by carrying out a phylogenetic analysis of IGH transcripts in the peripheral blood of healthy young and elderly volunteers before and after influenza vaccination. First, we study the increasing specialization of the antibody repertoire by developing a phylogenetic distance metric for the repertoire based on unique fraction (UniFrac) (14). Next, we analyze the prevalence of B-cell oligoclonality and the composition of the relevant lineages in the elderly. Finally, we examine the effect of age on vaccine response and its underlying factors, including the diversity of the substrate for novel responses, the somatic hypermutation process, and the clonal selection process.
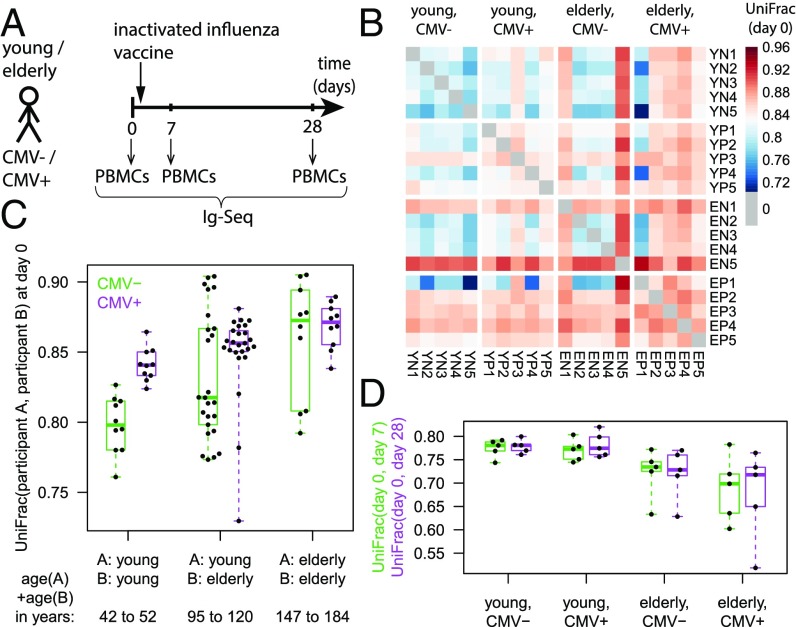
Our study comprised 10 healthy young subjects and 10 healthy elderly subjects, with blood sampled at baseline, day 7, and day 28 relative to vaccination with the 2011 seasonal trivalent inactivated influenza vaccine (Fig. 1A and Table S1). Because immunosenescence has been reported to be more pronounced in men (15), only male subjects were chosen. Because chronic infection with the widespread cytomegalovirus (CMV) is known to be a confounding factor in the study of immune aging (10), we stratified the analysis by CMV serostatus assessed by IgG ELISA.
Fig. 1.
Comparison of repertoire distances between individuals. (A) Study design. PBMCs, peripheral blood mononuclear cells. (B) UniFrac distances between study participants at baseline. Participant labels begin with a two-letter code indicating age group and CMV status. (C) Comparison of between-participant UniFrac values at baseline by age range and CMV status. (D) Within-participant longitudinal UniFrac values.
Table S1.
Demographic information on study participants
| Participant ID | Age, y | CMV serostatus |
| YN1 | 21 | Negative |
| YN2 | 23 | Negative |
| YN3 | 25 | Negative |
| YN4 | 25 | Negative |
| YN5 | 27 | Negative |
| YP1 | 21 | Positive |
| YP2 | 24 | Positive |
| YP3 | 24 | Positive |
| YP4 | 24 | Positive |
| YP5 | 24 | Positive |
| EN1 | 73 | Negative |
| EN2 | 74 | Negative |
| EN3 | 75 | Negative |
| EN4 | 75 | Negative |
| EN5 | 83 | Negative |
| EP1 | 85 | Positive |
| EP2 | 87 | Positive |
| EP3 | 91 | Positive |
| EP4 | 91 | Positive |
| EP5 | 93 | Positive |
ID, identification.
Results
Divergent Evolution of Immune Systems Quantified Using UniFrac.
In ecology, various phylogenetic methods have been developed to assess differences between microbial communities (14, 16–19). Among these methods, the UniFrac distance measure stands out because it is a true metric in the mathematical sense, allowing multiple communities to be compared meaningfully at the same time (14). UniFrac quantifies differences between environments, from the point of view of bacterial adaptation, by measuring the total branch length of a tree of 16S rRNA gene sequences that is unique to each environment (14). The reasoning is that random genetic changes generate a diversity of bacterial taxa, and the extent to which environments share branches of a phylogeny can be regarded as a measure for the degree of similarity between the selection pressures imposed by these environments. By analogy, differences in immune adaptation to antigen challenge can be quantified by calculating the branch length unique to each individual on a tree of IGH sequences. Indeed, V(D)J recombination and somatic hypermutation have the potential to generate a diverse set of B cells, and the population actually found in a participant tells us which lineages were selected for proliferation through activation by a cognate antigen. Thus, it is natural to apply UniFrac to antibody repertoire sequence data. The original method based on a single gene (the 16S rRNA gene) can be extended (20) to account for the use of multiple genes (here, the various VDJ rearrangements).
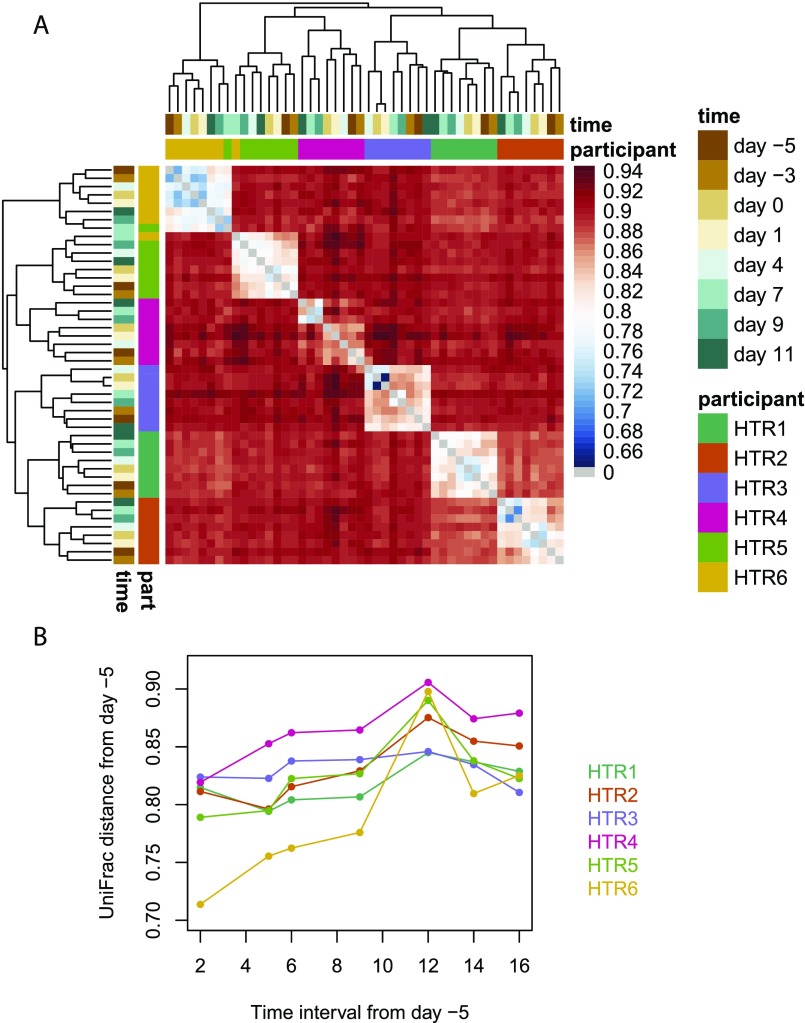
In our implementation of UniFrac, each group of sequences having the same V-gene, J-gene, and CDR3 length is combined into a phylogenetic tree rooted at a pseudo-germline sequence constructed by masking any allelic or junctional differences between participants. Because all groups originate from rearrangement of the full heavy-chain locus, we consider all of the pseudo-germline sequences to be at the same level, the root level, in the overall phylogeny of repertoires. We then compute a weighted UniFrac distance on the overall phylogenetic tree encompassing all groups as described in SI Materials and Methods. Applying UniFrac to a separate cohort of young individuals sampled at eight time points over the course of 2 wk indicated that changes in a participant’s repertoire composition over a span of 2 wk were resolvable but substantially smaller than differences between individuals (Fig. S1).
Fig. S1.
UniFrac analysis at high time resolution. These data are from six healthy volunteers (labeled HTR1–HTR6) in the age range of 17–30 y separate from the main text study, sampled at days −5, −3, 0, 1, 4, 7, 9, and 11 relative to 2012 seasonal trivalent inactivated influenza vaccine administration. BCR libraries were prepared and sequenced using a previously published protocol (11) very similar to the protocol used for the main text cohort. Participants HTR1, HTR2, HTR3, HTR4, HTR5, and HTR6 were aged 18, 28, 25, 24, 19, and 28 y, respectively, and were female, male, male, male, female, and male, respectively. (A) Heat map of UniFrac values between participants and time points, clustered using complete linkage. (B) Within-participant longitudinal UniFrac distances as a function of time interval. Day 7 marks peak vaccine response. Five of 6 participants showed an increase in UniFrac from the smallest time interval to the largest.
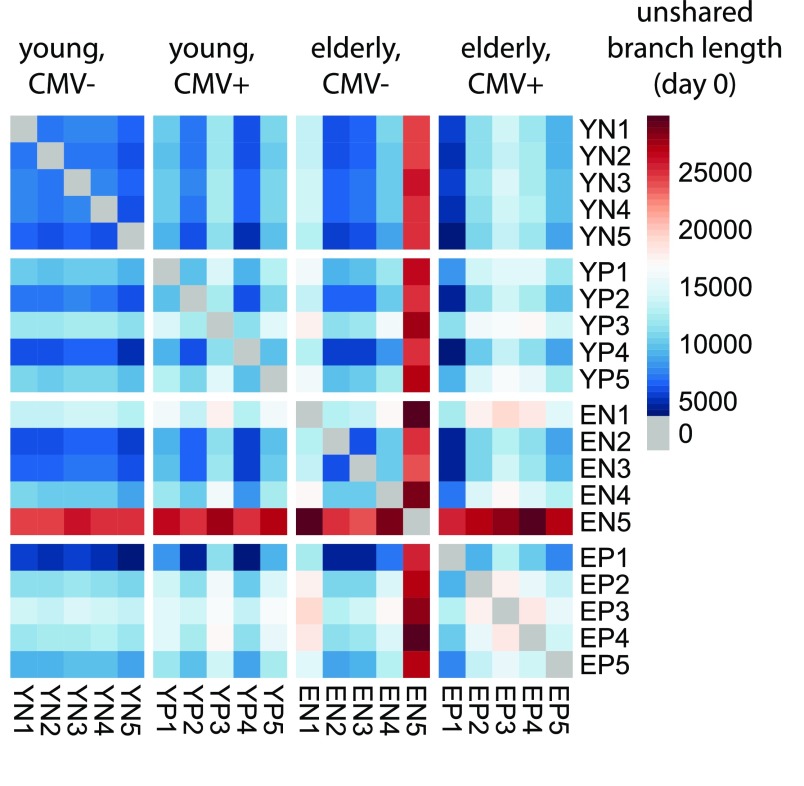
Applying UniFrac to our main cohort indicated that aging increased the phylogenetic distinctness of the affected immune repertoires, reflecting how different individuals’ immune repertoires diverge with time (Fig. 1 B and C; nonnormalized unique branch lengths of the phylogenetic tree are also shown in Fig. S2). Indeed, let us consider the sum of two participants’ ages to represent the time span over which their antibody repertoires, assumed to be comparable at birth, have diverged evolutionarily as a result of idiosyncratic pathogen exposure. Then, we find that UniFrac distance between participants is positively correlated with divergence time [Pearson product-momentum correlation coefficient (PPMCC) = 0.40 with P = 7.4 × 10⁻⁹; P = 0.038, Mantel test), particularly in the CMV− group (PPMCC = 0.50 with P = 4.2 × 10⁻⁴) and less so in the CMV+ group (PPMCC = 0.37 with P = 0.012). The age-related increase in UniFrac was less pronounced in the CMV+ group than in the CMV− group because the CMV+ group exhibited elevated UniFrac values even among young participants (comparable to elderly participants in the CMV− group; Fig. 1C). These observations demonstrate, on a phylogenetic level, the continual specialization undergone by the B-cell repertoire over a lifetime, accelerated by chronic infection. This finding is consistent with reports of persistent clonal expansions in the elderly over the long term (at visits separated by a year) (10).
Fig. S2.
Nonnormalized unshared branch lengths between study participants at baseline. The displayed quantity is given by where A and B refer to the two participants under consideration (subsampled to 104 sequences each), G refers to the different V-segment/J-segment/CDR3-length groups, i refers to the branches of the phylogenetic tree constructed for group G, bi refers to the length of branch i, NiA refers to the number of A sequences in G descending from branch i, and NiB refers to the number of B sequences in G descending from branch i (details on phylogenetic tree construction are provided in SI Materials and Methods).
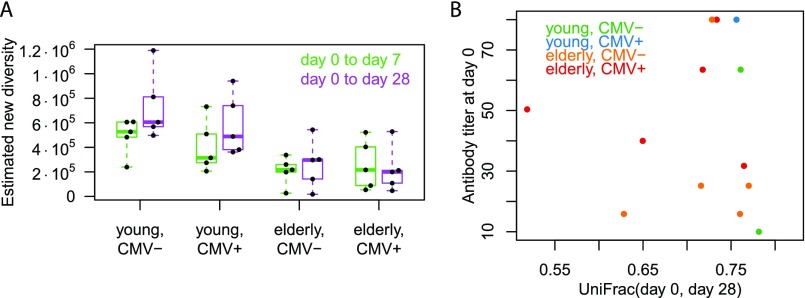
Therefore, we investigated whether short-term repertoire plasticity in response to a well-defined immunogenic challenge might be negatively affected with increasing age. We found indeed that UniFrac distances between prevaccine and postvaccine samples were smaller in the elderly than in the young participants [P = 3.9 × 10⁻³ for UniFrac (day 0, day 7), P = 7.3 × 10⁻⁴ for UniFrac (day 0, day 28); Fig. 1D]. Decreased distances from prevaccine to postvaccine repertoires may suggest impairment of affinity maturation in response to the vaccine. It should be noted that the distance between prevaccine and postvaccine samples can result from a convolution of two separate effects: temporal changes in the repertoire and sampling of sequences that were present at both time points but only captured at one of them (given the limited size of blood samples and sequencing coverage). To address the challenge of limited capture, we estimated the true diversity of new IGH sequences created from prevaccine to postvaccine repertoires using nonparametric statistics on the molecular abundance profiles (21, 22) and found that the newly created diversity was decreased in the elderly (Fig. S3A), which qualitatively corroborates our UniFrac findings. Aside from impaired affinity maturation, another explanation for reduced day 0–day 28 distances might be the longer flu vaccination history of the elderly, but day 0–day 28 distances were not found to be inversely correlated with prevaccination serum antibody titers (Fig. S3B).
Fig. S3.
Longitudinal aspects of the main text study cohort. (A) Estimate of new sequence diversity created from day 0 to day 7 [respectively (resp.) day 28]: Chao1 diversity estimate at day 7 (resp. day 28) minus Chao estimate of shared diversity (22) between day 0 and day 7 (resp. day 28) samples. (B) Day 0 to day 28 UniFrac distance for each participant versus the participant’s day 0 influenza antibody titer. The correlation between the two variables was not statistically significantly different from 0. Here, antibody titers were assessed by hemagglutination inhibition assay for all three strains present in the vaccine, and the geometric mean of the three values was reported. Note that titers were not available for all participants.
Characterization of Oligoclonal B-Cell Expansions in Aging.
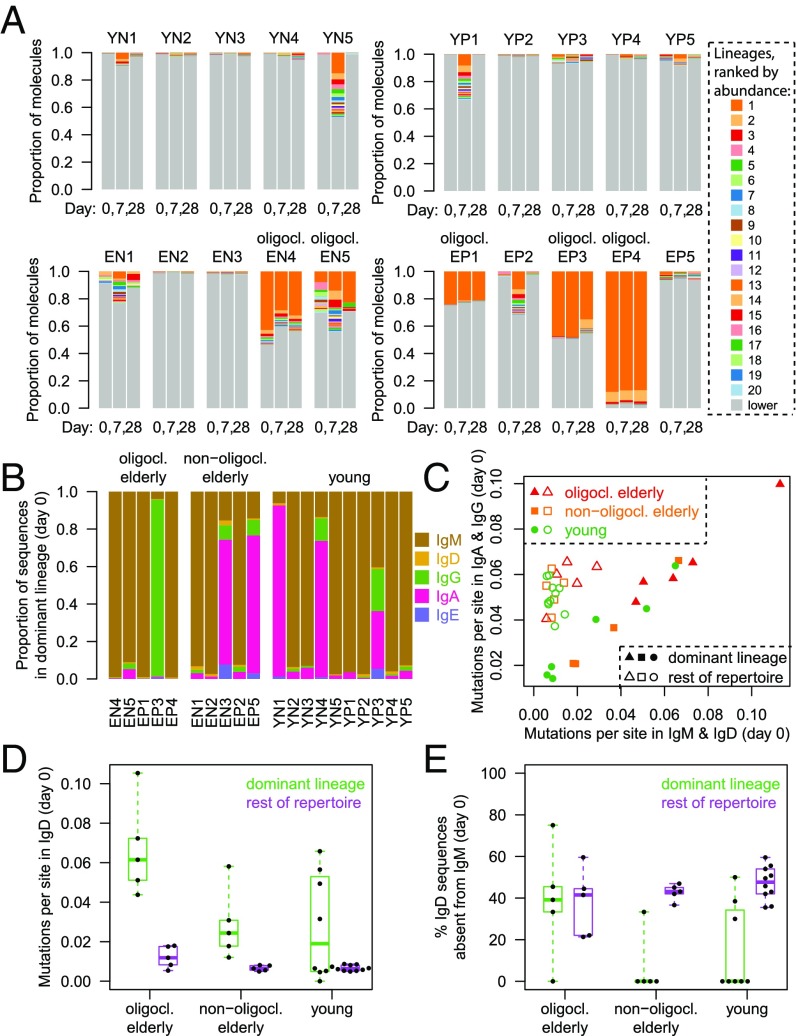
A subset of elderly individuals has been reported to have an oligoclonal repertoire structure not found in young subjects, where one or several B-cell lineages are expanded to abnormal proportions (8, 23). This finding is confirmed by our data (Fig. 2A). Here, we defined a lineage or clone as a set of sequences derived from the same putative VDJ rearrangement event, identified by requiring sequences to have the same V-gene, the same J-gene, the same CDR3 length, and 90% similarity in the CDR3 in single-linkage clustering. Oligoclonality was then defined as the presence of at least one lineage constituting more than 5% of the repertoire by molecular abundance at all three time points. Five of 10 elderly subjects displayed oligoclonality, whereas no young subjects did (Fig. 2A). Interestingly, the abnormally expanded “superlineages” continued to make up a similar fraction of the total repertoire at days 7 and 28 after vaccination as they did before vaccination at day 0, indicating that the size of any vaccine response [e.g., release of recalled IgG plasmablasts around day 7 (11, 24, 25)] was minor compared with the weight of the superlineages. Note that no CDR3 sequences were shared between superlineages, which provides confidence that superlineages did not arise from contamination.
Fig. 2.
Dissection of oligoclonality. (A) Lineage composition of repertoires by abundance of RNA molecules. The 20 most abundant lineages across all visits are distinguished by color and vertical order; transcripts belonging to the less abundant lineages are represented in gray. Participants displaying oligoclonality are labeled “oligocl.”. (B) Isotype proportions (weighted by distinct sequences rather than molecular abundance) in the most abundant lineage at baseline. (C) Mutation loads in isotype-unswitched versus switched compartments of the most abundant lineage and of the rest of the repertoire. (D) Average mutation loads in IgD sequences. (E) Percentage of VDJ sequences in the IgD compartment that were not observed in the IgM compartment.
We asked what characterized the composition of the superlineages. The dominant (i.e., most abundant) lineage in nonoligoclonal participants contained either a majority of IgM sequences or a majority of IgA sequences (Fig. 2B). In contrast, the dominant lineage in oligoclonal participants tended to consist almost exclusively of IgM except for one case dominated by IgG (Fig. 2B). The elevated mutation loads of the superlineages compared with the rest of the repertoire were consistent with a memory character (Fig. 2C). Note that superlineages in oligoclonal participants tended to have higher mutation loads than dominant lineages from similarly aged nonoligoclonal participants (Fig. 2C). The degree of expansion, elevated mutation loads, and persistence in the face of vaccine challenge all suggest that the superlineages have existed in the affected participants for a long time, a notion consistent with previous reports of clonal expansions persisting over the course of at least an entire year in the elderly (10).
Surprisingly, we detected IgD sequences within the superlineages: Naive B cells express both IgD and IgM, whereas antigen-experienced B cells typically lose expression of IgD. IgD sequences in the superlineages of oligoclonal participants were, on average, more highly mutated than IgD sequences in the most abundant lineages of nonoligoclonal elderly or young participants (P = 0.014; Fig. 2D). The highly mutated IgD sequences may stem either from atypical IgD+IgM+ memory cells expressing both IgM and IgD via alternative splicing (26–29) or from rare IgM−IgD+ B cells having entirely class-switched to IgD via genetic recombination (26, 30). We noted that an appreciable percentage of VDJ sequences with the IgD isotype was absent from the IgM isotype in oligoclonal participants’ superlineages (Fig. 2E), larger than the corresponding percentage in nonoligoclonal elderly or young participants (P = 0.040). This observation suggests that superlineages may be characterized by an increased prevalence of IgM−IgD+ B cells. Little is known about the function of IgD, but antibodies from IgD-switched B cells have been reported to be highly autoreactive (30). It has been hypothesized that IgD influences signaling so as to reduce negative selection of B cells that express it (31). Such an effect might play a role in ensuring preservation of a “diversely reactive reservoir” (32) for future needs even as the cells with the highest affinity to a specific antigen undergo proliferation during an infection. We speculate that the IgD+ memory B cells detected here may play a role in sustaining the proliferation of these superlineages, and that hypermutating IgD+ cells may merit renewed attention in the context of aging.
Effect of Aging on Repertoire Structure.
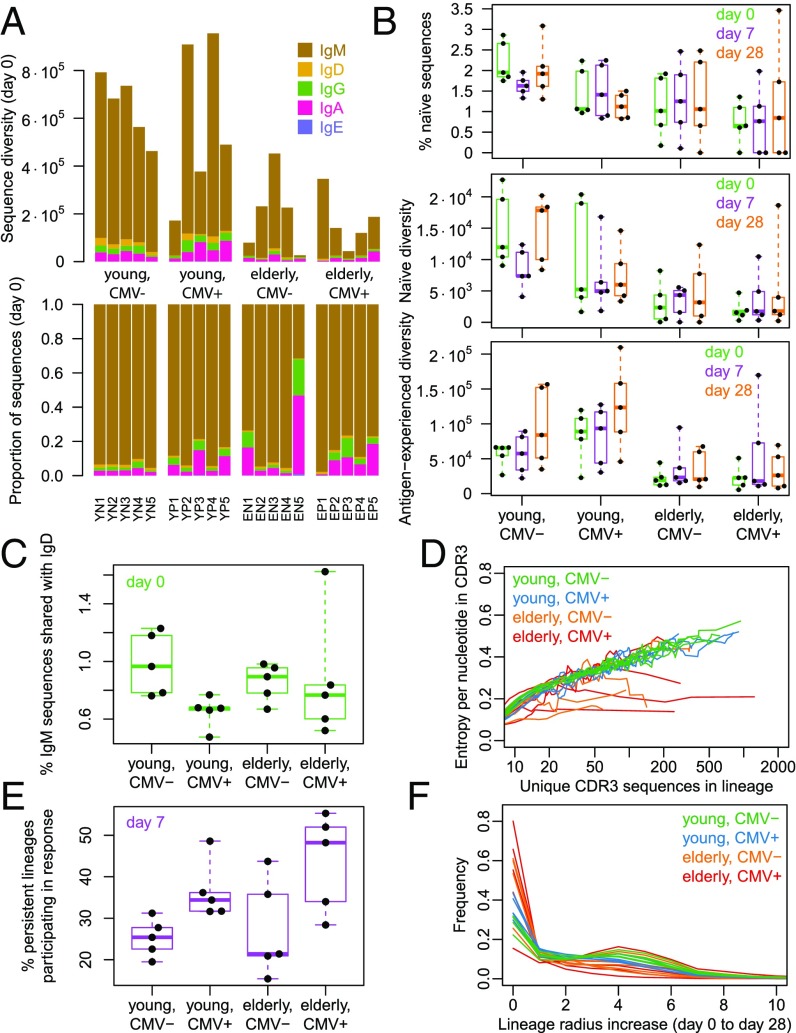
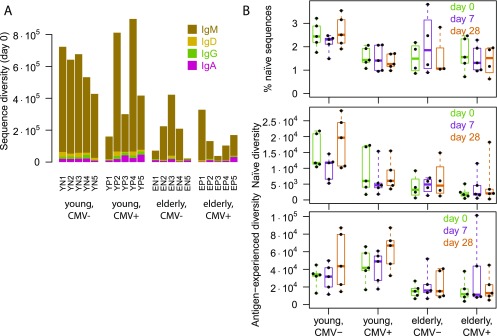
IGH repertoire diversity, corrected for uncaptured sequences using the Chao1 estimator (21), was seen to decrease with age (Fig. 3A), consistent with previous studies (8, 23). A recently proposed estimator for the unseen fraction of sequences (33) gave similar results (Fig. S4). Repertoire homeostasis was disturbed, as evidenced by increased proportions of isotype-switched sequences (IgA and IgG; Fig. 3A) and decreased proportions of naive sequences (unmutated IgD+; Fig. 3B). Note that, at baseline, the largest naive proportion was observed in young CMV− participants, whereas young CMV+ participants were more similar to the elderly groups (Fig. 3B). This finding is reminiscent of results regarding relative numbers of memory T cells compared with naive T cells that have suggested CMV infection induces premature immune aging (34, 35).
Fig. 3.
Repertoire structure as relevant to vaccine response. (A) Chao1 (21) estimates of repertoire diversity by isotype compartment and isotype proportions of observed sequences. (B) Relative and absolute sizes of naive and antigen-experienced compartments, in terms of numbers of distinct sequences estimated using Chao1. Here, isotype and mutation levels were used as proxies to separate compartments: “Naive” counts were based only on unmutated IgD sequences, and “antigen-experienced” counts were based only on IgA and IgG sequences. (C) Percentage of VDJ sequences in the IgM compartment that were also observed in the IgD compartment. (D) Analysis of within-lineage sequence entropy. The mean entropy per nucleotide was calculated for the sequences in each lineage and then averaged over all lineages with equal numbers of distinct sequences. Curves were smoothed using a moving-average filter of width 5 values. (E) Polyclonal vaccine response at day 7: Of lineages present at both day 0 and day 7, the percentage that increased in abundance from day 0 to day 7 (excluding superlineages) is shown. (F) Distribution of baseline-to-endpoint lineage radius increases. Here, only lineages present at both day 0 and day 28 were considered, and lineage radii from pooled day 0 and day 28 sequences were compared with radii from day 0 sequences.
Fig. S4.
Diversity estimates based on conditional uncovered probability (CUP) (33) computed with look-ahead r = 100 using QIIME (49). (A) CUP-derived estimates of repertoire diversity by isotype compartment. IgE was omitted because raw sequence counts were insufficient to compute the estimate in participants EP1 and EP3. (B) Relative and absolute sizes of naive and antigen-experienced compartments, in terms of numbers of distinct sequences estimated using CUP. Here, isotype and mutation levels were used as proxies to separate compartments: Naive counts were based only on unmutated IgD sequences, and antigen-experienced counts were based only on IgA and IgG sequences. Note that the estimates for “naive diversity” and “% naive sequences” were not feasible for participant EN5.
To understand how the capacity for vaccine response might be affected by the age-related loss of IGH diversity, we sought to identify which subsets of B cells were responsible. Loss of diversity in the naive compartment may result in an insufficient substrate for immune responses to novel antigens, whereas loss of diversity in the antigen-experienced compartment may signify deficiency in function and refinement of B-cell memory. Interestingly, we found that both compartments were affected by restrictions in diversity: The effect appeared to be driven by age in the antigen-experienced compartment, and by both age and CMV status in the naive compartment (Fig. 3B). Consistent with the differential effects of age and CMV on the naive and the antigen-experienced compartments, the fraction of IgM diversity shared with IgD (corresponding to a naive IgM+IgD+ phenotype) tended to be higher in CMV− than CMV+ participants regardless of age (Fig. 3C; P = 0.023).
Repertoire diversity is determined by two separate factors: the number of distinct B-cell lineages present and the number of different somatic mutations existing within each lineage. The number of lineages is known to be reduced in the elderly (8), raising the question of whether that factor alone is responsible for loss of diversity or whether a decrease in within-lineage mutational diversification plays a role as well. Although there have been individual reports of persistently expanded B-cell lineages with low mutational diversity in some elderly subjects (10), a systematic repertoire-wide characterization of within-lineage diversity has been lacking. Here, we compared the average entropy per nucleotide for lineages of equal sizes and found that elderly participants tended to display lower intralineage sequence entropy than young adults, and that the effect becomes more pronounced as lineages become more expanded (Fig. 3D). This observation indicates that elderly lineages cover a smaller portion of sequence space, perhaps as a result of a longer history of mutation fixation.
Effect of Age and CMV Status on Vaccine Response.
It has been reported that in young individuals, but not in elderly individuals, CMV infection enhances the serological response to influenza vaccination and leads to increased CD8+ effector memory T-cell frequencies, increased sensitivity of CD8+ T cells to cytokine stimuli, and increased levels of circulating IFN-γ (36). Here, we are able to probe the effects of CMV infection and age on the influenza vaccine response at the level of the B-cell heavy-chain repertoire. Of B-cell lineages that were detected at both day 0 and day 7, likely to be long-lived memory lineages, we asked what fraction had increased their transcript abundance from day 0 to day 7. Lineages responding in this way may correspond to B cells undergoing activation with further affinity maturation and/or differentiation into plasmablasts. Although elderly participants tend to have fewer lineages overall than young participants both prevaccination and postvaccination (8), we found that the fraction of persistent lineages responding to the vaccine was similar for both age groups (Fig. 3E). On the other hand, CMV+ individuals showed a markedly elevated fraction of responding lineages (P = 0.003). This finding suggests that CMV infection may enhance the activation process of memory B cells in both young and elderly participants. Age-related deficiencies of other immune components or a lessened ability to diversify the existing memory pool into high-affinity antibodies in aging may explain why an enhanced serum antibody response to influenza vaccine has been detected only in young, but not in elderly, CMV+ individuals (36).
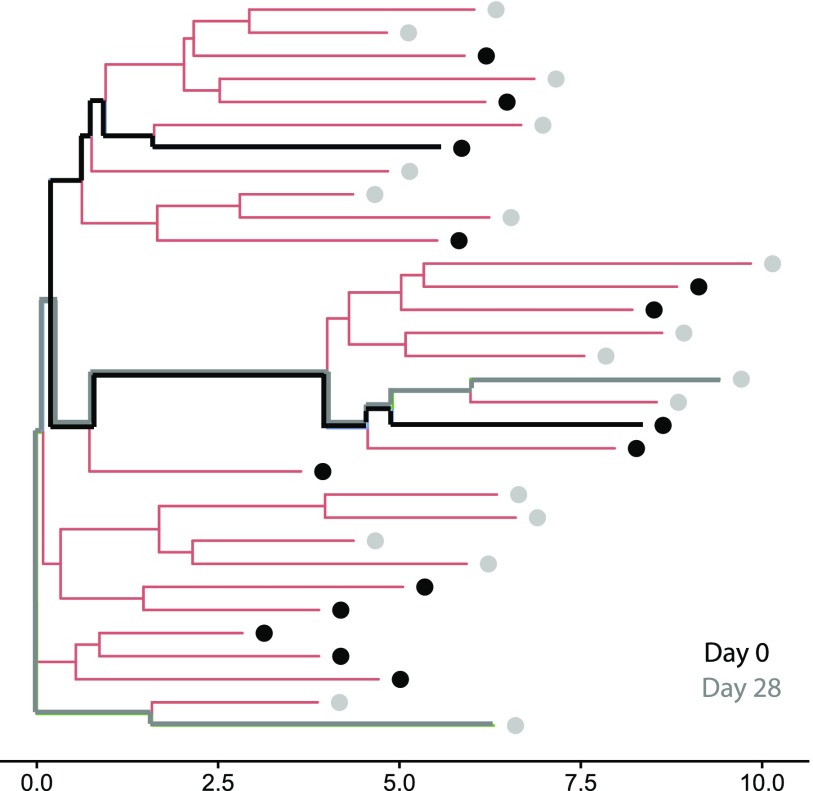
Next, we sought to address mutational diversification of lineages persisting through vaccine challenge. To this end, we defined a lineage “radius” as the maximum edit distance between any two CDR3 sequences in the lineage. By comparing the radii from pooled day 0 and day 28 sequences with the radii from day 0 sequences alone, we attempt to elucidate the degree of mutational excursion a lineage has undergone (Fig. S5). We observed that lineages tended to show increases in radius less often in the elderly than in the young (Fig. 3F), providing another indication that elderly participants’ repertoire contraction is associated with reduced intralineage mutational diversification.
Fig. S5.
Visualization of lineage radius increase. A lineage from participant YN1 at day 0 and day 28 is shown as a phylogenetic tree based on the edit distance between CDR3 sequences. Each leaf corresponds to one sequence, colored according to the time point at which it was observed. The axis measures distance (branch length) as the number of nucleotide substitutions. In this example, the “lineage radius increase from day 0 to day 28” (largest distance between any two gray or black sequences on the tree MINUS largest distance between any two black sequences) is 2. For each time point, the branches joining two sequences with the maximum edit distance between them are highlighted in bold.
Effect of Age on Somatic Mutation Character.
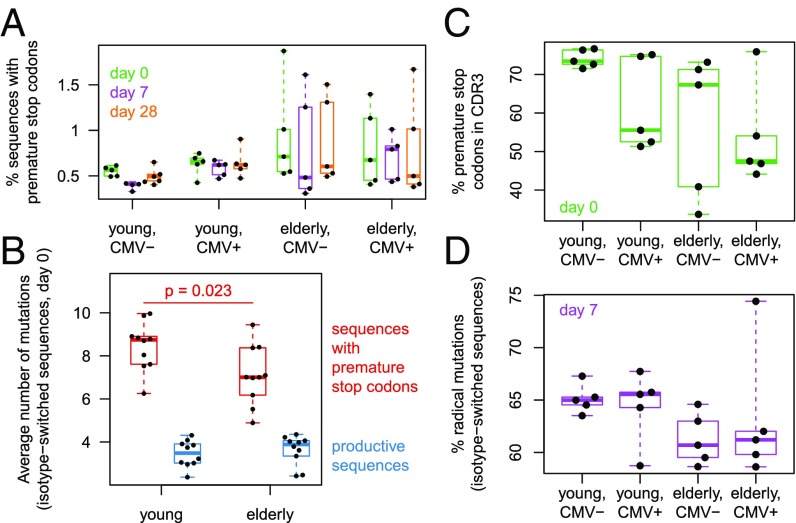
Additional information about the process of affinity maturation may be gained by analyzing how each mutation affects antibody amino acid sequences. Certain mutations may introduce premature stop codons into the heavy-chain sequence, in which case the corresponding transcripts are not expected to be translated to proteins. We found that the fraction of such unproductive sequences was low, but enriched in certain elderly subjects (Fig. 4A). Assuming B cells with unproductive sequences no longer bind antigen, and thus no longer proliferate, we can use overall V-segment mutation counts as a molecular clock to estimate at which point in the affinity maturation process the nonsense mutation appeared. As might be expected, sequences with premature stop codons, on average, displayed higher overall mutation loads than productive sequences (Fig. 4B), suggesting that the nonsense mutations arose late in B-cell lineages undergoing a large amount of proliferation with somatic hypermutation. Interestingly, according to the molecular clock, stop codons seemed to arise somewhat earlier in the hypermutation process for elderly participants than for young participants (Fig. 4B), which might explain why affected sequences make up a larger fraction of the repertoire. Note that the effect cannot be attributed to lower mutation loads across the entire repertoire, because productive sequences’ mutation loads were similar or, on the contrary, slightly elevated in the elderly [it is known that elderly individuals’ memory cells tend to be more highly mutated (8, 10)]. The distribution of the observed premature stop codons across IGH regions also differed between young and elderly individuals: In the elderly, stop codons occurred more often outside the CDR3 (Fig. 4C; P = 0.029). Stop codons were most concentrated in the CDR3 for young CMV− subjects; CMV seropositivity appeared to have a similar effect as age in shifting prevalence outside the CDR3.
Fig. 4.
Nonsense and missense amino acid mutation analysis. (A) Percentage of IGH sequences that contained at least one premature stop codon, while being in-frame. (B) Average number of V-region somatic mutations among in-frame sequences with a premature stop codon. The P value is from a two-sided Wilcoxon–Mann–Whitney test. (C) Percentage of observed premature stop codons that occurred in the CDR3. (D) Percentage of amino acid mutations in IgA and IgG sequences at day 7 that were considered radical. Similarity between the germline residue and the mutated residue was assessed by IMGT based on three aspects: hydropathy, volume, and chemical characteristics; a mutation was called “radical” if the residue changed class in at least two aspects.
Next, we focus on nonsynonymous mutations that alter the amino acid sequence without producing stop codons. The physicochemical properties of the new residue may be very similar to the old residue, making the mutation conservative, or they may be very distinct, potentially leading to a large change in the binding affinities of the antibody. We adopt the international ImMunoGeneTics information system (IMGT) classification of amino acid mutations based on changes in hydropathy, volume, and chemical characteristics (37), and consider mutations simultaneously changing class in at least two of the three aspects to be radical. Investigating the vaccine response by analyzing IgA and IgG sequences at day 7, we observed that young participants tended to display higher proportions of radical mutations than elderly individuals (Fig. 4D; P = 0.023). A plausible explanation is that young adults’ repertoires explore a wide portion of affinity space in a coarse-grained manner by substituting very dissimilar amino acids, whereas elderly people predominantly fine-tune their memory repertoire by substituting similar amino acids.
SI Materials and Methods
Study Design.
The present study was an exploratory study aimed at understanding age-related changes in humoral immunity from the standpoint of the BCR repertoire and its response to vaccination. The research subjects were healthy volunteers either in their twenties or above the age of 70 y. Because immune aging is thought to be more pronounced in men (15), we attempted to maximize the power of the study by analyzing only male subjects. We took care to control the analysis for the potential confounding factor of CMV serostatus (10) assessed by IgG ELISA. Thus, equal numbers of subjects were randomly chosen from young CMV−, young CMV+, elderly CMV−, and elderly CMV+ volunteer groups (Table S1). The Stanford Institutional Review Board approved protocols, and participants gave informed consent. Participants received the 2011 seasonal trivalent inactivated influenza vaccine (Fluzone single-dose syringe); blood was drawn just before vaccination and at days 7 and 28 after vaccination. The BCR sequence repertoire at each time point was measured by first isolating peripheral blood mononuclear cells using a Ficoll gradient according to Stanford Human Immune Monitoring protocols [stored by freezing in 10% (vol/vol) DMSO/40% (vol/vol) FBS], then extracting total RNA from the cells (Qiagen AllPrep kit on thawed cells), and finally sequencing a cDNA library with error-correcting barcodes prepared from the RNA using primers flanking the CDR3 region.
Library Preparation and Sequencing.
The library preparation process was a minor variation on a previously published protocol (11). Reverse transcription was carried out on 500 ng of total RNA using primers annealing to the IGH constant region (Table S2) and SuperScript III reverse transcriptase (Life Technologies) according to the manufacturer’s instructions. Second-strand synthesis was carried out using IGH variable-region primers (Table S3) and Phusion High-Fidelity DNA Polymerase (New England Biolabs) (at 98 °C for 4 min, 52 °C for 1 min, and 72 °C for 5 min). Constant-region and variable-region primers all contained eight random nucleotides to be used as molecule unique identifiers (UIDs) during analysis and were synthesized by Integrated DNA Technologies. Following two rounds of purification using Ampure XP beads (Beckman Coulter) at a 0.8:1 ratio, double-stranded cDNA was PCR-amplified using Platinum Taq DNA Polymerase High Fidelity (Life Technologies) with primers containing Illumina adapters as well as sample-multiplexing indexes. Products from all samples were purified using Ampure XP beads at a 0.7:1 ratio and then pooled and gel-purified using E-Gel EX Agarose Gels 2% (Invitrogen) and Freeze ‘N Squeeze DNA Gel Extraction Columns (Bio-Rad), before being sequenced on the NextSeq platform (Illumina) with 150-bp paired-end reads.
Table S2.
IGH constant-region primers
| Primer sequence (5′ to 3′) | Proportion in primer pool | Intended isotype specificity |
| TGACTGGAGTTCAGACGTGTGCTCTTCCGATCTNNNNNNNNAAGACCGATGGGCCCTTG | 1 | IgG |
| TGACTGGAGTTCAGACGTGTGCTCTTCCGATCTNNNNNNNNGAAGACCTTGGGGCTGGT | 1 | IgA |
| TGACTGGAGTTCAGACGTGTGCTCTTCCGATCTNNNNNNNNGGGAATTCTCACAGGAGACG | 1 | IgM |
| TGACTGGAGTTCAGACGTGTGCTCTTCCGATCTNNNNNNNNGGGTGTCTGCACCCTGATA | 1 | IgD |
| TGACTGGAGTTCAGACGTGTGCTCTTCCGATCTNNNNNNNNGAAGACGGATGGGCTCTGT | 1 | IgE |
| TGACTGGAGTTCAGACGTGTGCTCTTCCGATCTNNNNNNNNTTGCAGCAGCGGGTCAAGGG | 1 | IgE |
Follows a previously published protocol (11).
Table S3.
IGH variable-region primers
| Primer sequence (5′ to 3′) | Proportion in primer pool | Intended V-segment specificity |
| ACACTCTTTCCCTACACGACGCTCTTCCGATCTNNNNNNNNAGCCTACATGGAGCTGAGC | 1 | V1 |
| ACACTCTTTCCCTACACGACGCTCTTCCGATCTNNNNNNNNAGGTGGTCCTTACAATGACCAAC | 1 | V2 |
| ACACTCTTTCCCTACACGACGCTCTTCCGATCTNNNNNNNNTCTGCAAATGAACAGCCTGA | 1 | V3 |
| ACACTCTTTCCCTACACGACGCTCTTCCGATCTNNNNNNNNTGTTCAAATGAGCAGTCTGAGAG | 0.2 | V3 |
| ACACTCTTTCCCTACACGACGCTCTTCCGATCTNNNNNNNNTCTGCAAATGGGCAGCCTGA | 0.2 | V3 |
| ACACTCTTTCCCTACACGACGCTCTTCCGATCTNNNNNNNNTTCTCCCTGAAGCTGAACTCTG | 1 | V4/V6 |
| ACACTCTTTCCCTACACGACGCTCTTCCGATCTNNNNNNNNGCCTACCTGCAGTGGAGCAG | 1 | V5 |
| ACACTCTTTCCCTACACGACGCTCTTCCGATCTNNNNNNNNTTCTCCCTGCAGCTGAACTCTG | 1 | V6 |
| ACACTCTTTCCCTACACGACGCTCTTCCGATCTNNNNNNNNGCATATCTGCAGATCAGCAGC | 1 | V7 |
| ACACTCTTTCCCTACACGACGCTCTTCCGATCTNNNNNNNNCAGATCAGCAGCCTAAAGGC | 1 | V7 |
Follows a previously published protocol (11).
Data Processing.
The computational workflow was managed using Snakemake (41). Reads were processed using the pRESTO (38) suite (version 0.4.8) as follows. Raw reads were filtered for a mean Phred quality score of at least 20. PCR primer sequences were removed from both ends of each fragment, and each read was annotated with the preceding 8-nt random UID barcode. Reads with the same UID (“read groups”) were consolidated into a consensus sequence after alignment based on their non-UID primer sequences, and read groups exceeding a 0.1 error threshold against their consensus sequence were removed. Read groups that did not reach a 70% majority agreement regarding the identity of the IGH constant-region primer were also filtered out, whereas read groups that passed the threshold were annotated with an isotype based on the consensus primer. Read groups for which both paired-end mates were still present were then assembled into a single sequence based on overlap of the consensus mate sequences. Pairs exceeding an overlap error threshold of 0.3 or failing to reach an overlap significance threshold of P < 10−5 were removed. Sequences containing more than 10 ambiguous inner nucleotides (“Ns”), not counting ends, were filtered out. Next, reference constant-region sequences were aligned to the consensus sequences and trimmed off. Sequences that exceeded a 0.2 error threshold in the constant-region match were removed. Sequences were assigned a molecular abundance [number of different (8 + 8) − nucleotide UIDs with the same sequence] and a consensus count (total effective number of read pairs supporting the existence of the sequence, regardless of UID). Sequences with a consensus count below 2 were removed.
V, D, and J gene/allele assignment was carried out by the IMGT/HighV-QUEST tool (39), as was determination of whether sequences were functional, were out-of-frame, or contained premature stop codons.
Participants’ V-genotype was determined using the TIgGER (42) toolkit (without the novel-allele detection functionality) after pooling of all time points, and allele calls were reassigned based on the consensus genotype if necessary. In addition, we collapsed all allele designations that were a priori indistinguishable, given our choice of primers. Germlines for each sequence were inferred from the called V/D/J alleles and IMGT’s parsing of the VDJ junction using the Change-O (40) suite (version 0.3.3), as follows. Any junctional deletions identified by IMGT were trimmed off the V/D/J reference sequences. The trimmed reference sequences were then joined together, adding Ns for any junctional insertions determined by IMGT.
UniFrac Computation.
In detail, our implementation of UniFrac is defined as follows. First, each considered repertoire is randomly subsampled to 104 distinct VDJ sequences, with the probability of choosing a sequence being proportional to its abundance. Note that, before subsampling, identical VDJ sequences with different isotypes are consolidated into a single abundance value and isotype is no longer considered in the downstream calculation. VDJ sequences from all considered samples are then pooled and partitioned into groups defined by V-gene, J-gene, and CDR3 length. For each group, a “pseudo-germline sequence” is constructed from the IMGT reference sequences by masking any allelic differences between participants. Concretely, all nucleotides at which the germlines inferred by Change-O (40) for the sequences in a group differ [or are undetermined (Ns) for at least one inferred germline, as is the case at the positions of junctional insertions (as discussed above)] are replaced by Ns to make the group’s pseudo-germline sequence. This pseudo-germline sequence is the presumed ancestor (at unambiguous positions) of the observed sequences before somatic hypermutation. The loci masked in the pseudo-germline sequence are then also masked by Ns in all observed sequences from that group. For each group, we build a phylogenetic tree rooted at the pseudo-germline by neighbor-joining using the R-package “phangorn” (43), with branch lengths corresponding to mutational distance based on a published targeting model for single-nucleotide substitutions (44). Because all groups originate from rearrangement of the full heavy-chain locus, we consider all of the pseudo-germline sequences to be at the same level in the overall phylogeny of the repertoire. Conceptually, the final UniFrac distance is then the sum over each group of the unshared branch length, divided by the sum over each group of the total branch length. This distance is calculated for each pair of samples by considering only the branches found in those samples. Because multiple sequences from a participant may have been collapsed to a single unique sequence in the process of allele masking, we weight each unshared branch in the numerator by its descending sequences’ original proportion in the relevant V/J/CDR3-length group for the participant. Similarly, each branch length in the denominator is weighted by the sum of its descending sequences’ proportions in the relevant V/J/CDR3-length group for the two participants. Our UniFrac distance DAB between two samples A and B can thus be expressed as
where G refers to the different V/J/CDR3-length groups, i refers to the branches of the phylogenetic tree constructed for group G, bi refers to the length of branch i, piA refers to the proportion of A sequences in G descending from branch i, and piB refers to the proportion of B sequences in G descending from branch i. This weighting scheme was inspired by previous work (20, 45, 46); other schemes are possible and can be explored in future work. An illustration of the UniFrac calculation is provided in Fig. S6.
Fig. S6.
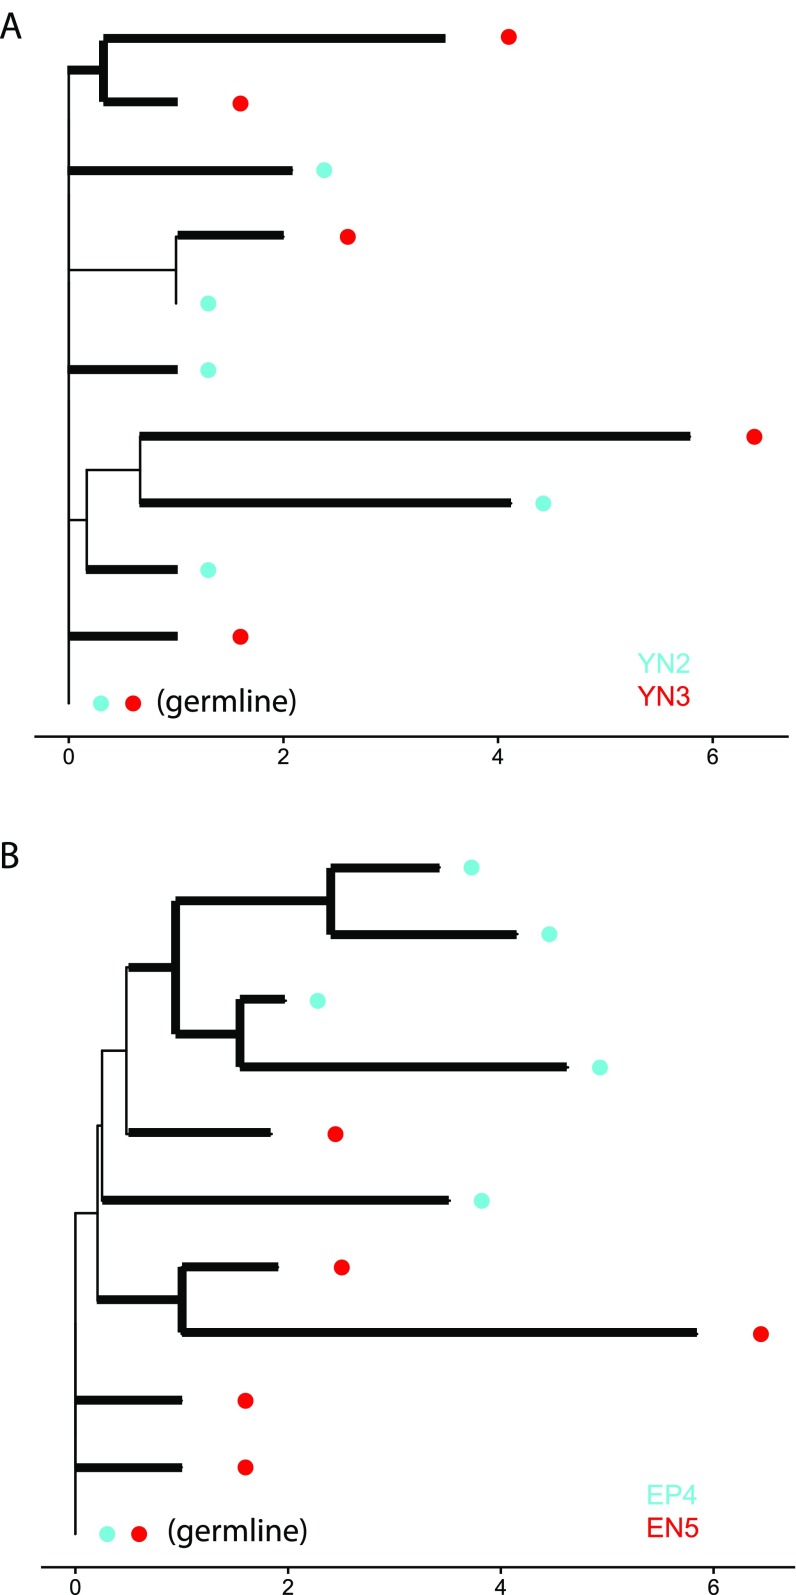
Illustration of UniFrac calculations for a pair of young participants and a pair of elderly participants at baseline. Six sequences with V-segment IGHV3-11, J-segment IGHJ4, and a CDR3 length of 45 nucleotides were sampled from each participant. Unshared branches are highlighted in bold. [Tree plots were generated using the R package “ggtree” (50)]. (A) Participants YN2 and YN3. The unshared branch length is 18.66, and the total branch length 20.32. After applying the weighting scheme described in SI Materials and Methods, the weighted unshared branch length is 3.17 and the weighted total branch length is 3.75, giving a UniFrac value of 0.84. (B) Participants EP4 and EN5. The unshared branch length is 21.95, the total branch length is 22.43, the weighted unshared branch length is 4.37, the weighted total branch length is 4.88, and the UniFrac value is 0.90. Notice how the elderly pair’s UniFrac value turns out larger than the young pair’s due to an increased prevalence of highly mutated sequences in unshared clades.
UniFrac Limitations and Use Guidelines.
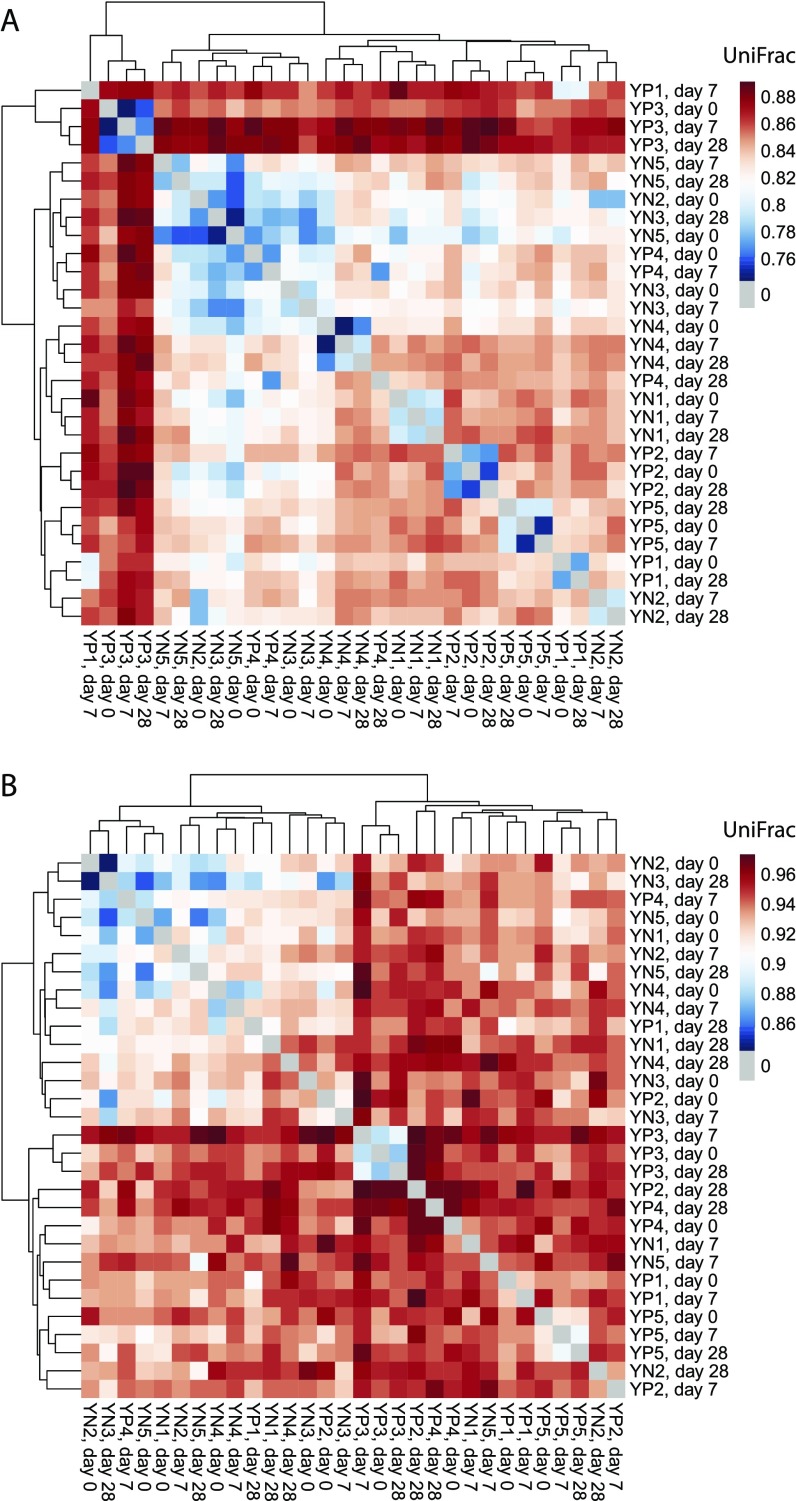
Note that UniFrac is sensitive to datasets and analysis parameters. First, values are expected to increase or decrease depending on the size of the sequenced region as set by the IGHV-segment primer design, so only repertoires generated using the same primer design should be compared. Second, cohort size affects UniFrac values because it influences the number of positions in the pseudo-germline sequence that will be masked due to allelic differences between subjects. Thus, UniFrac distances computed separately on different cohorts cannot necessarily be compared directly; rather, a new UniFrac matrix should be computed by considering all samples together in one batch. Third, the number of sequences to which repertoires are subsampled has a large effect on UniFrac values. In the present study, average (nonzero) UniFrac values for the main cohort increased from 0.85 to 0.94 as the subsample size was decreased from 104 to 103 sequences. Thus, subsample size should be chosen as large as simultaneously possible for all subjects to increase the dynamic range and discrimination potential of UniFrac. Note that in complete-linkage clustering of the young participants in the main study cohort, samples from the same participant clustered together most of the time, but not all of the time (Fig. S7A). The ability of UniFrac to distinguish young self from other young subjects decreased further when the subsample size was decreased from 104 to 103 sequences (Fig. S7B). If libraries were sequenced deeply enough for the subsample size to be increased far enough beyond 104 in all samples, UniFrac might become able to discriminate perfectly between young self and other young subjects.
Fig. S7.
Effect of sampling depth on UniFrac’s dynamic range and discrimination potential between young individuals. (A) UniFrac distance matrix computed from 104 sequences per sample. (B) UniFrac distance matrix computed from 103 sequences per sample. Dendrograms were produced using complete-linkage clustering. Notice that cluster samples from the same participant more often fail to cluster together in B than in A. Note also the generalized increase in UniFrac values from A to B.
Lineage Clustering.
To be considered as belonging to the same lineage, IGH sequences first needed to have the same combination of V-gene, J-gene, and CDR3 length. Single-linkage clustering on CDR3-nucleotide sequences was then used to cluster IGH sequences fulfilling this criterion into separate lineages. The dissimilarity cutoff for clustering was a Hamming distance equaling 10% of the length of the CDR3 sequence. Hamming distances were calculated using the R-package “stringdist” (47).
Removal of Error Clouds.
For the arguments of Figs. 3 D and F and 4 to be supported, care was to be taken to eliminate any single-nucleotide errors that might have arisen during RT. A unique sequence that is represented by a large number of molecules in the original RNA sample may give rise to a cloud of apparently distinct sequences because a fraction of the molecules will be reverse-transcribed with errors. In contrast to PCR errors, such RT errors cannot be detected by the UID consensus approach. To eliminate this spurious sequence diversity, we discarded all low-abundance VDJ sequences (abundance < 20) that differed by only one nucleotide from a highly abundant VDJ sequence (abundance ≥ 20) with the same V-gene, J-gene, and CDR3-length.
Mutation Counting.
Mutation loads in Fig. 2 C and D were calculated by counting mismatches between an observed sequence and its corresponding germline sequence inferred by the Change-O software (encompassing both the V-segment and the J-segment, but masking the CDR3 region). Mutation loads in Fig. 4B were calculated by counting mutations reported in the IMGT/HighV-QUEST output (for the V-segment).
Statistical Tests.
All reported P values are from Wilcoxon–Mann–Whitney tests unless otherwise specified (with the exceptions being the PPMCC-based tests and the Mantel test). Tests are two-sided unless stated otherwise. Mantel tests were performed using the R-package “ape” (48), version 3.5.
Discussion
Immune senescence is thought to be a major cause of morbidity and mortality in the elderly. We have studied the effect of aging on the adaptive immune system by carrying out a phylogenetic analysis of the IGH repertoire. Our findings paint a picture in which antibody repertoires become increasingly specialized over a span of decades, presumably because of accumulating exposures to immune stimuli, while becoming less and less plastic, coming to be dominated in some cases by a few enormously expanded recall lineages undisturbed by the immunogenic challenge of a flu vaccine. Perhaps related to a phenomenon of overspecialization, both naive and antigen-experienced repertoires are found to exhibit age-related restriction of diversity. We detected various factors capable of causing difficulties in mounting new immune responses for elderly individuals. On the one hand, the naive repertoire was shrunk in comparison to the total repertoire, signifying a reduced substrate for mounting novel responses unaffected by original antigenic sin. On the other hand, within-lineage mutational diversification was reduced, perhaps due to a longer history of mutation fixation, impaired somatic hypermutation processes, and/or impaired clonal selection processes. Evidence for an altered process of somatic hypermutation is the appearance of premature stop codons at lower overall mutation loads in different IGH regions and at an increased frequency. Evidence for altered selection processes is a decreased incidence of radical mutations compared with conservative mutations, another indication that accumulating original antigenic sin may be limiting the accessible space of binding affinities.
Some of the changes observed in old age were also observed in chronic CMV infection (albeit to a lesser degree), supporting previous proposals that CMV causes premature immune aging, but other changes were unique to either aging or CMV infection. Although both CMV seropositivity and old age appeared to restrict the proportion of the naive sequences, only old age restricted the size of the antigen-experienced compartment. Furthermore, oligoclonality was only seen in old age, and was seen regardless of CMV status. On the other hand, only CMV increased the fraction of persistent lineages responding to flu vaccination. These results reinforce the importance of accounting for the potential presence of chronic infection when studying the effects of aging on the immune system, and suggest that such infections may have global effects on the structure of the immune system and even affect its response to unrelated challenges, such as vaccination.
Our study applied a phylogenetic distance metric (UniFrac) to antibody repertoires, adding a new instrument to the toolbox of computational immunologists. Antibody repertoire sequencing is a powerful tool for studying the development of adaptive immune responses. Studies such as ours typically generate on the order of 104 to 106 distinct high-fidelity antibody heavy-chain sequences per participant per visit. A method of quantifying similarity between these complex ensembles of sequences by exploiting the full phylogenetic information contained in the data had previously been lacking. UniFrac was found to be useful both as an exploratory visualization tool for whole repertoires and as a means of asking pointed questions. When applying UniFrac, it is important to consider technical issues, such as total read depth and subsampling, to normalize read depth between samples (SI Materials and Methods), but when such factors are controlled, one can obtain reliable results. By studying temporal dynamics of antibody repertoire evolution using UniFrac, we found that a person’s humoral immune system evolves noticeably over a period of weeks when challenged by an antigenic stimulus. Over a time span of decades, we were able to resolve the increasing divergence of different individuals’ immune systems, presumably because of stochasticity amplified by selection due to accumulating exposures to immune stimuli. One can envision larger cohort studies to test whether outcomes for vaccines, infections, or immune-related diseases could be predicted by comparing a person’s immune repertoire with reference individuals using UniFrac.
Materials and Methods
All materials and methods are discussed in detail in SI Materials and Methods. The Stanford Institutional Review Board approved protocols, and participants gave informed consent. The BCR repertoire sequencing process was a minor variation on a previously published protocol (11). Briefly, RT was carried out on 500 ng of total RNA from peripheral blood mononuclear cells using primers annealing to the IGH-constant region (Table S2); second-strand synthesis was carried out using IGH variable-region primers (Table S3). Constant-region and variable-region primers all contained eight random nucleotides to be used as molecule unique identifiers during analysis. Following Ampure purification (Beckman Coulter), double-stranded cDNA was PCR-amplified with primers containing Illumina adapters as well as sample multiplexing indexes. After sample pooling and gel purification, libraries were sequenced on the NextSeq platform (Illumina) with 150-bp paired-end reads. Reads were processed using the pRESTO suite (38), the IMGT/HighV-QUEST tool (39), the Change-O suite (40), and our own analysis scripts uploaded to https://github.com/cdebourcy/PNAS_immune_aging. More details on UniFrac computations are provided in SI Materials and Methods and Figs. S6 and S7. Raw sequencing data from this study are publicly accessible at National Center for Biotechnology Information BioProject (accession no. PRJNA356133).
Acknowledgments
We thank Sally Mackey for coordinating the clinical studies; Sue Swope and Michele Ugur for conducting study visits and collecting samples; Xiaosong He for providing access to samples; Holden Maecker, Jackie Bierre, and Ben Varasteh (Stanford Human Immune Monitoring Core) for sample banking; Norma Neff, Gary Mantalas, and Ben Passarelli (Stanford Stem Cell Genome Center) for assistance with sequencing and computational infrastructure; and Lolita Penland, Felix Horns, Lily Blair, John Beausang, and Daniel Fisher for discussions. This research was supported by NIH Grant U19 AI057229 (to M.M.D.). The clinical project was supported by NIH/National Center for Research Resources Clinical and Translational Science Award UL1 RR025744. The ClinicalTrials.gov numbers from the two studies from which samples were used are NCT 01827462 and NCT 02987374. C.F.A.d.B. was supported by an International Fulbright Science and Technology Award and a Melvin & Joan Lane Stanford Graduate Fellowship. C.J.L.A. was supported by the Paul and Daisy Soros Fellowship for New Americans, the Howard Hughes Medical Institute (HHMI) Medical Research Fellows Program, and Stanford's Medical Scientist Training and Medical Scholars Research Programs.
Footnotes
Conflict of interest statement: Dr. Quake and Dr. Knight were coauthors on Biteen JS, et al. (2015) Tools for the microbiome: Nano and beyond. ACS Nano 10(1):6–37. This was a perspective and did not involve any active research collaboration.
Data deposition: The sequence reported in this paper has been deposited in the National Center for Biotechnology Information BioProject (accession no. PRJNA356133).
This article contains supporting information online at www.pnas.org/lookup/suppl/doi:10.1073/pnas.1617959114/-/DCSupplemental.
References
- 1.Weiskopf D, Weinberger B, Grubeck-Loebenstein B. The aging of the immune system. Transpl Int. 2009;22(11):1041–1050. doi: 10.1111/j.1432-2277.2009.00927.x. [DOI] [PubMed] [Google Scholar]
- 2.Panda A, et al. Age-associated decrease in TLR function in primary human dendritic cells predicts influenza vaccine response. J Immunol. 2010;184(5):2518–2527. doi: 10.4049/jimmunol.0901022. [DOI] [PMC free article] [PubMed] [Google Scholar]
- 3.Yoshikawa TT. Epidemiology and unique aspects of aging and infectious diseases. Clin Infect Dis. 2000;30(6):931–933. doi: 10.1086/313792. [DOI] [PubMed] [Google Scholar]
- 4.Sambhara S, McElhaney JE. Immunosenescence and influenza vaccine efficacy. Curr Top Microbiol Immunol. 2009;333:413–429. doi: 10.1007/978-3-540-92165-3_20. [DOI] [PMC free article] [PubMed] [Google Scholar]
- 5.Govaert TM, et al. The efficacy of influenza vaccination in elderly individuals. A randomized double-blind placebo-controlled trial. JAMA. 1994;272(21):1661–1665. [PubMed] [Google Scholar]
- 6.Goodwin K, Viboud C, Simonsen L. Antibody response to influenza vaccination in the elderly: A quantitative review. Vaccine. 2006;24(8):1159–1169. doi: 10.1016/j.vaccine.2005.08.105. [DOI] [PubMed] [Google Scholar]
- 7.Murphy K, Travers P, Walport M, Janeway C. Janeway’s Immunobiology. Garland Science; New York: 2012. [Google Scholar]
- 8.Jiang N, et al. Lineage structure of the human antibody repertoire in response to influenza vaccination. Sci Transl Med. 2013;5(171):171ra19. doi: 10.1126/scitranslmed.3004794. [DOI] [PMC free article] [PubMed] [Google Scholar]
- 9.Georgiou G, et al. The promise and challenge of high-throughput sequencing of the antibody repertoire. Nat Biotechnol. 2014;32(2):158–168. doi: 10.1038/nbt.2782. [DOI] [PMC free article] [PubMed] [Google Scholar]
- 10.Wang C, et al. Effects of aging, cytomegalovirus infection, and EBV infection on human B cell repertoires. J Immunol. 2014;192(2):603–611. doi: 10.4049/jimmunol.1301384. [DOI] [PMC free article] [PubMed] [Google Scholar]
- 11.Vollmers C, Sit RV, Weinstein JA, Dekker CL, Quake SR. Genetic measurement of memory B-cell recall using antibody repertoire sequencing. Proc Natl Acad Sci USA. 2013;110(33):13463–13468. doi: 10.1073/pnas.1312146110. [DOI] [PMC free article] [PubMed] [Google Scholar]
- 12.Jackson KJ, et al. Human responses to influenza vaccination show seroconversion signatures and convergent antibody rearrangements. Cell Host Microbe. 2014;16(1):105–114. doi: 10.1016/j.chom.2014.05.013. [DOI] [PMC free article] [PubMed] [Google Scholar]
- 13.Wang C, et al. B-cell repertoire responses to varicella-zoster vaccination in human identical twins. Proc Natl Acad Sci USA. 2015;112(2):500–505. doi: 10.1073/pnas.1415875112. [DOI] [PMC free article] [PubMed] [Google Scholar]
- 14.Lozupone C, Knight R. UniFrac: A new phylogenetic method for comparing microbial communities. Appl Environ Microbiol. 2005;71(12):8228–8235. doi: 10.1128/AEM.71.12.8228-8235.2005. [DOI] [PMC free article] [PubMed] [Google Scholar]
- 15.Caruso C, Accardi G, Virruso C, Candore G. Sex, gender and immunosenescence: A key to understand the different lifespan between men and women? Immun Ageing. 2013;10(1):20–22. doi: 10.1186/1742-4933-10-20. [DOI] [PMC free article] [PubMed] [Google Scholar]
- 16.Martin AP. Phylogenetic approaches for describing and comparing the diversity of microbial communities. Appl Environ Microbiol. 2002;68(8):3673–3682. doi: 10.1128/AEM.68.8.3673-3682.2002. [DOI] [PMC free article] [PubMed] [Google Scholar]
- 17.Hughes JB, Hellmann JJ, Ricketts TH, Bohannan BJ. Counting the uncountable: statistical approaches to estimating microbial diversity. Appl Environ Microbiol. 2001;67(10):4399–4406. doi: 10.1128/AEM.67.10.4399-4406.2001. [DOI] [PMC free article] [PubMed] [Google Scholar]
- 18.Schloss PD, Larget BR, Handelsman J. Integration of microbial ecology and statistics: A test to compare gene libraries. Appl Environ Microbiol. 2004;70(9):5485–5492. doi: 10.1128/AEM.70.9.5485-5492.2004. [DOI] [PMC free article] [PubMed] [Google Scholar]
- 19.Singleton DR, Furlong MA, Rathbun SL, Whitman WB. Quantitative comparisons of 16S rRNA gene sequence libraries from environmental samples. Appl Environ Microbiol. 2001;67(9):4374–4376. doi: 10.1128/AEM.67.9.4374-4376.2001. [DOI] [PMC free article] [PubMed] [Google Scholar]
- 20.Lozupone CA, et al. The convergence of carbohydrate active gene repertoires in human gut microbes. Proc Natl Acad Sci USA. 2008;105(39):15076–15081. doi: 10.1073/pnas.0807339105. [DOI] [PMC free article] [PubMed] [Google Scholar]
- 21.Chao A. Nonparametric estimation of the number of classes in a population. Scand J Stat. 1984;11(4):265–270. [Google Scholar]
- 22.Chao A, Shen T-J, Hwang W-H. Application of LaPlace’s boundary-mode approximations to estimate species and shared species richness. Aust N Z J Stat. 2006;48(2):117–128. [Google Scholar]
- 23.Gibson KL, et al. B-cell diversity decreases in old age and is correlated with poor health status. Aging Cell. 2009;8(1):18–25. doi: 10.1111/j.1474-9726.2008.00443.x. [DOI] [PMC free article] [PubMed] [Google Scholar]
- 24.Thakar J, et al. Aging-dependent alterations in gene expression and a mitochondrial signature of responsiveness to human influenza vaccination. Aging (Albany NY) 2015;7(1):38–52. doi: 10.18632/aging.100720. [DOI] [PMC free article] [PubMed] [Google Scholar]
- 25.Henn AD, et al. High-resolution temporal response patterns to influenza vaccine reveal a distinct human plasma cell gene signature. Sci Rep. 2013;3:2327. doi: 10.1038/srep02327. [DOI] [PMC free article] [PubMed] [Google Scholar]
- 26.Müller C, Siemer D, Lehnerdt G, Lang S, Küppers R. Molecular analysis of IgD-positive human germinal centres. Int Immunol. 2010;22(4):289–298. doi: 10.1093/intimm/dxq007. [DOI] [PubMed] [Google Scholar]
- 27.Shi Y, et al. Regulation of aged humoral immune defense against pneumococcal bacteria by IgM memory B cell. J Immunol. 2005;175(5):3262–7. doi: 10.4049/jimmunol.175.5.3262. [DOI] [PubMed] [Google Scholar]
- 28.Takizawa M, Sugane K, Agematsu K. Role of tonsillar IgD+CD27+ memory B cells in humoral immunity against pneumococcal infection. Hum Immunol. 2006;67(12):966–975. doi: 10.1016/j.humimm.2006.10.008. [DOI] [PubMed] [Google Scholar]
- 29.Xu JL, Davis MM. Diversity in the CDR3 region of V(H) is sufficient for most antibody specificities. Immunity. 2000;13(1):37–45. doi: 10.1016/s1074-7613(00)00006-6. [DOI] [PubMed] [Google Scholar]
- 30.Koelsch K, et al. Mature B cells class switched to IgD are autoreactive in healthy individuals. J Clin Invest. 2007;117(6):1558–1565. doi: 10.1172/JCI27628. [DOI] [PMC free article] [PubMed] [Google Scholar]
- 31.Geisberger R, Lamers M, Achatz G. The riddle of the dual expression of IgM and IgD. Immunology. 2006;118(4):429–437. doi: 10.1111/j.1365-2567.2006.02386.x. [DOI] [PMC free article] [PubMed] [Google Scholar]
- 32.Herzenberg LA, Black SJ, Tokuhisa T, Herzenberg LA. Memory B cells at successive stages of differentiation. Affinity maturation and the role of IgD receptors. J Exp Med. 1980;151(5):1071–1087. doi: 10.1084/jem.151.5.1071. [DOI] [PMC free article] [PubMed] [Google Scholar]
- 33.Lladser ME, Gouet R, Reeder J. Extrapolation of urn models via poissonization: Accurate measurements of the microbial unknown. PLoS One. 2011;6(6):e21105. doi: 10.1371/journal.pone.0021105. [DOI] [PMC free article] [PubMed] [Google Scholar]
- 34.Sauce D, et al. Evidence of premature immune aging in patients thymectomized during early childhood. J Clin Invest. 2009;119(10):3070–3078. doi: 10.1172/JCI39269. [DOI] [PMC free article] [PubMed] [Google Scholar]
- 35.Pawelec G, Derhovanessian E. Role of CMV in immune senescence. Virus Res. 2011;157(2):175–179. doi: 10.1016/j.virusres.2010.09.010. [DOI] [PubMed] [Google Scholar]
- 36.Furman D, et al. Cytomegalovirus infection improves immune responses to influenza. Sci Transl Med. 2015;7(281):281ra43. doi: 10.1126/scitranslmed.aaa2293. [DOI] [PMC free article] [PubMed] [Google Scholar]
- 37.Pommié C, Levadoux S, Sabatier R, Lefranc G, Lefranc MP. IMGT standardized criteria for statistical analysis of immunoglobulin V-REGION amino acid properties. J Mol Recognit. 2004;17(1):17–32. doi: 10.1002/jmr.647. [DOI] [PubMed] [Google Scholar]
- 38.Vander Heiden JA, et al. pRESTO: A toolkit for processing high-throughput sequencing raw reads of lymphocyte receptor repertoires. Bioinformatics. 2014;30(13):1930–1932. doi: 10.1093/bioinformatics/btu138. [DOI] [PMC free article] [PubMed] [Google Scholar]
- 39.Alamyar E, Giudicelli V, Li S, Duroux P, Lefranc M-P. IMGT/HighV-QUEST: The IMGT web portal for immunoglobulin (IG) or antibody and T cell receptor (TR) analysis from NGS high throughput and deep sequencing. Immunome Res. 2012;8(1):26–40. [Google Scholar]
- 40.Gupta NT, et al. Change-O: A toolkit for analyzing large-scale B cell immunoglobulin repertoire sequencing data. Bioinformatics. 2015;31(20):3356–3358. doi: 10.1093/bioinformatics/btv359. [DOI] [PMC free article] [PubMed] [Google Scholar]
- 41.Köster J, Rahmann S. Snakemake--a scalable bioinformatics workflow engine. Bioinformatics. 2012;28(19):2520–2522. doi: 10.1093/bioinformatics/bts480. [DOI] [PubMed] [Google Scholar]
- 42.Gadala-Maria D, Yaari G, Uduman M, Kleinstein SH. Automated analysis of high-throughput B-cell sequencing data reveals a high frequency of novel immunoglobulin V gene segment alleles. Proc Natl Acad Sci USA. 2015;112(8):E862–E870. doi: 10.1073/pnas.1417683112. [DOI] [PMC free article] [PubMed] [Google Scholar]
- 43.Schliep KP. phangorn: Phylogenetic analysis in R. Bioinformatics. 2011;27(4):592–593. doi: 10.1093/bioinformatics/btq706. [DOI] [PMC free article] [PubMed] [Google Scholar]
- 44.Yaari G, et al. Models of somatic hypermutation targeting and substitution based on synonymous mutations from high-throughput immunoglobulin sequencing data. Front Immunol. 2013;4:358. doi: 10.3389/fimmu.2013.00358. [DOI] [PMC free article] [PubMed] [Google Scholar]
- 45.Lozupone CA, Hamady M, Kelley ST, Knight R. Quantitative and qualitative beta diversity measures lead to different insights into factors that structure microbial communities. Appl Environ Microbiol. 2007;73(5):1576–1585. doi: 10.1128/AEM.01996-06. [DOI] [PMC free article] [PubMed] [Google Scholar]
- 46.Chen J, et al. Associating microbiome composition with environmental covariates using generalized UniFrac distances. Bioinformatics. 2012;28(16):2106–2113. doi: 10.1093/bioinformatics/bts342. [DOI] [PMC free article] [PubMed] [Google Scholar]
- 47.van der Loo MP. The stringdist package for approximate string matching. R Journal. 2014;6(1):111–122. [Google Scholar]
- 48.Paradis E, Claude J, Strimmer K. APE: Analyses of phylogenetics and evolution in R language. Bioinformatics. 2004;20(2):289–290. doi: 10.1093/bioinformatics/btg412. [DOI] [PubMed] [Google Scholar]
- 49.Caporaso JG, et al. QIIME allows analysis of high-throughput community sequencing data. Nat Methods. 2010;7(5):335–336. doi: 10.1038/nmeth.f.303. [DOI] [PMC free article] [PubMed] [Google Scholar]
- 50.Yu G, Smith DK, Zhu H, Guan Y, Lam TT-Y. ggtree: An R package for visualization and annotation of phylogenetic trees with their covariates and other associated data. Methods Ecol Evol. 2016 doi: 10.1111/2041-210X.12628. [DOI] [Google Scholar]


