Significance
The translational GTPase LepA is a highly conserved bacterial protein whose role in the cell has been elusive. Here, we show that the function of LepA lies in biogenesis of the 30S subunit of the ribosome, rather than in translation elongation, as previously supposed. Loss of LepA results in the accumulation of immature 30S particles lacking certain proteins of the 3′ (head) domain and containing precursor 17S rRNA. The GTPase activity of LepA, like that of other translational GTPases, is stimulated by interactions with both subunits of the ribosome. This implies that LepA acts at a late stage of assembly, in the context of the 70S ribosome.
Keywords: protein synthesis, translation, EF4, YjeQ, RsgA
Abstract
The physiological role of LepA, a paralog of EF-G found in all bacteria, has been a mystery for decades. Here, we show that LepA functions in ribosome biogenesis. In cells lacking LepA, immature 30S particles accumulate. Four proteins are specifically underrepresented in these particles—S3, S10, S14, and S21—all of which bind late in the assembly process and contribute to the folding of the 3′ domain of 16S rRNA. Processing of 16S rRNA is also delayed in the mutant strain, as indicated by increased levels of precursor 17S rRNA in assembly intermediates. Mutation ΔlepA confers a synthetic growth phenotype in absence of RsgA, another GTPase, well known to act in 30S subunit assembly. Analysis of the ΔrsgA strain reveals accumulation of intermediates that resemble those seen in the absence of LepA. These data suggest that RsgA and LepA play partially redundant roles to ensure efficient 30S assembly.
Nine distinct GTPases that represent or resemble translation factors are found in bacteria (1). These translational GTPases (trGTPases) include IF2; EF-Tu and similar proteins SelB and CysN/NodQ; and EF-G and similar proteins RF3, TetM, BipA, and LepA. Four of these trGTPases are omnipresent in bacterial lineages—IF2, EF-Tu, EF-G, and LepA (1). Despite such high conservation, the gene encoding LepA can be deleted with no obvious phenotype in Escherichia coli (2).
In 2006, it was reported that LepA catalyzes “back-translocation,” movement of tRNA–mRNA in the reverse direction (3). However, we and others have been unable to confirm this activity (4–6). Using toeprinting, we measured the rate of spontaneous reverse translocation in many contexts and found no evidence that LepA can speed the reaction (4). Cooperman and coworkers more thoroughly investigated the effects of LepA on tRNA–mRNA movement, using puromycin (which reacts with P-site peptidyl-tRNA) and fluorescent probes on tRNA and mRNA (5). They found that, when added to the posttranslocation complex, LepA promotes some tRNA movement in the complex, which lessens the puromycin reactivity of peptidyl-tRNA by ∼10-fold. This is followed by a slow (0.05 min−1) larger scale movement of tRNA–mRNA, yielding the puromycin-unreactive pretranslocation complex. The rate of this latter step, which presumably entails codon–anticodon movement, is virtually identical to the rate of spontaneous reverse translocation, measured in parallel (5). These data are in line with our toeprinting results (4) and provide no support for the idea that LepA acts as a “back-translocase” in the cell, as originally posited (3).
In subsequent work, we used ribosome profiling to probe the effects of LepA on translation in E. coli (4). We found that loss of LepA alters the average ribosome density (ARD) on more than 500 mRNA coding regions. In principle, changes in ARD could arise from effects on initiation or elongation. However, several lines of evidence suggest that LepA has little-to-no impact on elongation in vivo. First, ribosome distribution along mRNAs is virtually indistinguishable in the presence and absence of LepA (4). Second, direct measurements of translation elongation using a pulse-chase method showed that LepA has no effect on the rate (4). Third, the frequencies of miscoding, spontaneous +1 and –1 frame-shifting, and programmed +1 frame-shifting are indistinguishable in wild-type and ∆lepA cells (7). Thus, the simplest interpretation of the ribosome profiling data is that LepA contributes primarily to the initiation phase of translation in the cell. Consistent with this interpretation, the effect of LepA on ARD is related to the sequence of the Shine–Dalgarno region (4).
How might LepA influence translation initiation in the cell? One possibility is that LepA acts like an initiation factor to facilitate one or more steps of the initiation process. Another possibility is that LepA influences initiation less directly. For example, LepA may normally function in ribosome assembly, and misassembled subunits formed in its absence are responsible for the altered translation initiation rates observed. In this study, we test this latter hypothesis and find that, indeed, LepA functions in ribosome biogenesis.
Results
Small Subunit (SSU) Particles Lacking S3, S10, S14, and S21 Accumulate in the Absence of LepA.
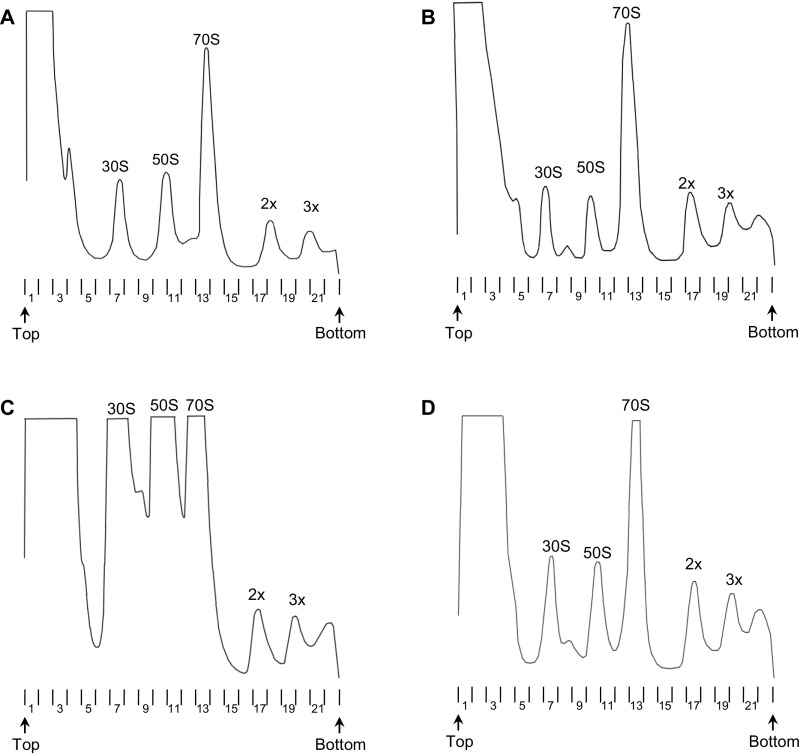
To investigate the role of LepA in ribosome assembly, a SILAC-based approach was used. An E. coli Arg−Lys− auxotroph was made and used to create isogenic control (WT), mutant (M, ∆lepA), and complemented (C, ∆lepA/lepA+) strains. These WT, M, and C strains were grown to midlogarithmic phase in minimal M9 media supplemented with lysine and arginine of light, medium, or heavy mass, respectively. Cells were chilled quickly, pelleted, and lysed. Each lysate was clarified and subjected to sucrose gradient sedimentation to resolve the various ribosomal particles and/or complexes (Fig. S1). Twenty-two fractions were collected from each gradient, and equivalent fractions were then combined. Proteins of these combined samples were analyzed by analytical mass spectroscopy, yielding isotope ratios (e.g., M/WT, C/WT) for the ribosomal proteins (r proteins) in the various fractions. Raw isotope ratios from each sample for S2–S21 and L1–L35 proteins were normalized with respect to the median value among all small or large subunit (SSU or LSU) proteins, respectively. This enabled the relative abundance of a given r protein to be compared from fraction to fraction and from experiment to experiment.
Fig. S1.
Fractionation of cell lysates by sucrose gradient sedimentation. Representative A254 traces of sucrose gradients from mutant ΔlepA (A), complemented ΔlepA (pLEPA) (B), mutant ΔrsgA (C), and complemented ΔrsgA (pRSGA) (D) strains. Peaks corresponding to subunits (30S, 50S), monosomes (70S), and polysomes (2×, 3×) are indicated. Arrows denote the top and bottom of the gradient; note, polysomes > 3× are pelleted under the conditions used. Numbers listed below the traces correspond to the fraction numbers discussed throughout the article.
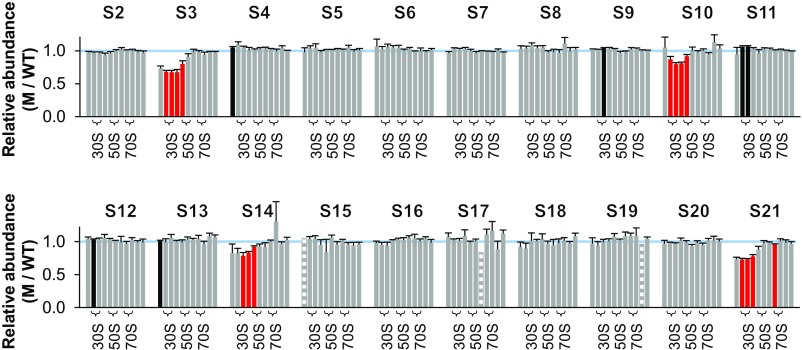
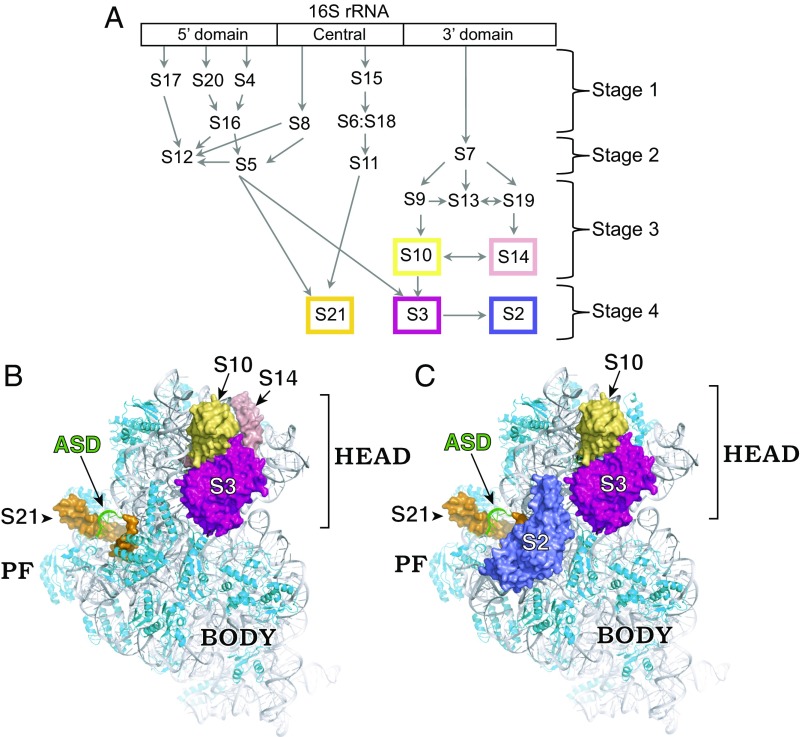
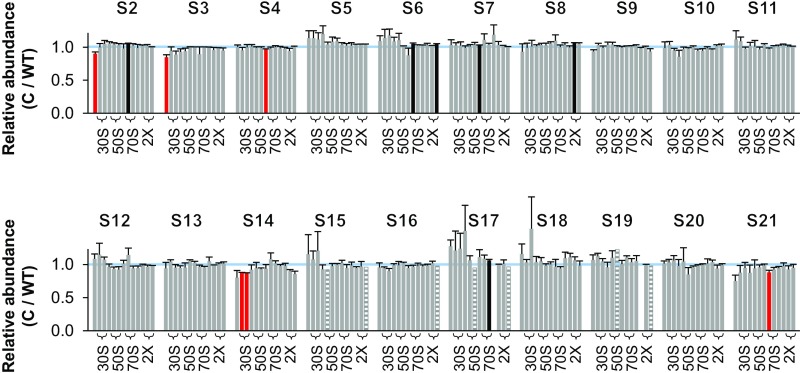
Normalized M/WT ratios determined from five independent experiments are shown in Fig. 1. Student’s t test was used to assess apparent deviations from 1.0, with data in red bars scored as <1.0 and in black bars scored as >1.0 (uncorrected P < 0.05). In the mutant strain, four proteins—S3, S10, S14, and S21—were found to be underrepresented in the 30S region of the gradient. In each case, multiple consecutive fractions had significantly reduced protein levels (by ∼30% for S3 and S21; ∼20% for S10 and S14). These proteins assemble at a late stage of SSU biogenesis and are involved in the folding of the 3′ major and minor domains of 16S rRNA (Fig. 2). Seven other M/WT ratios scored as ≠1.0 but were distributed rather disparately among the fractions and hence presumably represent statistical “false-positives.” One possible exception involves S11, scored as overrepresented in fractions 7 and 8 (corresponding to the 30S peak), although the degree of overrepresentation in these cases is small.
Fig. 1.
Ribosomal protein composition of SSU particles in the mutant ΔlepA strain. Shown are normalized isotope ratios (mutant versus wild type; M/WT), indicating the relative abundance of each protein (as indicated) in SSU particles contained in fractions 6–16 of the sucrose gradient. Fractions 7–8, 10–11, and 13–14 encompass the 30S, 50S, and 70S peaks, respectively (as indicated with braces). Fractions at the top of the gradient yielded no data above the confidence threshold on r proteins other than S1, presumably because only small amounts of these proteins exist in the free form. Five independent experiments were performed, and the data represent the mean ± SEM. Red and black bars indicate values deemed <1.0 and >1.0, respectively, based on Student’s t test (uncorrected P < 0.05). Striped bars denote cases where only one measurement was obtained. The blue line marks 1.0.
Fig. 2.
Structurally similar SSU particles accumulate in the absence of either LepA or RsgA. (A) An assembly map of the 30S subunit, based on ref. 17. The 5′, central, and 3′ domains of 16S rRNA correspond to the body, platform, and head domains of the subunit, respectively. Stages of assembly (as indicated) have been inferred from the relative abundances of proteins in pre-30S particles from well-resolved sucrose gradient fractions (17). Boxes point out proteins underrepresented in 30S particles in the absence of LepA and/or RsgA. (B) Model of the 30S subunit highlighting S3 (magenta), S10 (yellow), S14 (pink), and S21 (orange), which are missing from some SSU particles in the ∆lepA mutant. (C) Model of the 30S subunit highlighting S2 (slate), S3 (magenta), S10 (yellow), and S21 (orange), which are missing from some SSU particles in the ∆rsgA mutant. Boxes in A are color-coded to match the relevant proteins in B and C. The ASD sequence is shown in green, the remainder of 16S rRNA is shown in gray, and other r proteins are shown in cyan. This figure was generated using Protein Data Bank (PDB) ID code 5AFI (52). PF, platform.
Fractions corresponding to the 70S ribosomes and disomes showed normal representation of all SSU proteins in the mutant strain (Fig. 1). The large 70S peak of these gradients includes translating monosomes as well as ribosomes that finish translation before cell lysis (8–10). Bearing this in mind, we infer that SSU particles lacking S3, S10, S14, and S21 accumulate in the ∆lepA mutant but do not efficiently enter the actively translating pool of ribosomes.
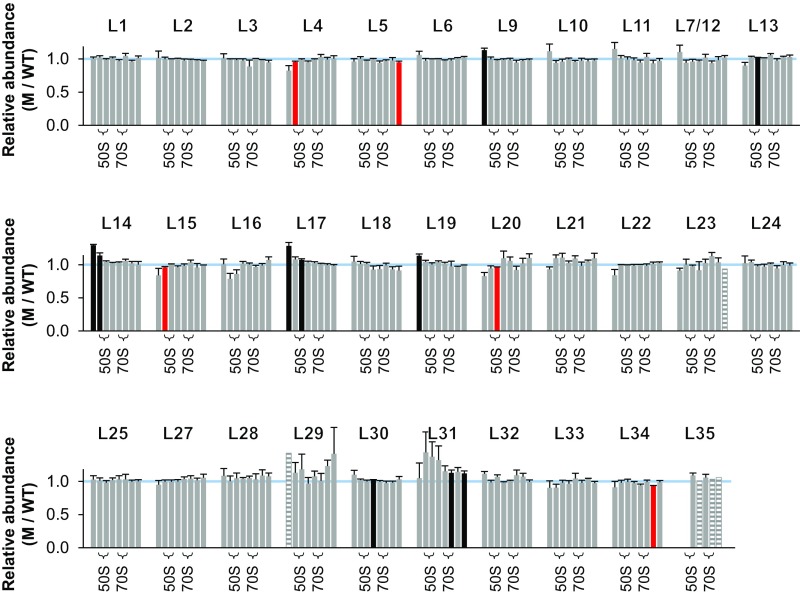
Normalized M/WT ratios for L1–L35 provided virtually no evidence that LepA contributes to assembly of the LSU (Fig. S2). Protein levels in fractions 9–16—spanning the pre-50S, 50S, and 70S regions of the gradient—were equivalent in the mutant and control cases. Fifteen of 253 values scored as ≠1.0 (uncorrected P < 0.05), on par with the number expected by chance alone, and these appear to be randomly distributed (with one exception—L14, fractions 9–10). These data suggest that the role of LepA in ribosome assembly is confined to the SSU.
Fig. S2.
Ribosomal protein composition of LSU particles in the mutant ΔlepA strain. Shown are normalized isotope ratios (mutant versus wild type; M/WT), indicating the relative abundance of each protein (as indicated) in LSU particles contained in fractions 9–16 of the sucrose gradient. Fractions 10–11 and 13–14 encompass the 50S and 70S peaks, respectively (as indicated with braces). Five independent experiments were performed, and the data represent the mean ± SEM. Red and black bars indicate values deemed <1.0 and >1.0, respectively, based on Student’s t test (uncorrected P < 0.05). Striped bars denote cases where only one measurement was obtained. The blue line marks 1.0.
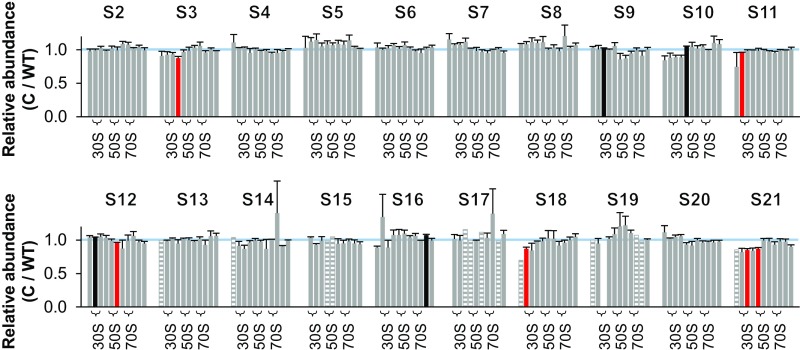
Next, we analyzed the C/WT ratios, to assess whether expression of LepA from a plasmid could rescue the apparent defect in SSU assembly seen in the mutant strain. Indeed, plasmid-encoded LepA increased representation of S3, S10, S14, and S21 in the SSU fractions to near stoichiometric levels (Fig. S3). These data confirm that loss of LepA is responsible for the assembly defect.
Fig. S3.
Ribosomal protein composition of SSU particles in the complemented ΔlepA/lepA+ strain. Shown are normalized isotope ratios (complemented versus wild type; C/WT), indicating the relative abundance of each protein (as indicated) in SSU particles contained in fractions 6–16 of the sucrose gradient. Fractions 7–8, 10–11, and 13–14 encompass the 30S, 50S, and 70S peaks, respectively (as indicated with braces). Three independent experiments were performed, and the data represent the mean ± SEM. Red and black bars indicate values deemed <1.0 and >1.0, respectively, based on Student’s t test (uncorrected P < 0.05). Striped bars denote cases where only one measurement was obtained. The blue line marks 1.0.
Mutation ∆lepA Confers a Synthetic Growth Defect in the Absence of RsgA.
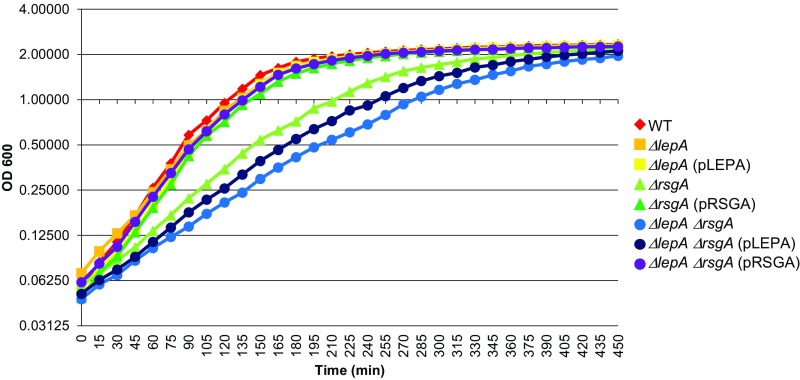
In earlier work, we moved the ∆lepA mutation via Hfr-mediated conjugation into each strain of the Keio collection (11) and screened for negative or positive genetic interactions (4). Nine strains were identified in which ∆lepA confers a synthetic growth defect. One of these strains lacks RsgA, a conserved GTPase known to be involved in SSU biogenesis (12–14). One of us (M.C.) pointed out that the doubling times reported for the “∆rsgA” strains in Balakrishnan et al. (2014) (4) are considerably smaller than would be expected based on previous studies (12, 15). Looking into this, we found that the strain stocks used to generate the data of row 4 of table 1 of Balakrishnan et al. (2014) (4) contain the rsgA gene and thus are incorrect. How this mistake occurred remains unclear. We made a new a set of ∆rsgA strains, verified their genotypes, and measured their growth rates (Fig. S4 and Table 1). In line with the earlier studies (12, 15), mutation ∆rsgA slowed the growth of E. coli substantially, increasing the doubling time by 18 min. This growth defect was rescued by plasmid pRSGA, which contains the rsgA gene and its native promoter region, confirming that loss of RsgA is responsible for the phenotype. On its own, mutation ∆lepA had virtually no effect on growth rate. However, ∆lepA strongly exacerbated the phenotype of the ∆rsgA strain, increasing the doubling time from 43 to 58 min. Plasmid pLEPA largely complemented this synthetic phenotype, reducing the doubling time to 49 min. These data confirm that loss of LepA confers a synthetic phenotype in the absence of RsgA.
Fig. S4.
Mutation ΔlepA confers a synthetic growth defect in the absence of RsgA. Representative growth curves of strains (as indicated) are shown. Strains were grown in LB media at 37 °C, and turbidity of the culture (OD600) was monitored as a function of time.
Table 1.
Mutation ∆lepA confers a synthetic growth defect in the absence of RsgA
| Chromosomal mutation(s)* | Plasmid† | Doubling time, min |
| Wild-type | Empty vector | 25.8 ± 0.5 |
| ∆rsgA | Empty vector | 43.4 ± 0.7 |
| ∆rsgA | pRSGA | 27.1 ± 0.2 |
| ∆lepA | Empty vector | 28.7 ± 0.9 |
| ∆lepA | pLEPA | 27.5 ± 0.6 |
| ∆rsgA ∆lepA | Empty vector | 58.3 ± 0.6 |
| ∆rsgA ∆lepA | pRSGA | 27.4 ± 0.2 |
| ∆rsgA ∆lepA | pLEPA | 49.3 ± 0.4 |
Reported values represent the mean ± SEM for ≥3 independent experiments.
Deletion mutations originated from the Keio collection (11). In the single mutants, the kanamycin resistance marker (kan) was removed via FLP-mediated excision, leaving an in-frame 34-codon “scar” sequence. In the double mutants, the ∆lepA allele remains marked with kan. Wild type, the parental strain BW25113 [F-, λ−, Δ(araD-araB)567, ΔlacZ4787::rrnB-3, Δ(rhaD-rhaB)568, rph-1, hsdR514].
Vector pWSK29 is a low copy number replicon that confers ampicillin resistance. Plasmid pLEPA is pWSK29 containing the lepA gene; pRSGA is pWSK29 containing the rsgA gene.
SSU Particles Lacking S2, S3, S10, and S21 Accumulate in the Absence of RsgA.
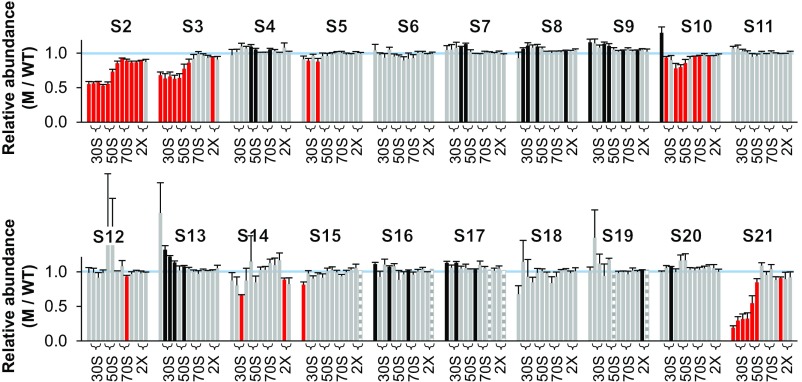
To better understand the genetic link between lepA and rsgA, we used the same approach to evaluate the role of RsgA on ribosome assembly. Three proteins—S2, S3, and S21—were substantially underrepresented in 30S and pre-30S particles of the mutant, with levels of S21 particularly low (Figs. 2C and 3). These data are consistent with the concurrent work of Ortega and coworkers (16). For S3 and S21, the M/WT ratio increased to 1.0 in later fractions, corresponding to 70S and disome peaks, whereas the M/WT ratio for S2 increased from 0.5 to 0.9 between 50S and 70S fractions but remained less than 1.0 across the whole gradient. We infer that SSU particles lacking S2, S3, and/or S21 accumulate in the mutant, and some SSU particles missing only S2 can enter the actively translating pool of ribosomes. Ribosomal protein S10 also appeared to be underrepresented in various fractions of the gradient, albeit to a lesser degree than S2, S3, and S21. Evidence for slight overrepresentation of S13 in 30S fractions was also seen. Based on the number and magnitude of the changes observed, we conclude that ∆rsgA is more deleterious to SSU assembly than ∆lepA, in line with the effects of the mutations on growth.
Fig. 3.
Ribosomal protein composition of SSU particles in the mutant ΔrsgA strain. Shown are normalized isotope ratios (mutant versus wild type; M/WT), indicating the relative abundance of each protein (as indicated) in SSU particles contained in fractions 6–18 of the sucrose gradient. Fractions 7–8, 10–11, 13–14, and 17–18 encompass the 30S, 50S, 70S, and disome (2×) peaks, respectively (as indicated with braces). Six independent experiments were performed, and the data represent the mean ± SEM. Red and black bars indicate values deemed <1.0 and >1.0, respectively, based on Student’s t test (uncorrected P < 0.05). Striped bars denote cases where only one measurement was obtained. The blue line marks 1.0.
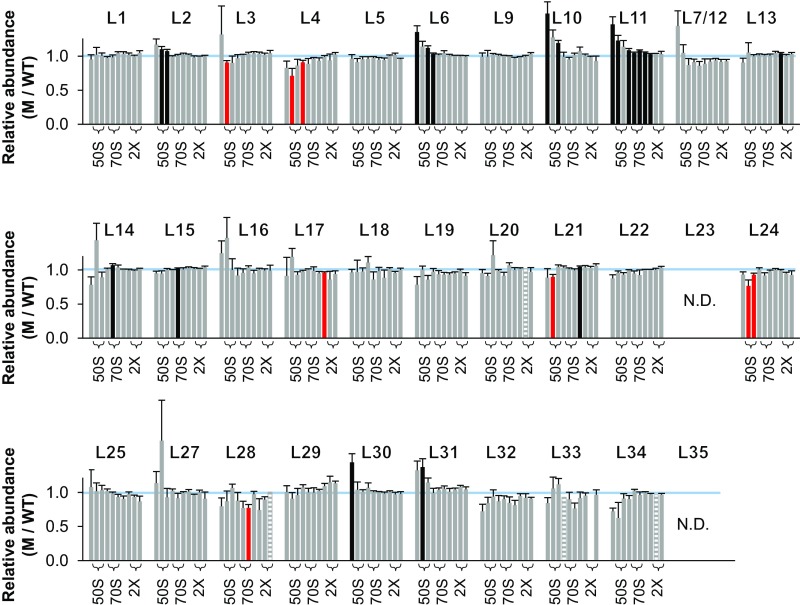
We next analyzed M/WT ratios for L1–L35 to assess whether assembly of the LSU was compromised in the ∆rsgA mutant (Fig. S5). Protein L11 scored as significantly overrepresented in multiple sequential fractions, L2 and L6 were each overrepresented in two sequential 50S fractions, and L24 scored as significantly underrepresented in two sequential 50S fractions. However, the magnitude of these effects is in all cases small. These data suggest that biogenesis of the LSU is impacted by ∆rsgA, albeit to a much lesser degree than that of the SSU.
Fig. S5.
Ribosomal protein composition of LSU particles in the mutant ΔrsgA strain. Shown are normalized isotope ratios (mutant versus wild type; M/WT), indicating the relative abundance of each protein (as indicated) in LSU particles contained in fractions 9–18 of the sucrose gradient. Fractions 10–11, 13–14, and 17–18 encompass the 50S, 70S, and disome (2×) peaks, respectively (as indicated with braces). Six independent experiments were performed, and the data represent the mean ± SEM. Red and black bars indicate values deemed <1.0 and >1.0, respectively, based on Student’s t test (uncorrected P < 0.05). Striped bars denote cases where only one measurement was obtained. The blue line marks 1.0. N.D., not determined.
Analysis of C/WT ratios across the gradient fractions revealed that plasmid-encoded RsgA restores proportional representation of all of the r proteins (Fig. S6), consistent with the ability of pRSGA to complement the growth defect conferred by ∆rsgA (Table 1).
Fig. S6.
Ribosomal protein composition of SSU particles in the complemented ΔrsgA/rsgA+ strain. Shown are normalized isotope ratios (complemented versus wild type; C/WT), indicating the relative abundance of each protein (as indicated) in SSU particles contained in fractions 6–18 of the sucrose gradient. Fractions 7–8, 10–11, 13–14, and 17–18 encompass the 30S, 50S, 70S, and disome (2×) peaks, respectively (as indicated with braces). Four independent experiments were performed, and the data represent the mean ± SEM. Red and black bars indicate values deemed <1.0 and >1.0, respectively, based on Student’s t test (uncorrected P < 0.05). Striped bars denote cases where only one measurement was obtained. The blue line marks 1.0.
Precursor 17S rRNA Accumulates in Pre-30S and 30S Particles in the Absence of LepA.
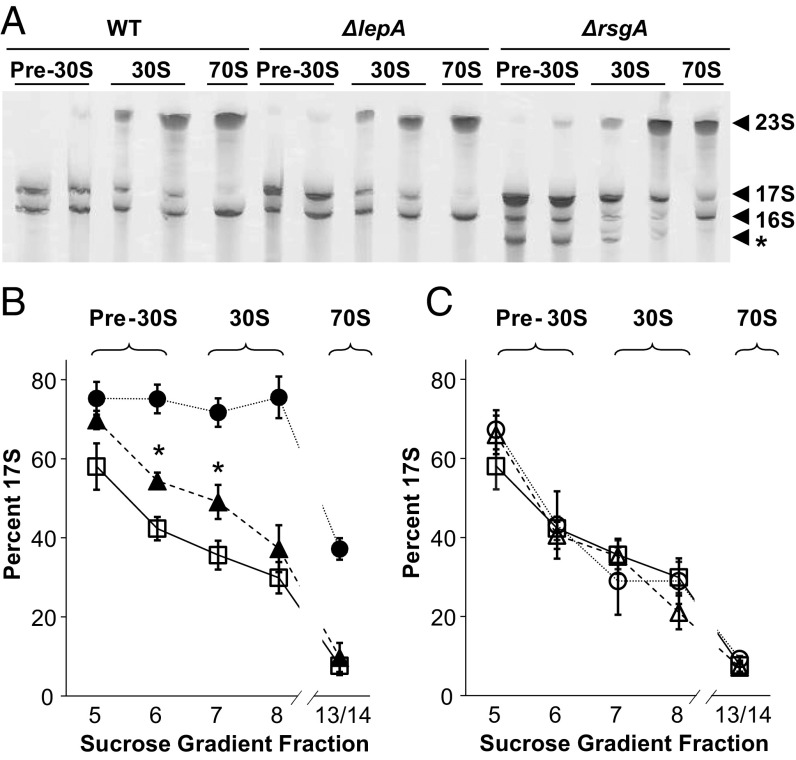
We next compared the proportion of precursor 17S and mature 16S rRNA in gradient fractions from WT, ∆lepA, and ∆rsgA strains (Fig. 4 and Table S1). In the WT strain, the percentage of 17S rRNA observed in pre-30S fraction 5 was substantial (∼60%) and decreased in heavier fractions, reaching ∼8% in the 70S region (combined 13–14 fractions). This pattern is in line with previous studies by Williamson and coworkers (17). They have shown, by quantifying relative protein abundances, that progressive intermediates of assembly reside in the gradient fractions preceding those of the corresponding mature subunits. Higher levels of 17S rRNA were seen for the ∆rsgA strain (Fig. 4), as expected from earlier work (15, 18). The percentage of 17S was near 75% throughout the pre-30S and 30S regions of the gradient and decreased to ∼40% in the 70S fractions. In addition, a shorter RNA, presumably identical to the truncated SSU rRNA reported previously (14), was observed in several gradient fractions from the ∆rsgA strain (Fig. 4). Levels of 17S rRNA in the ∆lepA mutant were also significantly higher than in the WT strain, although not as high as in the ∆rsgA strain. Precursor 17S accounted for half or more of the SSU rRNA in fractions 6–7 from the ∆lepA mutant, levels 30–40% higher than the WT (Fig. 4 and Table S1). Plasmids pRSGA and pLEPA restored wild-type levels of 16S rRNA in the ∆rsgA and ∆lepA strain, respectively (Fig. 4C), confirming that RsgA and LepA are each needed for normal SSU rRNA processing. Plasmid pRB34, which encodes the GTPase-deficient protein LepA(H81A) (4, 19), failed to complement the ∆lepA strain (Table S1). This is consistent with the inability of LepA(H81A) to rescue other phenotypes of the ∆lepA strain (4) and indicates that the GTPase activity of LepA is crucial for its role in ribosome biogenesis.
Fig. 4.
Loss of LepA leads to elevated levels of 17S precursor rRNA. (A) Representative PAGE experiment in which rRNA was extracted from sucrose gradient fractions corresponding to pre-30S, 30S, and 70S particles of control (WT), ΔlepA, and ΔrsgA cells (as indicated) and resolved. Fractions 13 and 14 (containing the 70S peak) were combined before extraction. Arrowheads denote bands corresponding to precursor (17S) and mature (16S, 23S) rRNAs. The band marked by an asterisk corresponds to the truncated SSU rRNA observed previously in the ΔrsgA strain. (B and C) The relative amount of 16S versus 17S rRNA in each lane was quantified to determine percent 17S, which is plotted for each strain as a function of gradient fraction number [open square, WT; filled triangle, ΔlepA; filled circle, ΔrsgA; open triangle, ΔlepA (pLEPA); open circle, ΔrsgA (pRSGA)]. Data represents the mean ± SEM of ≥3 independent experiments. Asterisks in B denote significant differences (P = 0.01 and P = 0.04) between ΔlepA and WT.
Table S1.
Amount of precursor 17S rRNA in various ribosomal fractions of the strains analyzed
| Strain name | Description* | Sucrose gradient fraction | ||||
| No. 5, pre-30S | No. 6, pre-30S | No. 7, 30S | No. 8, 30S | Nos. 13/14, 70S | ||
| MRG03 | WT | 58.0 ± 5.9 (n = 4) | 42.3 ± 2.9 (n = 5) | 35.6 ± 3.6 (n = 5) | 29.9 ± 3.9 (n = 5) | 7.6 ± 2.4 (n = 5) |
| MRG07 | ∆rsgA | 75.3 ± 4.1 (n = 3) | 75.1 ± 3.6 (n = 3) | 71.7 ± 3.6 (n = 3) | 75.5 ± 5.2 (n = 3) | 37.2 ± 2.7 (n = 3) |
| MRG08 | ∆rsgA (pRGSA) | 67.2 ± 4.9 (n = 3) | 43.1 ± 8.5 (n = 3) | 28.9 ± 8.5 (n = 3) | 28.9 ± 5.7 (n = 3) | 9.3 ± 0.5 (n = 3) |
| MRG04 | ∆lepA | 69.8 ± 2.3 (n = 5) | 54.4 ± 2.1 (n = 5) | 49.1 ± 4.3 (n = 5) | 37.2 ± 5.9 (n = 5) | 9.7 ± 3.6 (n = 5) |
| MRG05 | ∆lepA (pLEPA) | 65.9 ± 4.8 (n = 6) | 40.5 ± 3.4 (n = 6) | 35.2 ± 4.4 (n = 6) | 21.0 ± 4.3 (n = 6) | 7.2 ± 1.1 (n = 6) |
| MRG102 | ∆lepA (pRB34) | 73.9 ± 1.3 (n = 3) | 56.1 ± 0.7 (n = 3) | 43.8 ± 2.6 (n = 3) | 35.7 ± 2.8 (n = 3) | 10.1 ± 0.7 (n = 3) |
Data correspond to percent of total SSU rRNA (mean ± SEM), with the number of independent replicas (n) indicated.
All strains are isogenic and carry either the plasmid indicated or the empty vector.
Rates of r Protein and Assembly Factor Production Are Similar in the Presence and Absence of LepA.
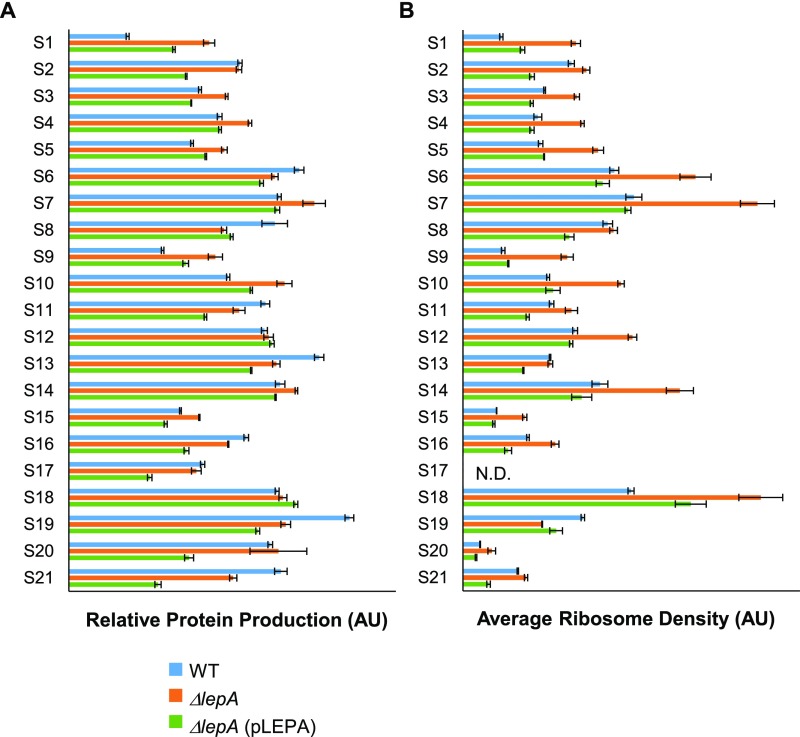
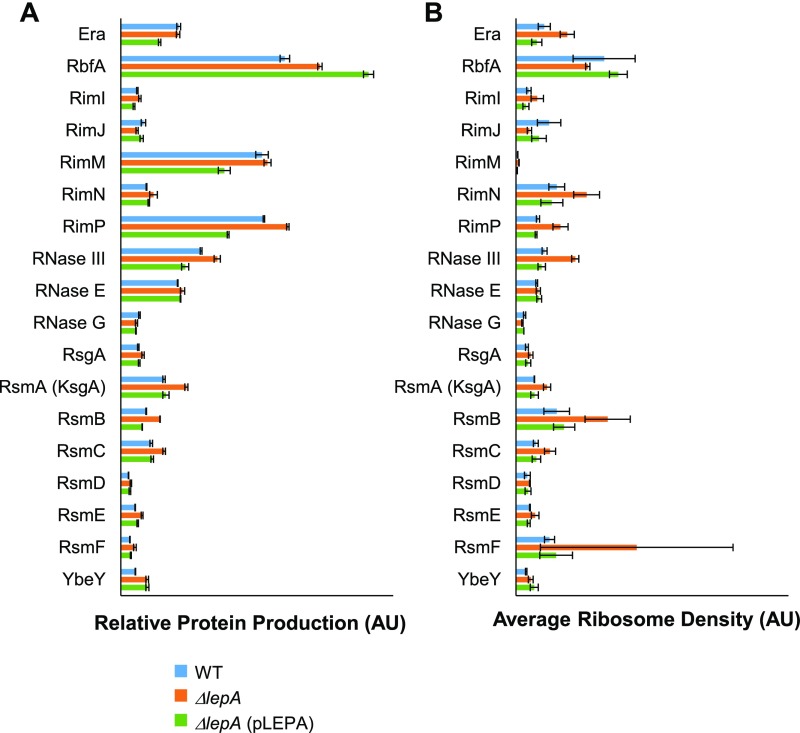
We considered the possibility that synthesis of certain r proteins is perturbed in the absence of LepA, resulting in the SSU biogenesis defects observed. To address this, relative rates of protein production in WT, M, and C cells were estimated by calculating ribo-seq coverage per gene length, using the data of Balakrishnan et al. (2014) (4). Only small differences are seen, several of which appear unrelated to LepA (Fig. S7A). Notably, when ARD values are compared (Fig. S7B), generally larger differences are seen, all of which are attributable to LepA (i.e., WT, C < M or WT, C > M). These data imply that altered translation in the absence of LepA is compensated for at the transcriptional level, restoring the overall protein production rates to near-normal levels. Importantly, there is no indication that any of the 30S proteins are appreciably underproduced in the mutant (Fig. S7A), arguing against the idea that the assembly defect stems from a limiting component of the SSU. We also calculated the predicted production rates for factors implicated in 30S biogenesis (Fig. S8). Again, only small changes attributable to loss of LepA (<1.6-fold) were observed. Thus, although formally possible, it seems unlikely that the 30S biogenesis defect is an indirect consequence of altered protein levels.
Fig. S7.
Predicted rates of production of r proteins are similar in the presence and absence of LepA. (A) Relative rates of protein production were estimated from ribosome profiling data (4), by calculating average ribo-seq coverage per codon for each of the indicated r protein genes. (B) ARD values, calculated as ribo-seq coverage divided by RNA-seq coverage (4), for each of the same genes. N.D., not determined; the S17 gene contains the promoter of the downstream spc operon, which complicates the measurement of ARD. Data represent the mean ± SD for control WT (blue), mutant ΔlepA (orange), and complemented ΔlepA (pLEPA) (green) strains. AU, arbitrary unit.
Fig. S8.
Predicted rates of synthesis of 30S biogenesis factors are similar in the presence and absence of LepA. (A) Relative rates of protein production were estimated from ribosome profiling data (4), by calculating average ribo-seq coverage per codon for each of the assembly factor genes. (B) ARD values, calculated as ribo-seq coverage divided by RNA-seq coverage (4), for each of the same genes. Data represent the mean ± SD for control WT (blue), mutant ΔlepA (orange), and complemented ΔlepA (pLEPA) (green) strains. AU, arbitrary unit.
Discussion
In the cell, ribosome assembly is facilitated by numerous factors and coincides with rRNA synthesis, processing, and modification (reviewed in refs. 20, 21). These assembly factors are believed to speed the process and prevent premature particles from participating in translation. In E. coli, known assembly factors include RNA helicases (DeaD, DbpA, RhlE, SrmB), RNA-modifying enzymes (KsgA, RluD, RlmA, RrmJ), chaperones (DnaK/DnaJ/GrpE, GroEL/GroES), GTPases (Era, Der, ObgE, RsgA), and other proteins (RbfA, RimM, RimP). In this study, we show that another GTPase, LepA, participates in ribosome biogenesis, facilitating assembly of the 30S subunit. Loss of LepA results in (i) accumulation of 30S particles missing S3, S10, S14, and S21; (ii) increased levels of precursor 17S rRNA; and (iii) exacerbation of the growth defect conferred by ∆rsgA. These data are consistent with the earlier evidence that cells lacking LepA exhibit cold sensitivity and elevated levels of free subunits (4, 22). Additionally, the bioinformatics tool STRING (23), and in particular its gene neighborhood algorithm, strongly associates LepA with Era and RNase III, proteins with well-established roles in SSU biogenesis. Finally, loss of LepA causes no substantial decreases in protein production rates for r proteins or 30S assembly factors, based on ribo-seq data. The simplest interpretation of these collective observations is that LepA functions in ribosome assembly.
Immature SSU particles that accumulate in the absence of RsgA or LepA are structurally similar. Presumably, these particles represent intermediates of low free energy, potentially with altered or misfolded rRNA conformation(s), and the GTPases destabilize these intermediates in some way and promote a path to full assembly. Recent pulse-chase experiments from the Williamson group suggest that SSU particles that accumulate in the absence of other assembly factors (e.g., RimP) represent long-lived rather than dead-end intermediates (24), and we suspect the same situation for the intermediates detected here. RsgA and LepA may have overlapping functions, each capable of rescuing (or inhibiting formation of) kinetically trapped intermediates with incompletely assembled 3′ domains. Indeed, this would explain why LepA is critical for growth only in the absence of RsgA.
Although similar, the roles of RsgA and LepA in 30S biogenesis are distinct. In the absence of LepA, the immature SSU particles lack S3 but contain normal levels of S2. This differs from the ∆rsgA case and is at odds with the Nomura assembly map, in which binding of S2 depends on prior binding of S3. Of course, the Nomura map is based on in vitro experiments done in the absence of assembly factors. It is believed that assembly factors shape the thermodynamic landscape of assembly to promote appropriate rRNA folding, and hence one would expect r protein binding dependencies to be less strict in the cell. The fact that S2 can be incorporated into SSU particles lacking S3, as indicated here and in earlier cryo-EM studies (24), supports this idea.
TrGTPases such as LepA are believed to function in the context of the 70S ribosome. Structures of various trGTPases (including EF-G, RF3, TetM, BipA, and LepA) bound to the ribosome provide evidence that these factors all bind similarly, with domains G and II contacting the LSU and SSU, respectively (25–29). The GTPase activity of trGTPases, including LepA (19), is most greatly stimulated by 70S ribosomes. By contrast, the GTPase activity of RsgA depends solely on the SSU (15), and RsgA binds the interface side of the SSU in a way that occludes 70S formation (18). Based on these observations, we propose that LepA acts late in the assembly process and in the context of the 70S ribosome. Precedent for this hypothesis comes from studies of ribosome biogenesis in eukaryotic cells (30). Late-stage assembly of the 40S subunit includes a functional “test drive,” a translation-like cycle of eIF5B-dependent 80S formation followed by Dom34/Rli1-dependent subunit splitting (31). A number of assembly factors are released during this test drive, driven by several NTP hydrolysis events, yielding mature subunits ready to enter the translating pool. A growing body of evidence indicates that analogous quality control mechanisms are at play in bacteria, with late-stage assembly events occurring in the context of the 70S ribosome (see next paragraph). We envisage that LepA acts at this late stage—binding a precursor 70S particle and promoting (at least in part) a conformational change in the head domain that provides another opportunity for correct folding of the 3′ domain. This proposed activity is in line with the known activities of related proteins EF-G, RF3, and TetM, which promote conformational changes in the 70S ribosome that allow rapid tRNA–mRNA movement, RF1/2 release, and tetracycline release, respectively (32–34).
Compelling evidence that late-stage ribosome biogenesis occurs in the context of the 70S ribosome comes from recent work of Varshney and coworkers (35). They have shown that reduced concentrations of initiator tRNAfMet in the cell inhibit ribosome maturation, as indicated by cold sensitivity and accumulation of assembly intermediates with untrimmed rRNA ends. Expression of mutant forms of tRNAfMet (with mutations targeting the three conserved G–C base pairs of the anticodon stem) phenocopies these biogenesis defects, and immature 70S intermediates bound by mutant fMet-tRNAfMet accumulate in these cells. The dominant negative effects of these mutant metY (tRNAfMet) alleles depend on the anticodon sequence, implying a role for codon–anticodon pairing. Based on these and additional data, the authors propose that the final stages of ribosome maturation take place in conjunction with its first round of initiation. This model can rationalize several earlier observations, including the presence of precursor rRNAs in polysomes (36, 37), links between IF2 and ribosome assembly (12, 38), and inhibition of 16S rRNA processing resulting from defects in 50S assembly (39, 40).
The functional link between biogenesis and initiation described by Varshney provides a plausible explanation for the effects of LepA on translation initiation (4). As LepA is a GTPase that facilitates late-stage ribosome biogenesis, loss of the factor would presumably slow (or alter) the process. If, as proposed (35), the first round of initiation acts as the test drive for the bacterial ribosome and the final events of ribosome maturation are coordinated with those of initiation, a delay in maturation would generate a kinetic bottleneck that blocks subsequent initiation events on the mRNA. One of the final events of ribosome maturation is processing of the 3′ end of 16S rRNA, which occurs in the context of the 70S intermediate and is thought to be aided by the Shine–Dalgarno and anti-Shine–Dalgarno (SD–ASD) pairing (35). Changes in such events, due to loss of LepA, might be expected to impact average initiation rates (determined by both immature and mature ribosomes) in a SD-dependent way, as observed (4).
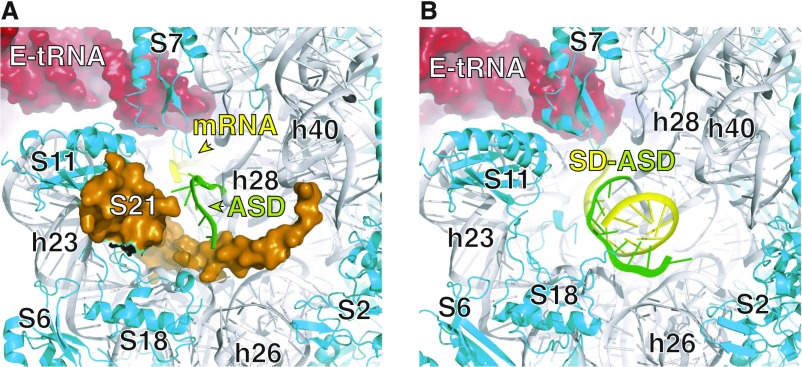
Another possibility is that the incompletely assembled 30S particles that accumulate in the ∆lepA mutant are responsible for the altered rates of initiation observed (4). One of the proteins missing from these particles is S21. In the ribosome, S21 lines a portion of the 5′ mRNA binding channel and is positioned to contact the SD–ASD helix (Fig. S9). It is conceivable, for example, that these misassembled 30S particles, which likely have an aberrant conformation of 3′ minor domain of 16S rRNA, may bind mRNA but fail to promote initiation, thereby interfering with initiation by the functional ribosomes in the cell. Worth noting here is that cells overproducing RbfA and lacking KsgA accumulate immature 30S particles missing S21, and initiation of translation is also perturbed in these cells (41). Further work will be necessary to clarify the mechanism(s) by which defects in ribosome biogenesis alter translation initiation in bacteria.
Fig. S9.
Model of the 30S subunit of the ribosome in the neighborhood of S21. Ribosomal protein S21 binds the platform domain of the subunit, near the E site, and lines a portion of the 5′ mRNA binding channel, where the SD–ASD helix forms. The image in A is based on a cryo-EM structure of the E. coli ribosome [PDB ID code 5AFI (52)]. In this structure, the mRNA (yellow) was unresolved 5′ of the E codon, although this region normally pairs with the ASD (green; 16S nucleotides 1535–1540) during initiation. S21 is shown in orange, as a surface-rendered model. The image in B is based on an X-ray crystal structure of the Thermus thermophilus ribosome [PDB ID code 4V4Z (58)], in which the SD–ASD helix is completely modeled. Ribosomes from T. thermophilus lack r protein S21. The perspective is identical in the two panels, so the relative positions of the ribosomal components can be readily compared.
Several ribosome-bound LepA structures have been reported (25, 42–44). In all cases, mRNA and tRNAs were also part of the complex, and the data were often interpreted with the assumption that LepA acts during elongation. These structures need to be revisited in light of our current findings. In these structures, the unique CTD of LepA extends across the intersubunit space to interact with the acceptor end of P-site tRNA. This position of LepA is incompatible with A/A-bound tRNA, as the CTD occupies the 50S A site. In those complexes with three tRNAs bound, the A-tRNA adopts a distorted conformation (termed “A/L-tRNA”) to avoid steric clash with bound LepA (42). To our knowledge, there is no evidence that ribosome biogenesis involves A-site tRNA; thus, we doubt that the A/L state holds relevance for this process. On the other hand, the recent findings of Varshney (discussed above) suggest a key role for fMet-tRNAfMet in late-stage biogenesis. Hence, the interactions observed between LepA CTD and P-tRNA likely do hold relevance. We hypothesize that the activity of LepA during the test-drive round of 70SIC formation includes a structural “check” of the complex via these interactions. It should be noted here that our data do not exclude the possibility that LepA acts in elongation under certain conditions (e.g., stress), in which case the A/L state may be important.
LepA is found specifically in bacteria and bacterial-derived plastids. This phylogenetic distribution is consistent with a role for LepA in ribosome biogenesis, as these lineages share the common problem of assembling a bacterial ribosome. Diverse phenotypes have been attributed to the loss of LepA, depending on the organism. These include acid sensitivity in Helicobacter pylori (45), hyperproduction of antibiotic in Streptomyces coelicolor (46), heat and cold sensitivity and reduced respiratory competence in Saccharomyces cerevisiae (47), photosensitivity and impaired photosynthetic function in Arabidopsis thaliana (48), and male sterility in mice (49). We suspect that all these phenotypes stem from defects in ribosome biogenesis, which have idiosyncratic effects on translation depending on the particular cell.
Methods
Bacterial strains were made using standard techniques such as P1 transduction and FLP-mediated marker excision, as detailed in SI Methods. Cell lysates were prepared and fractionated, SILAC/MS analyses were performed, and 17S rRNA was quantified using established methods (10, 14, 50, 51), as detailed in SI Methods.
SI Methods
Bacterial Plasmids and Strains.
Plasmid pLEPA was made by cloning the lepA gene and its native promoter into the low-copy vector pWSK29 (53), as described previously (7). The level of LepA produced from pLEPA is about twofold higher than that seen in WT cells, based on Western analysis (7). Plasmid pRSGA was constructed in an analogous way by amplifying the rsgA gene from BW25113 genomic DNA using primers rsgA-F (5′-GGATCTCGAGGGTTGGCATCGGTCACC-3′) and rsgA-R (5′-GCCCGGGCTCCAGGCCATTGTTTTGTC-3′) and cloning the resulting DNA fragment into the pWSK29 via Xho I and Xma I restriction sites.
For the LepA SILAC analysis, isogenic strains were constructed from a Lys− Arg− double auxotroph. Mutations ΔlysA::kan (JW2806) (11) and argE::Tn10 (CAG12185) (54) were moved by P1 transduction into parental strain BW25113 [F-, λ−, Δ(araD-araB)567, ΔlacZ4787::rrnB-3, Δ(rhaD-rhaB)568, rph-1, hsdR514] (11) to generate MRG01. Mutation ΔlepA::cat (4) was then moved by P1 transduction into MRG01 generating MRG02. Empty vector pWSK29 (53) was transformed into MRG01 and MRG02 to generate MRG03 and MRG04, respectively. Plasmid pLEPA was transformed into MRG02 to generate MRG05. MRG03 (WT, wild-type control), MRG04 (M, mutant ΔlepA), and MRG05 (C, complemented ΔlepA/lepA+) were used in the SILAC and SSU rRNA processing experiments. Plasmid pRB34 (4), identical to pLEPA except for the H81A codon change, was transformed into MRG02 to generate MRG102, which was included in the SSU rRNA processing experiments.
For the RsgA SILAC analysis, the kan marker in MRG01 was removed via flanking FRT sites, using pCP20-encoded FLP recombinase, as described (55). Mutation ΔrsgA::kan (JW4122) (11) was then moved by P1 transduction into this strain. These two strains were transformed with either pWSK29 or pRSGA to yield strains MRG06 (WT, control), MRG07 (M, ΔrsgA), and MRG08 (C, ΔrsgA/rsgA+), which were used in the SILAC and SSU rRNA processing experiments.
For growth measurements, prototrophic isogenic strains were constructed in E. coli BW25113. Mutations ΔrsgA::kan and ΔlepA::kan (11) were each moved by P1 transduction into BW25113 to generate MRG33 and MRG35, respectively. Resistance markers were removed from these strains by FLP-mediated recombination, generating MRG42 and MRG45, respectively. Mutation ΔlepA::kan was moved into MRG42 to generate the double mutant MRG44. BW25113, MRG42, MRG45, and MRG44 were transformed with pWSK29, pLEPA, or pRSGA to obtain the strains used in growth rate measurements of Table 1.
Analyses of r Protein Composition of Ribosomal Particles.
Cells were grown in M9 enriched minimal media plus glucose supplemented with light (unlabeled Arg and Lys; strains MRG03 and MRG06), medium (Arg 13C6 and Lys 2H4; strains MRG04 and MRG07), or heavy (Arg 13C6 15N4 and Lys 13C6 15N2; strains MRG05 and MRG08) amino acids. In each case, strains were grown overnight in the appropriate M9 media and then diluted 1:100 in 50 mL of the same media. Cells were grown to OD600 ∼ 0.5 and rapidly chilled, pelleted, and lysed as previously described (10). Clarified lysate (0.3 mL) was loaded onto an 11 mL 10–35% (wt/vol) sucrose gradient and subjected to ultracentrifugation at 150,000 × g for 4 h to separate ribosome complexes. Gradients were pumped using a syringe-pump system (Brandel) with in-line UV absorbance detector (UA-6, ISCO), and equivalent volume (0.5 mL) fractions were collected as indicated in Fig. S1. Corresponding fractions from WT, M, and C strains were mixed, and proteins were precipitated using 13% (wt/vol) trichloroacetic acid (TCA).
Mass Spectrometry.
Protein precipitates were boiled in SDS sample buffer and run on a short 10% (wt/vol) SDS/PAGE gel. Proteins were visualized by colloidal coomassie (56) and digested out of the gel as described (50). Peptide samples were purified by solid phase extraction on C-18 STop And Go Extraction (STAGE) Tips (57) and analyzed by a quadrupole–time of flight mass spectrometer (Impact II; Bruker Daltonics) coupled to an Easy nano LC 1000 HPLC (ThermoFisher Scientific) using an analytical column that was 40–50 cm long, with a 75-μm inner diameter fused silica with an integrated spray tip pulled with P-2000 laser puller (Sutter Instruments) and packed with 1.9 μm diameter Reprosil-Pur C-18-AQ beads (Maisch, www.Dr-Maisch.com). Buffer A consisted of 0.1% aqueous formic acid, and buffer B consisted of 0.1% formic acid and 80% (vol/vol) acetonitrile in water. A standard 90-min peptide separation was done, and the column was washed with 100% buffer B before re-equilibration with buffer A. The Impact II was set to acquire in a data-dependent auto-MS/MS mode with inactive focus fragmenting the 20 most abundant ions (one at the time at a 18-Hz rate) after each full-range scan from m/z 200 to m/z 2,000 at 5 Hz rate. The isolation window for MS/MS was 2–3 depending on the parent ion mass to charge ratio, and the collision energy ranged from 23 to 65 eV depending on ion mass and charge. Parent ions were then excluded from MS/MS for the next 0.4 min and reconsidered if their intensity increased more than five times. Singly charged ions were excluded from fragmentation.
Data Analysis.
Analysis of mass spectrometry data was performed using MaxQuant 1.5.1.0. The search was performed against a database comprised of the protein sequences from Uniprot’s E. coli K12 entries plus common contaminants with variable modifications of methionine oxidation, and N-acetylation of the proteins, in addition to the heavy amino acids used for quantitation. Only those peptides exceeding the individually calculated 99% confidence limit (as opposed to the average limit for the whole experiment) were considered as accurately identified.
Raw isotope ratios (M/WT or C/WT) for S2–S21 and L1–L35 were normalized to the median value of all SSU or LSU proteins, respectively, in each sample. Isotope ratios were in some cases not obtained, depending on the particular sample and protein. Consequently, the number of measurements used to calculate a given value was sometimes smaller than the number of independent experiments. One-sample Student’s t test was used to evaluate the mean value (m) using the null hypothesis m = 1.0, and P values were calculated using online software (QuickCalcs, GraphPad).
Growth Rate Measurements.
Overnight cultures were diluted 1:100 and grown in 50 mL LB media at 37 °C. Growth was monitored by measuring the turbidity of the culture, and log2 (OD600) values were plotted versus time. The linear portion of the plot was identified and fitted to a linear function, the slope of which defined growth rate (doublings/min), the inverse of doubling time.
Analysis of SSU rRNA Processing.
Strains MRG03, MRG04, MRG05, MRG07, and MRG08 were grown in glucose M9 media supplemented with Lys and Arg. Cells were lysed, and the clarified lysates were subjected to sucrose gradient sedimentation as described above. Ribosomes from selected sucrose gradient fractions (5–8, 13, 14) were precipitated with ethanol, pelleted, and dissolved in 200 µL extraction buffer (0.3 M NaOAc, pH 6.5, 0.5% SDS, 5 mM EDTA). At this point, fractions 13 and 14 (containing the 70S peak) were pooled. RNA was extracted twice with water-saturated phenol and twice with CHCl3/isoamyl alcohol (24:1), precipitated with ethanol, and pelleted. RNA pellets were dissolved in water and subjected to denaturing PAGE as described (14). Gels were stained with SYBR-Gold Nucleic Acid Stain (ThermoFisher, Invitrogen) and scanned using a Typhoon FLA 9000 fluorescence imager (GE Healthcare Life Sciences). The relative intensities of bands corresponding to 17S and 16S rRNA were quantified using ImageQuant version 5.2 (Molecular Dynamics), and the percent 17S was calculated, after correcting for the size difference between 16S and 17S, as [17S/(16S + 17S)] × 100%.
Acknowledgments
We thank M. Ibba, H. Wieden, R. Bundschuh, U. Varshney, S. Shetty, H. Noller, L. Lancaster, M. Rodnina, and D. Ermolenko for helpful discussions and/or comments on the manuscript. This work was supported by National Institutes of Health Grants GM072528 (to K.F.) and Canadian Institutes of Health Research Open Operating Grant MOP-77688 (to L.J.F.).
Footnotes
The authors declare no conflict of interest.
This article is a PNAS Direct Submission.
This article contains supporting information online at www.pnas.org/lookup/suppl/doi:10.1073/pnas.1613665114/-/DCSupplemental.
References
- 1.Margus T, Remm M, Tenson T. Phylogenetic distribution of translational GTPases in bacteria. BMC Genomics. 2007;8:15. doi: 10.1186/1471-2164-8-15. [DOI] [PMC free article] [PubMed] [Google Scholar]
- 2.Dibb NJ, Wolfe PB. lep operon proximal gene is not required for growth or secretion by Escherichia coli. J Bacteriol. 1986;166(1):83–87. doi: 10.1128/jb.166.1.83-87.1986. [DOI] [PMC free article] [PubMed] [Google Scholar]
- 3.Qin Y, et al. The highly conserved LepA is a ribosomal elongation factor that back-translocates the ribosome. Cell. 2006;127(4):721–733. doi: 10.1016/j.cell.2006.09.037. [DOI] [PubMed] [Google Scholar]
- 4.Balakrishnan R, Oman K, Shoji S, Bundschuh R, Fredrick K. The conserved GTPase LepA contributes mainly to translation initiation in Escherichia coli. Nucleic Acids Res. 2014;42(21):13370–13383. doi: 10.1093/nar/gku1098. [DOI] [PMC free article] [PubMed] [Google Scholar]
- 5.Liu H, Pan D, Pech M, Cooperman BS. Interrupted catalysis: The EF4 (LepA) effect on back-translocation. J Mol Biol. 2010;396(4):1043–1052. doi: 10.1016/j.jmb.2009.12.043. [DOI] [PMC free article] [PubMed] [Google Scholar]
- 6.Liu H, et al. The conserved protein EF4 (LepA) modulates the elongation cycle of protein synthesis. Proc Natl Acad Sci USA. 2011;108(39):16223–16228. doi: 10.1073/pnas.1103820108. [DOI] [PMC free article] [PubMed] [Google Scholar]
- 7.Shoji S, Janssen BD, Hayes CS, Fredrick K. Translation factor LepA contributes to tellurite resistance in Escherichia coli but plays no apparent role in the fidelity of protein synthesis. Biochimie. 2010;92(2):157–163. doi: 10.1016/j.biochi.2009.11.002. [DOI] [PMC free article] [PubMed] [Google Scholar]
- 8.Godson GN, Sinsheimer RL. Use of Brij lysis as a general method to prepare polyribosomes from Escherichia coli. Biochim Biophys Acta. 1967;149(2):489–495. doi: 10.1016/0005-2787(67)90176-1. [DOI] [PubMed] [Google Scholar]
- 9.McGinnis JL, et al. In-cell SHAPE reveals that free 30S ribosome subunits are in the inactive state. Proc Natl Acad Sci USA. 2015;112(8):2425–2430. doi: 10.1073/pnas.1411514112. [DOI] [PMC free article] [PubMed] [Google Scholar]
- 10.Qin D, Fredrick K. Analysis of polysomes from bacteria. Methods Enzymol. 2013;530:159–172. doi: 10.1016/B978-0-12-420037-1.00008-7. [DOI] [PubMed] [Google Scholar]
- 11.Baba T, et al. Construction of Escherichia coli K-12 in-frame, single-gene knockout mutants: the Keio collection. Mol Syst Biol. 2006;2:2006.0008. doi: 10.1038/msb4100050. [DOI] [PMC free article] [PubMed] [Google Scholar]
- 12.Campbell TL, Brown ED. Genetic interaction screens with ordered overexpression and deletion clone sets implicate the Escherichia coli GTPase YjeQ in late ribosome biogenesis. J Bacteriol. 2008;190(7):2537–2545. doi: 10.1128/JB.01744-07. [DOI] [PMC free article] [PubMed] [Google Scholar]
- 13.Goto S, Kato S, Kimura T, Muto A, Himeno H. RsgA releases RbfA from 30S ribosome during a late stage of ribosome biosynthesis. EMBO J. 2011;30(1):104–114. doi: 10.1038/emboj.2010.291. [DOI] [PMC free article] [PubMed] [Google Scholar]
- 14.Leong V, Kent M, Jomaa A, Ortega J. Escherichia coli rimM and yjeQ null strains accumulate immature 30S subunits of similar structure and protein complement. RNA. 2013;19(6):789–802. doi: 10.1261/rna.037523.112. [DOI] [PMC free article] [PubMed] [Google Scholar]
- 15.Himeno H, et al. A novel GTPase activated by the small subunit of ribosome. Nucleic Acids Res. 2004;32(17):5303–5309. doi: 10.1093/nar/gkh861. [DOI] [PMC free article] [PubMed] [Google Scholar]
- 16.Thurlow B, et al. Binding properties of YjeQ (RsgA), RbfA, RimM and Era to assembly intermediates of the 30S subunit. Nucleic Acids Res. 2016;44(20):9918–9932. doi: 10.1093/nar/gkw613. [DOI] [PMC free article] [PubMed] [Google Scholar]
- 17.Chen SS, Williamson JR. Characterization of the ribosome biogenesis landscape in E. coli using quantitative mass spectrometry. J Mol Biol. 2013;425(4):767–779. doi: 10.1016/j.jmb.2012.11.040. [DOI] [PMC free article] [PubMed] [Google Scholar]
- 18.Jomaa A, et al. Understanding ribosome assembly: The structure of in vivo assembled immature 30S subunits revealed by cryo-electron microscopy. RNA. 2011;17(4):697–709. doi: 10.1261/rna.2509811. [DOI] [PMC free article] [PubMed] [Google Scholar]
- 19.De Laurentiis EI, Wieden HJ. Identification of two structural elements important for ribosome-dependent GTPase activity of elongation factor 4 (EF4/LepA) Sci Rep. 2015;5:8573. doi: 10.1038/srep08573. [DOI] [PMC free article] [PubMed] [Google Scholar]
- 20.Wilson DN, Nierhaus KH. The weird and wonderful world of bacterial ribosome regulation. Crit Rev Biochem Mol Biol. 2007;42(3):187–219. doi: 10.1080/10409230701360843. [DOI] [PubMed] [Google Scholar]
- 21.Shajani Z, Sykes MT, Williamson JR. Assembly of bacterial ribosomes. Annu Rev Biochem. 2011;80:501–526. doi: 10.1146/annurev-biochem-062608-160432. [DOI] [PubMed] [Google Scholar]
- 22.Pech M, et al. Elongation factor 4 (EF4/LepA) accelerates protein synthesis at increased Mg2+ concentrations. Proc Natl Acad Sci USA. 2011;108(8):3199–3203. doi: 10.1073/pnas.1012994108. [DOI] [PMC free article] [PubMed] [Google Scholar]
- 23.Szklarczyk D, et al. STRING v10: Protein-protein interaction networks, integrated over the tree of life. Nucleic Acids Res. 2015;43(Database issue):D447–D452. doi: 10.1093/nar/gku1003. [DOI] [PMC free article] [PubMed] [Google Scholar]
- 24.Sashital DG, et al. A combined quantitative mass spectrometry and electron microscopy analysis of ribosomal 30S subunit assembly in E. coli. eLife. 2014;3:3. doi: 10.7554/eLife.04491. [DOI] [PMC free article] [PubMed] [Google Scholar]
- 25.Gagnon MG, Lin J, Bulkley D, Steitz TA. Crystal structure of elongation factor 4 bound to a clockwise ratcheted ribosome. Science. 2014;345(6197):684–687. doi: 10.1126/science.1253525. [DOI] [PMC free article] [PubMed] [Google Scholar]
- 26.Gao YG, et al. The structure of the ribosome with elongation factor G trapped in the posttranslocational state. Science. 2009;326(5953):694–699. doi: 10.1126/science.1179709. [DOI] [PMC free article] [PubMed] [Google Scholar]
- 27.Kumar V, et al. Structure of BipA in GTP form bound to the ratcheted ribosome. Proc Natl Acad Sci USA. 2015;112(35):10944–10949. doi: 10.1073/pnas.1513216112. [DOI] [PMC free article] [PubMed] [Google Scholar]
- 28.Li W, et al. Mechanism of tetracycline resistance by ribosomal protection protein Tet(O) Nat Commun. 2013;4:1477. doi: 10.1038/ncomms2470. [DOI] [PMC free article] [PubMed] [Google Scholar]
- 29.Zhou J, Lancaster L, Trakhanov S, Noller HF. Crystal structure of release factor RF3 trapped in the GTP state on a rotated conformation of the ribosome. RNA. 2012;18(2):230–240. doi: 10.1261/rna.031187.111. [DOI] [PMC free article] [PubMed] [Google Scholar]
- 30.Karbstein K. Quality control mechanisms during ribosome maturation. Trends Cell Biol. 2013;23(5):242–250. doi: 10.1016/j.tcb.2013.01.004. [DOI] [PMC free article] [PubMed] [Google Scholar]
- 31.Strunk BS, Novak MN, Young CL, Karbstein K. A translation-like cycle is a quality control checkpoint for maturing 40S ribosome subunits. Cell. 2012;150(1):111–121. doi: 10.1016/j.cell.2012.04.044. [DOI] [PMC free article] [PubMed] [Google Scholar]
- 32.Burdett V. Tet(M)-promoted release of tetracycline from ribosomes is GTP dependent. J Bacteriol. 1996;178(11):3246–3251. doi: 10.1128/jb.178.11.3246-3251.1996. [DOI] [PMC free article] [PubMed] [Google Scholar]
- 33.Freistroffer DV, Pavlov MY, MacDougall J, Buckingham RH, Ehrenberg M. Release factor RF3 in E.coli accelerates the dissociation of release factors RF1 and RF2 from the ribosome in a GTP-dependent manner. EMBO J. 1997;16(13):4126–4133. doi: 10.1093/emboj/16.13.4126. [DOI] [PMC free article] [PubMed] [Google Scholar]
- 34.Savelsbergh A, et al. An elongation factor G-induced ribosome rearrangement precedes tRNA-mRNA translocation. Mol Cell. 2003;11(6):1517–1523. doi: 10.1016/s1097-2765(03)00230-2. [DOI] [PubMed] [Google Scholar]
- 35.Shetty S, Varshney U. An evolutionarily conserved element in initiator tRNAs prompts ultimate steps in ribosome maturation. Proc Natl Acad Sci USA. 2016;113(41):E6126–E6134. doi: 10.1073/pnas.1609550113. [DOI] [PMC free article] [PubMed] [Google Scholar]
- 36.Mangiarotti G, Turco E, Ponzetto A, Altruda F. Precursor 16S RNA in active 30S ribosomes. Nature. 1974;247(5437):147–148. doi: 10.1038/247147a0. [DOI] [PubMed] [Google Scholar]
- 37.Srivastava AK, Schlessinger D. Coregulation of processing and translation: Mature 5′ termini of Escherichia coli 23S ribosomal RNA form in polysomes. Proc Natl Acad Sci USA. 1988;85(19):7144–7148. doi: 10.1073/pnas.85.19.7144. [DOI] [PMC free article] [PubMed] [Google Scholar]
- 38.Stokes JM, Davis JH, Mangat CS, Williamson JR, Brown ED. Discovery of a small molecule that inhibits bacterial ribosome biogenesis. eLife. 2014;3:e03574. doi: 10.7554/eLife.03574. [DOI] [PMC free article] [PubMed] [Google Scholar]
- 39.Jiang M, et al. The Escherichia coli GTPase CgtAE is involved in late steps of large ribosome assembly. J Bacteriol. 2006;188(19):6757–6770. doi: 10.1128/JB.00444-06. [DOI] [PMC free article] [PubMed] [Google Scholar]
- 40.Hwang J, Inouye M. The tandem GTPase, Der, is essential for the biogenesis of 50S ribosomal subunits in Escherichia coli. Mol Microbiol. 2006;61(6):1660–1672. doi: 10.1111/j.1365-2958.2006.05348.x. [DOI] [PubMed] [Google Scholar]
- 41.Connolly K, Culver G. Overexpression of RbfA in the absence of the KsgA checkpoint results in impaired translation initiation. Mol Microbiol. 2013;87(5):968–981. doi: 10.1111/mmi.12145. [DOI] [PMC free article] [PubMed] [Google Scholar]
- 42.Gagnon MG, Lin J, Steitz TA. Elongation factor 4 remodels the A-site tRNA on the ribosome. Proc Natl Acad Sci USA. 2016;113(18):4994–4999. doi: 10.1073/pnas.1522932113. [DOI] [PMC free article] [PubMed] [Google Scholar]
- 43.Kumar V, et al. Structure of the GTP form of elongation factor 4 (EF4) bound to the ribosome. J Biol Chem. 2016;291(25):12943–12950. doi: 10.1074/jbc.M116.725945. [DOI] [PMC free article] [PubMed] [Google Scholar]
- 44.Zhang D, et al. EF4 disengages the peptidyl-tRNA CCA end and facilitates back-translocation on the 70S ribosome. Nat Struct Mol Biol. 2016;23(2):125–131. doi: 10.1038/nsmb.3160. [DOI] [PubMed] [Google Scholar]
- 45.Bijlsma JJ, Lie-A-Ling M, Nootenboom IC, Vandenbroucke-Grauls CM, Kusters JG. Identification of loci essential for the growth of Helicobacter pylori under acidic conditions. J Infect Dis. 2000;182(5):1566–1569. doi: 10.1086/315855. [DOI] [PubMed] [Google Scholar]
- 46.Badu-Nkansah A, Sello JK. Deletion of the elongation factor 4 gene (lepA) in Streptomyces coelicolor enhances the production of the calcium-dependent antibiotic. FEMS Microbiol Lett. 2010;311(2):147–151. doi: 10.1111/j.1574-6968.2010.02083.x. [DOI] [PubMed] [Google Scholar]
- 47.Bauerschmitt H, Funes S, Herrmann JM. The membrane-bound GTPase Guf1 promotes mitochondrial protein synthesis under suboptimal conditions. J Biol Chem. 2008;283(25):17139–17146. doi: 10.1074/jbc.M710037200. [DOI] [PubMed] [Google Scholar]
- 48.Ji DL, Lin H, Chi W, Zhang LX. CpLEPA is critical for chloroplast protein synthesis under suboptimal conditions in Arabidopsis thaliana. PLoS One. 2012;7(11):e49746. doi: 10.1371/journal.pone.0049746. [DOI] [PMC free article] [PubMed] [Google Scholar]
- 49.Gao Y, et al. Mammalian elongation factor 4 regulates mitochondrial translation essential for spermatogenesis. Nat Struct Mol Biol. 2016;23(5):441–449. doi: 10.1038/nsmb.3206. [DOI] [PubMed] [Google Scholar]
- 50.Chan QW, Howes CG, Foster LJ. Quantitative comparison of caste differences in honeybee hemolymph. Mol Cell Proteomics. 2006;5(12):2252–2262. doi: 10.1074/mcp.M600197-MCP200. [DOI] [PubMed] [Google Scholar]
- 51.McAfee A, et al. Toward an upgraded honey bee (Apis mellifera L.) genome annotation using proteogenomics. J Proteome Res. 2016;15(2):411–421. doi: 10.1021/acs.jproteome.5b00589. [DOI] [PubMed] [Google Scholar]
- 52.Fischer N, et al. Structure of the E. coli ribosome-EF-Tu complex at <3 Å resolution by Cs-corrected cryo-EM. Nature. 2015;520(7548):567–570. doi: 10.1038/nature14275. [DOI] [PubMed] [Google Scholar]
- 53.Wang RF, Kushner SR. Construction of versatile low-copy-number vectors for cloning, sequencing and gene expression in Escherichia coli. Gene. 1991;100:195–199. [PubMed] [Google Scholar]
- 54.Nichols BP, Shafiq O, Meiners V. Sequence analysis of Tn10 insertion sites in a collection of Escherichia coli strains used for genetic mapping and strain construction. J Bacteriol. 1998;180(23):6408–6411. doi: 10.1128/jb.180.23.6408-6411.1998. [DOI] [PMC free article] [PubMed] [Google Scholar]
- 55.Cherepanov PP, Wackernagel W. Gene disruption in Escherichia coli: TcR and KmR cassettes with the option of Flp-catalyzed excision of the antibiotic-resistance determinant. Gene. 1995;158(1):9–14. doi: 10.1016/0378-1119(95)00193-a. [DOI] [PubMed] [Google Scholar]
- 56.Candiano G, et al. Blue silver: A very sensitive colloidal Coomassie G-250 staining for proteome analysis. Electrophoresis. 2004;25(9):1327–1333. doi: 10.1002/elps.200305844. [DOI] [PubMed] [Google Scholar]
- 57.Ishihama Y, Rappsilber J, Andersen JS, Mann M. Microcolumns with self-assembled particle frits for proteomics. J Chromatogr A. 2002;979(1-2):233–239. doi: 10.1016/s0021-9673(02)01402-4. [DOI] [PubMed] [Google Scholar]
- 58.Yusupova G, Jenner L, Rees B, Moras D, Yusupov M. Structural basis for messenger RNA movement on the ribosome. Nature. 2006;444(7117):391–394. doi: 10.1038/nature05281. [DOI] [PubMed] [Google Scholar]


