Significance
Neurons in the human parahippocampal cortex explicitly code for scenes, rather than people, animals, or objects. More specifically, they respond to outdoor pictures, rather than to indoor pictures, and to stimuli with rather than without spatial layout. These scene-selective neurons are spatially clustered and receive spatially clustered inputs reflected by an event-related local field potential (LFP). Furthermore, these neurons form a distributed population code that is less sparse than codes found elsewhere in the human medial temporal lobe. Our findings thus provide insight into the electrophysiological (single unit and LFP) substrates underlying the parahippocampal place area, a structure well-known from neuroimaging.
Keywords: electrophysiology, single units, scene selectivity, population code
Abstract
Imaging, electrophysiological, and lesion studies have shown a relationship between the parahippocampal cortex (PHC) and the processing of spatial scenes. Our present knowledge of PHC, however, is restricted to the macroscopic properties and dynamics of bulk tissue; the behavior and selectivity of single parahippocampal neurons remains largely unknown. In this study, we analyzed responses from 630 parahippocampal neurons in 24 neurosurgical patients during visual stimulus presentation. We found a spatially clustered subpopulation of scene-selective units with an associated event-related field potential. These units form a population code that is more distributed for scenes than for other stimulus categories, and less sparse than elsewhere in the medial temporal lobe. Our electrophysiological findings provide insight into how individual units give rise to the population response observed with functional imaging in the parahippocampal place area.
The involvement of posterior parahippocampal cortex (PHC) in perceiving landmarks and scenes is well established. Studies using fMRI and intracranial electroencephalography (iEEG) have demonstrated that a region in posterior PHC exhibits significantly greater activation to passively viewed scenes and landscapes than to single objects or faces (1, 2). Moreover, damage to posterior PHC produces anterograde disorientation, a deficit in the ability to navigate in novel environments (3, 4), and electrical stimulation in this area produces complex topographic visual hallucinations (5). Beyond gross scene-selectivity, other studies suggested that the parahippocampal place area (PPA) responds more strongly to outdoor scenes (1), to images of objects with a spatial background (6), to objects that are larger in the real world regardless of retinotopic size (7–9), and to images with greater perceived depth (10, 11). However, as a voxel in a typical fMRI study corresponds to several cubic millimeters of cortex, and as iEEG contacts record the activity of large numbers of neurons, our present knowledge of PHC is restricted to the properties and dynamics of bulk tissue properties (12). The selectivity of single parahippocampal neurons thus remains largely unknown.
In this work we set out to investigate the single neuron responses underlying these results. At least three different, although not necessarily mutually exclusive, types of single neuron selectivity profiles could potentially produce the scene-selective population response observed with fMRI and iEEG recordings. First, units could exhibit sparse responses, each of them tuned to one or relatively few individual scenes, similar to the semantically invariant neurons observed in the human medial temporal lobe that fire selectively to specific familiar individuals (13). In this case, the scene-selective responses observed with fMRI and iEEG would be given by the spatial average of neurons with different responses. Second, each unit could be scene-selective, but respond to many scenes, thus representing a distributed code, as found in macaque face and scene patches (14, 15). Third, units might represent a low-level feature or conjunction of features present in both scene and nonscene stimuli, but more prevalent in the former, such that population activity to scenes exceeds that to nonscenes. In this scenario, strong scene selectivity would be present at the population level, but single neurons would be only weakly scene-selective. Neurocomputational models of PHC function are scarce (16, 17) and do not make specific predictions about the sparseness of neuronal scene responses. By analyzing the responses of single neurons in PHC to visual stimuli in subjects with pharmacologically intractable epilepsy, we sought to determine how viewing pictures of scenes modulated spiking responses of individual parahippocampal neurons.
Results
We recorded a total of 1,998 units (668 single and 1,330 multiunits) (Table S1) from the hippocampus (829 single and multiunits), entorhinal cortex (EC; 539 units), and PHC (630 units) of 24 neurosurgical patients undergoing epilepsy monitoring while they viewed images on an LCD monitor. Stimulus sets contained images of persons, animals, and landscapes (with and without buildings; Materials and Methods).
Table S1.
Numbers of units (combined single- and multiunits) fulfilling various criteria
| Type of units | PHC | EC | Hippocampus |
| Units (total) | 630 (126) | 539 | 829 |
| Units algorithmically selected for population plots | 226 (36) | 286 | 231 |
| Units responding to one or more scenes | 176 (28) | 62 | 119 |
| Units responding to at least 25% of scenes | 49 (9) | 3 | 1 |
| Units showing scene/nonscene category distinction | 119 (29) | 35 | 37 |
| Units on microelectrodes with scene-selective LFP | 168 | ||
| Scene-selective units on microelectrodes with scene-selective LFP | 73 |
Numbers in parentheses show single units only.
PHC Neurons Respond to Landscapes and Scenes.
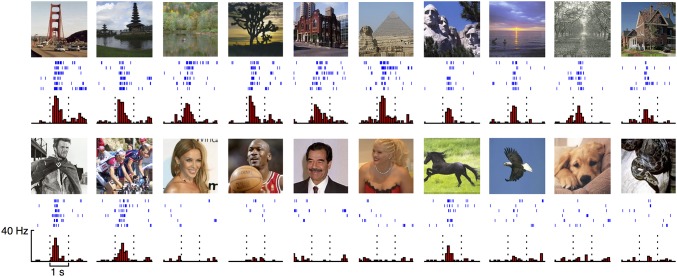
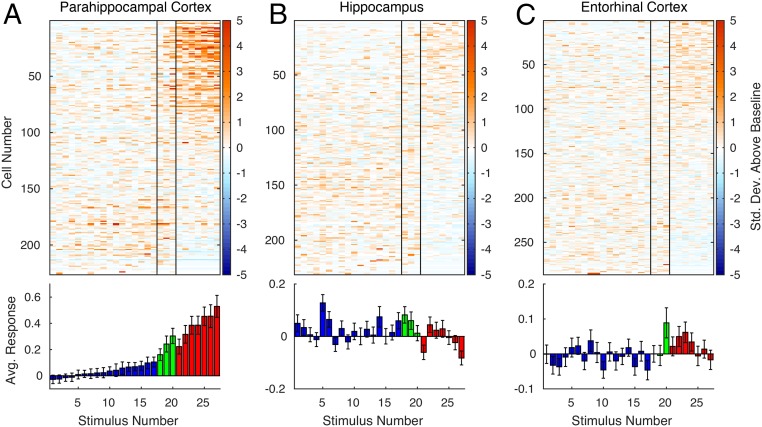
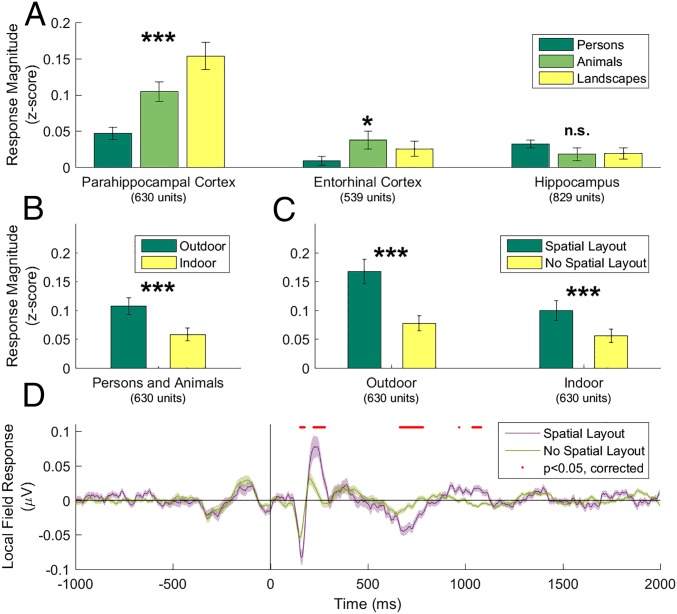
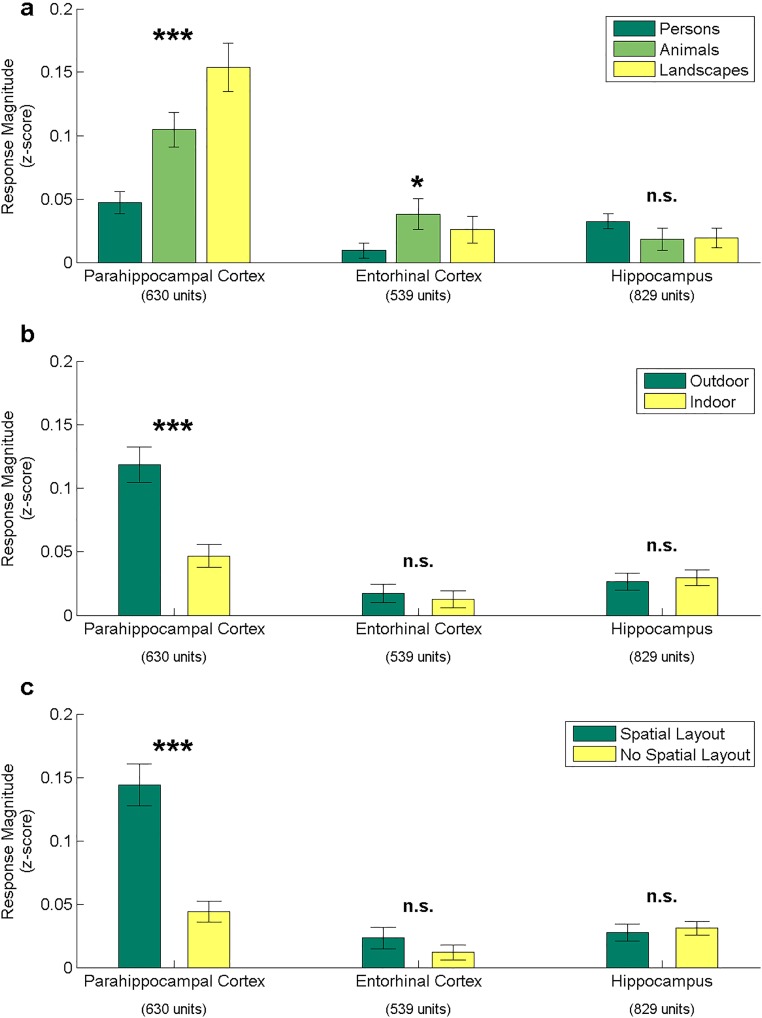
Although neurons in EC and hippocampus showed little consistent preference for any particular stimulus category, neurons in PHC responded strongly to landscapes (Figs. 1 and 2 and Fig. S1). To statistically compare neuronal selectivity across regions and categories, we calculated the mean baseline-normalized response magnitude of every neuron to each stimulus category. Comparison of the mean response to different stimulus categories in the three MTL regions showed a highly significant category selectivity in the PHC (P < 10−12, repeated-measures one-way ANOVA). Landscapes evoked a significantly stronger response than persons (P < 10−9, paired t test) or animals (P = 0.0003; Fig. 3A and Fig. S2A).
Fig. 1.
Typical response of a scene-selective single neuron in PHC to a variety of landscape stimuli (Upper) and nonlandscape stimuli (Lower). Landscape stimuli and nonlandscape stimuli with indications of spatial layout (scenes) elicited robust responses, whereas stimuli without indications of spatial layout (nonscenes) elicited no response. Note that because of insurmountable copyright problems, all original celebrity pictures were replaced by very similar ones (same person, similar background, etc.) from the public domain. Images courtesy of Wikimedia Commons/ThiloK, flickr/Renan Katayama, Basketballphoto.com/Steve Lipofsky, flickr/doggiesrule04.
Fig. 2.
Responses of 226 parahippocampal (A), 231 hippocampal (B), and 286 entorhinal (C) single and multiunits to the same 27 stimuli (Materials and Methods for selection procedure) comprising persons (Left, blue), animals (Middle, green), and landscapes (Right, red), normalized by prestimulus baseline activity. Vertical bars in upper graphs separate stimulus categories. Units are sorted by scene selectivity index. Within each category, stimuli are sorted by average response. Error bars in lower graphs are ±SEM of responses averaged across units.
Fig. S1.
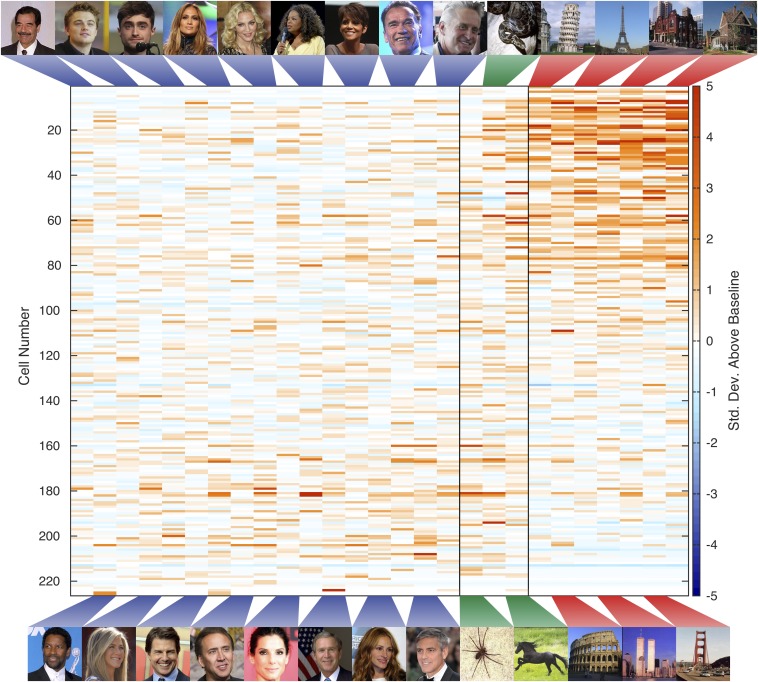
Responses of 226 single- and multiunits in parahippocampal cortex to persons (Left), animals (Middle), and landscapes (Right), normalized by baseline activity, exactly as in Fig. 2A, but including stimuli shown. Vertical bars separate stimulus categories. Units are sorted by their response to landscapes, normalized by their response to all stimuli. Within each category, stimuli are sorted by average response. Stimuli containing spatial cues elicited stronger responses in a large proportion of units. Note that because of insurmountable copyright problems, all original celebrity pictures were replaced by very similar ones (same person, similar background, etc.) from the public domain. Images courtesy of (top row, left to right) Wikimedia Commons/Falkenauge, flickr/Gage Skidmore, flickr/dvsross, Wikimedia Commons/David Shankbone, flickr/aphrodite-in-nyc, Wikimedia Commons/Gage Skidmore, flickr/EvaRinaldi, and US Navy/Stephen P. Weaver; (bottom row, left to right) flickr/drcliffordchoi, Wikimedia Commons/Angela George, Wikimedia Commons/Georges Biard, flickr/Gerald Geronimo, flickr/EvaRinaldi, Eric Draper, Wikimedia Commons/David Shankbone, and flickr/Nicolas genin.
Fig. 3.
(A) Response magnitudes of single and multiunits in different regions of the medial temporal lobe to three stimulus categories indicate that only parahippocampal neurons respond more strongly to pictures of landscapes than to pictures of persons or animals (repeated-measures ANOVAs). Error bars are ±SEM. (B) Even after excluding landscape stimuli, parahippocampal neurons respond more strongly to outdoor photographs than to indoor photographs (t test). (C) For both outdoor and indoor pictures (excluding landscapes), pictures with spatial layout (scenes) elicit stronger responses in parahippocampal neurons than those without spatial layout (nonscenes). (D) Averaged LFP ±SEM for stimuli with or without spatial layout across all 472 parahippocampal microelectrodes. LFP responses to stimuli containing spatial layout (scenes) significantly exceed those to stimuli without spatial layout (nonscenes). Red circles indicate P < 0.05 after multiple testing correction. t tests: ***P < 0.001; *P < 0.05; n.s., not significant.
Fig. S2.
Responsiveness of MTL neurons (single and multiunits) to different stimulus categories. (A) Response magnitude of units in different MTL regions to three stimulus categories indicate that only parahippocampal neurons respond more strongly to pictures of landscapes than to pictures of persons or animals (repeated-measures ANOVAs), same as Fig. 3A. (B) Same as A, but comparing responses to indoor vs. outdoor pictures. (C) Same as A and B, comparing responses to stimuli with spatial layout vs. stimuli without spatial layout. ***P < 0.001; *P < 0.05; n.s., not significant.
Furthermore, outdoor photographs evoked a significantly stronger response than indoor photographs (Fig. S2B), even after excluding landscape stimuli, which consisted exclusively of outdoor photographs (Fig. 3B; P < 10−9). In addition, all stimuli were divided into groups with and without cues of spatial layout (Fig. 3C, Fig. S2C, and Materials and Methods), subsequently referred to as scenes and nonscenes, respectively. Within both outdoor and indoor categories (excluding landscapes), the PHC neurons responded more strongly to scenes than to nonscenes (outdoor: P < 10−5; indoor: P < 10−6, paired t test).
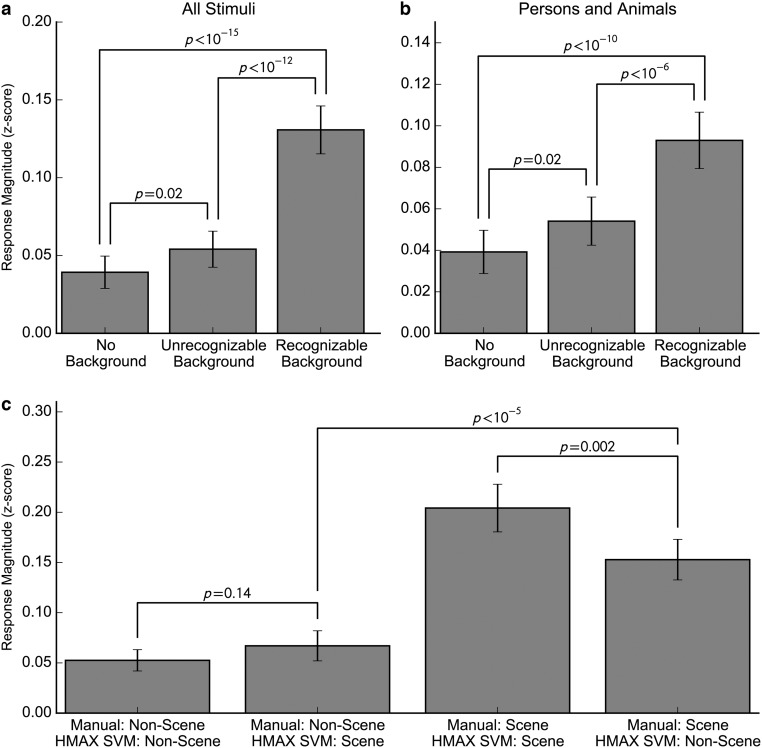
We ran an additional series of analyses to investigate relationships between response magnitude and stimulus content. We divided images into three categories: no background present, background present but unrecognizable, and background clearly visible. The responses of parahippocampal neurons to images of persons and animals with a recognizable background were significantly stronger than the responses to images with no background or an unrecognizable background (vs. no background: P < 10−10; vs. unrecognizable background: P < 10−6, paired t test; Fig. S3 A and B), but there was only a minor difference between images with no background and images with an unrecognizable background (P = 0.02).
Fig. S3.
Influence of background and low-level features. (A) Mean z-scored response of parahippocampal neurons (single and multiunits) to images with no background, an unrecognizable background, and a recognizable background. (B) Same as A, but for images of persons and animals only. (C) Mean z-scored response of parahippocampal units to images grouped by manual scene/nonscene labels and the labels generated using a support vector machine trained on HMAX features. All error bars are ±SEM.
Among images with a recognizable background, images with greater perceived depth (i.e., with more spatial information) evoked a stronger response. We obtained a rank ordering of the real-world distance between the closest and farthest points of images with a recognizable background from 21 nonpatient subjects, using a merge sort procedure (Materials and Methods). For each PHC neuron, we computed the Spearman correlation between the average rankings of the images and the corresponding firing rates and compared the mean of the Fisher-z transformed correlation coefficients against zero with a t test. The relationship between depth and firing rate was highly significant [P < 10−5; = 0.060 (95% confidence interval [CI], 0.035–0.084)] and remained significant when including only persons and animals [P = 0.001; = 0.038 (95% CI 0.018–0.057)].
PHC Responses Are Not Explained by Low-Level Features.
The above analyses indicate that parahippocampal neurons showed strong selectivity for images with greater indications of spatial layout. It is, however, possible that such selectivity could be driven by selectivity for low-level features that were more commonly present in images with spatial layout. To rule out this possibility, we trained a linear support vector machine (SVM) classifier to discriminate images with and without spatial layout based on low-level visual features, using the hierarchical model and X complex 1 (HMAX C1) layer, which is intended to model neural representation at the level of V1 with additional scale invariance (18). For each stimulus, we obtained a specific label for the stimulus, using a classifier trained on the remaining stimuli. This procedure was 89% accurate at reproducing our manual labels, correctly identifying 93% of nonscenes and 71% of scenes. We then computed the mean responses for each of the 630 recorded single and multiunits in PHC for stimuli within four categories: stimuli manually labeled as nonscenes that the classifier also classified as nonscenes (true negatives), stimuli manually labeled as nonscenes that the classifier classified as scenes (false positives), stimuli manually labeled as scenes that the classifier also labeled as scenes (true positives), and stimuli manually labeled as scenes that the classifier labeled as nonscenes (false negatives).
If neurons were more strongly tuned to low-level features than to the presence or absence of spatial layout, we would expect that nonscenes that the classifier incorrectly classified as scenes (false positives) should elicit high response magnitude, whereas scenes that the classifier incorrectly classified as nonscenes (false negatives) should elicit low response magnitude. This was not the case. Instead, false negatives elicited significantly stronger responses than false positives (P < 10−5, paired t test; Fig. S3C). Nonscenes elicited similar responses regardless of the classifier output (P = 0.14), although scenes classified as scenes elicited a slightly stronger response than scenes classified as nonscenes (P = 0.002). Thus, although low-level features may account for some of the scene responsiveness, this analysis indicates that the presence or absence of spatial layout is the primary factor determining the response of parahippocampal neurons. This is furthermore supported by an analysis showing that PHC responses are conditionally independent of the low-level features, given the stimulus category (scene vs. nonscene), as shown in Fig. S4. In addition, the identity of individual landscape stimuli can be decoded from PHC neurons more accurately than from neurons in EC or hippocampus (Fig. S5).
Fig. S4.
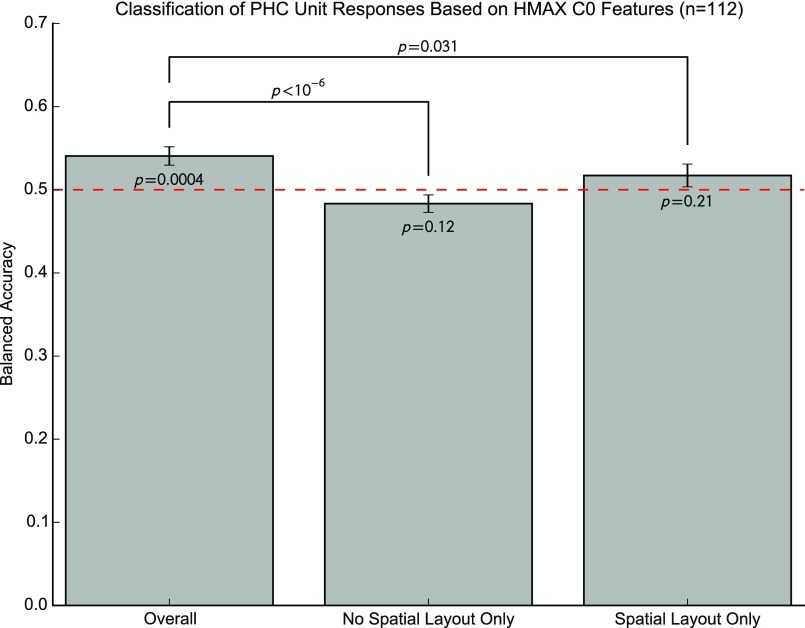
PHC responses are conditionally independent of the low-level features given the stimulus category. For a given unit, we trained the SVM to predict responses based on all but one stimulus from the HMAX C0 features, using cross-validation to select the soft margin parameter C. We then used the classifier to predict whether the unit responded to the left-out stimulus. We repeated this procedure for all possible training/test splits. To perform the cross-validation procedure, it must be possible to split the training set into at least two folds (we used up to five when enough responses were present), so the cell must respond to at least two stimuli in the training set. Because one stimulus was left out of the training set, this implies that the cell must respond to at least three stimuli in total. This restriction left us with 112 units for further analysis. We then computed the balanced accuracy, that is, the mean of the classifier accuracy for stimuli that did and did not elicit responses. Over the entire stimulus set, the SVMs predicted performance slightly but significantly better than chance (balanced accuracy = 0.54; P = 0.0004, one-sample t test). However, SVMs performed at chance level when predicting responses to stimuli with or without spatial layout, as expected if PHC responses are conditionally independent of HMAX features, given the stimulus category (both P > 0.11). Error bars are ±SEM.
Fig. S5.
PHC neurons decode stimulus identity of landscapes more accurately than neurons in hippocampus and entorhinal cortex. We trained SVMs to perform pairwise classification of stimulus identity, using the stimuli and units included in Fig. 2. We trained on five trials and tested on the sixth, for each of the six possible training/test splits. In parahippocampal cortex, the classifier correctly discriminated nearly all landscapes and animals from each other and from other landscapes, but displayed substantially lower performance at distinguishing persons from other persons. Given that parahippocampal neurons respond more strongly to landscapes, it is unsurprising that they convey more information about stimulus identity. Similar results have been reported in other domain-specific regions, including macaque face and scene patches (14, 15). The high performance for animals is likely related to the prevalence of spatial layout cues in these images (Fig. S1). Outside of parahippocampal cortex, classifiers showed substantially lower overall performance for animal and landscape stimuli, and no clear preference for person stimuli.
Neurons Respond Faster to Landscapes.
On average, PHC neurons responded faster to scenes than to nonscenes. A latency measure could be computed for 217 PHC single and multiunits (SI Materials and Methods). In the 121 units responding to at least one scene, the average response latency to scenes was 300 ms, which was significantly faster than the average response latency of 334 ms to persons and animals in the 185 PHC single and multiunits that responded to at least one person or animal (P < 0.001, independent samples unequal variance t test). Among the 89 single and multiunits that responded both to landscapes and to other stimulus categories, the response to landscapes was significantly faster (median difference = 15.8 ± 7.1 ms; P = 0.03, paired samples t test).
Neuronal Scene Responses in the PHC Are Spatially Clustered.
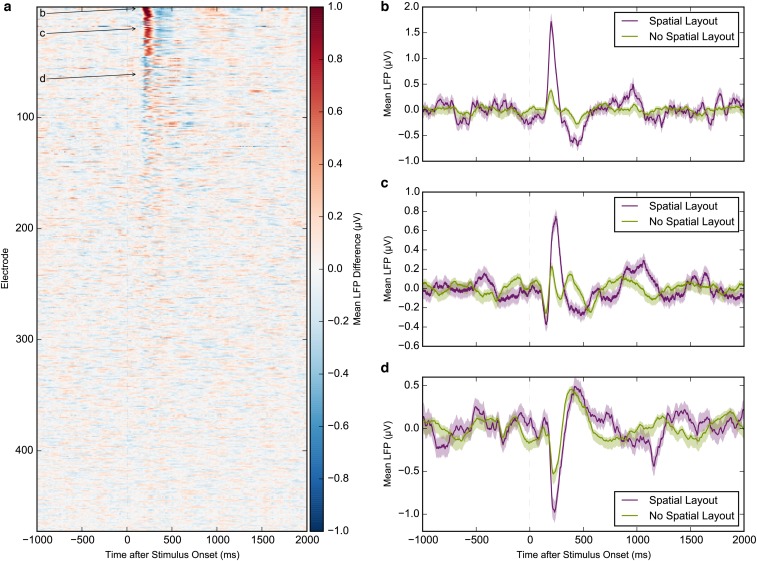
The local field potential (LFP) measures the global activity of neuronal processes around the electrode tip (19, 20). Thus, an electrode located in a scene-selective region can measure a scene-selective LFP. LFPs from 28% (130/472) of PHC microelectrodes showed a significantly different response to images with and without spatial layout (significance threshold, α = 0.01; t test). A significant difference was also visible in the average LFP across all electrodes (Fig. 3D and Fig. S6), with an onset of selectivity around 153 ms and peaking at 243 ms. Of the 168 single and multiunits recorded on these 130 microelectrodes, 43% (n = 73) were also scene-selective (individual units: α = 0.01, Mann–Whitney U test; population: P < 10−6, permutation test; SI Materials and Methods; chance median, 19%). Of the 630 PHC single and multiunits, 119 showed a significant category distinction between average responses to scenes and nonscenes (α = 0.01, Mann–Whitney U test; Fig. S7). Of these, 61% (n = 73) single and multiunits were located on microelectrodes with a scene-selective LFP (P < 10−6, permutation test; chance median, 28%; Fig. S8). In addition, microwire bundles that showed a scene-selective unit on one of the eight microwires had a significantly increased probability of having scene-selective units on the remaining wires (P < 10−6, permutation test; SI Materials and Methods). These results indicate that scene-selective units as well as input signals (LFP) are spatially clustered within subjects, consistent with fMRI selectivity for scenes. Across subjects, no spatial clustering of scene-selective microwire bundles was observed (Fig. S9), which is in line with the interindividual variability of the PPA observed in fMRI studies.
Fig. S6.
LFP responses of individual electrodes contributing to Fig. 3D. (A) Difference between mean LFPs for stimuli with and without spatial layout, sorted by maximum absolute value of Cohen’s d. (B–D) Examples of individual electrodes showing a differential response to stimuli with and without spatial layout. Corresponding rows in A are marked with arrows. Error bars are ±SEM.
Fig. S7.
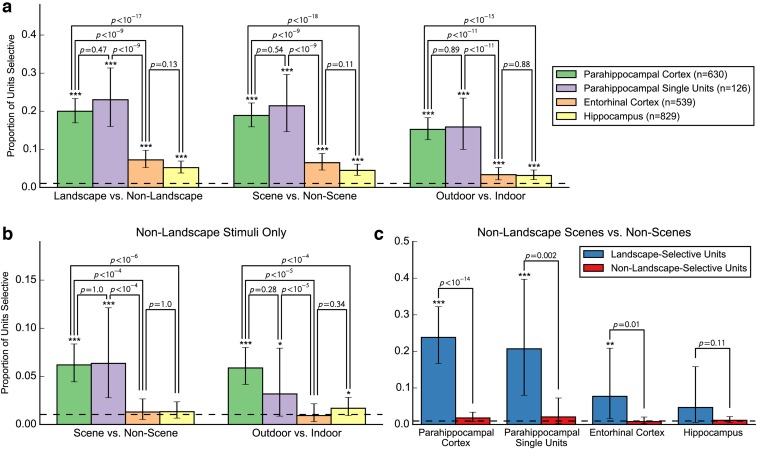
Category preferences at the level of individual units. (A) Proportions of units responding significantly differently to landscapes vs. nonlandscapes, scenes vs. nonscenes, and outdoor vs. indoor stimuli. (B) Proportions of units responding significantly differently to nonlandscape scenes vs. nonscenes and nonlandscape outdoor vs. indoor stimuli. (C) Proportions of units that did (blue) or did not (red) respond significantly differently to landscapes vs. nonlandscapes that responded significantly differently to nonlandscape scenes vs. nonscenes. In all panels, proportions are the proportions of units showing a significant difference between categories according to a Mann–Whitney U across mean responses to each stimulus at α = 0.01. Dotted lines indicate the proportion expected by chance (0.01). Stars indicate proportions that were significantly greater than chance, according to a binomial test (*P < 0.05; **P < 0.01; ***P < 0.001). Error bars are Clopper-Pearson 95% binomial CIs. P values for comparisons between bars are Fisher exact test P values.
Fig. S8.
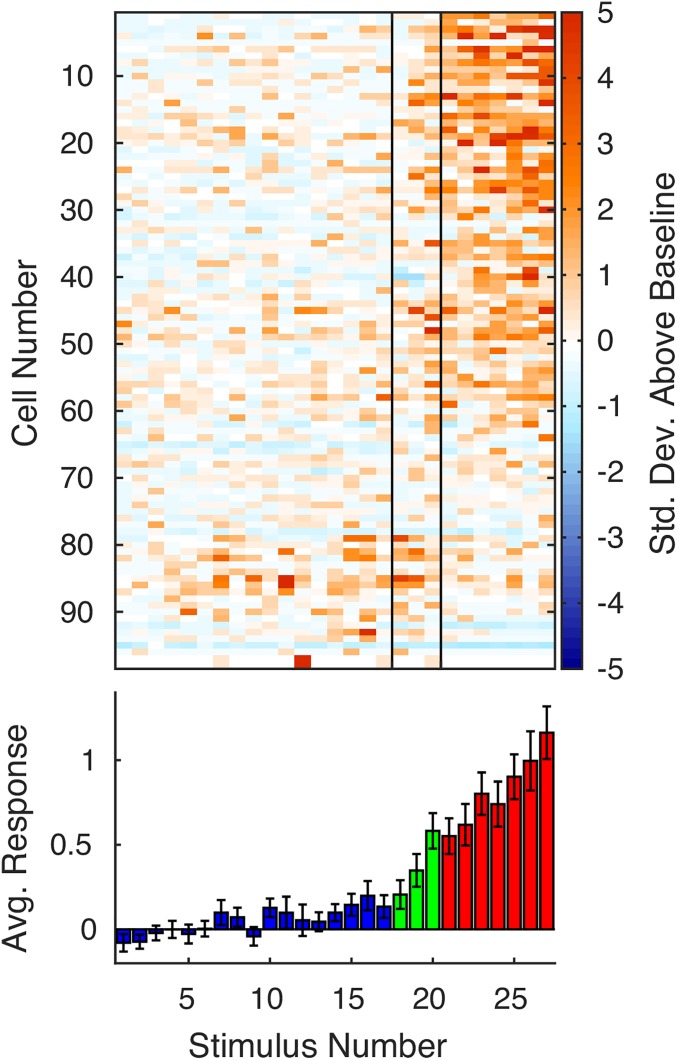
Responses of 98 single and multiunits in parahippocampal cortex on microelectrodes with a scene-selective local field potential to the same stimuli as in Fig. 2.
Fig. S9.
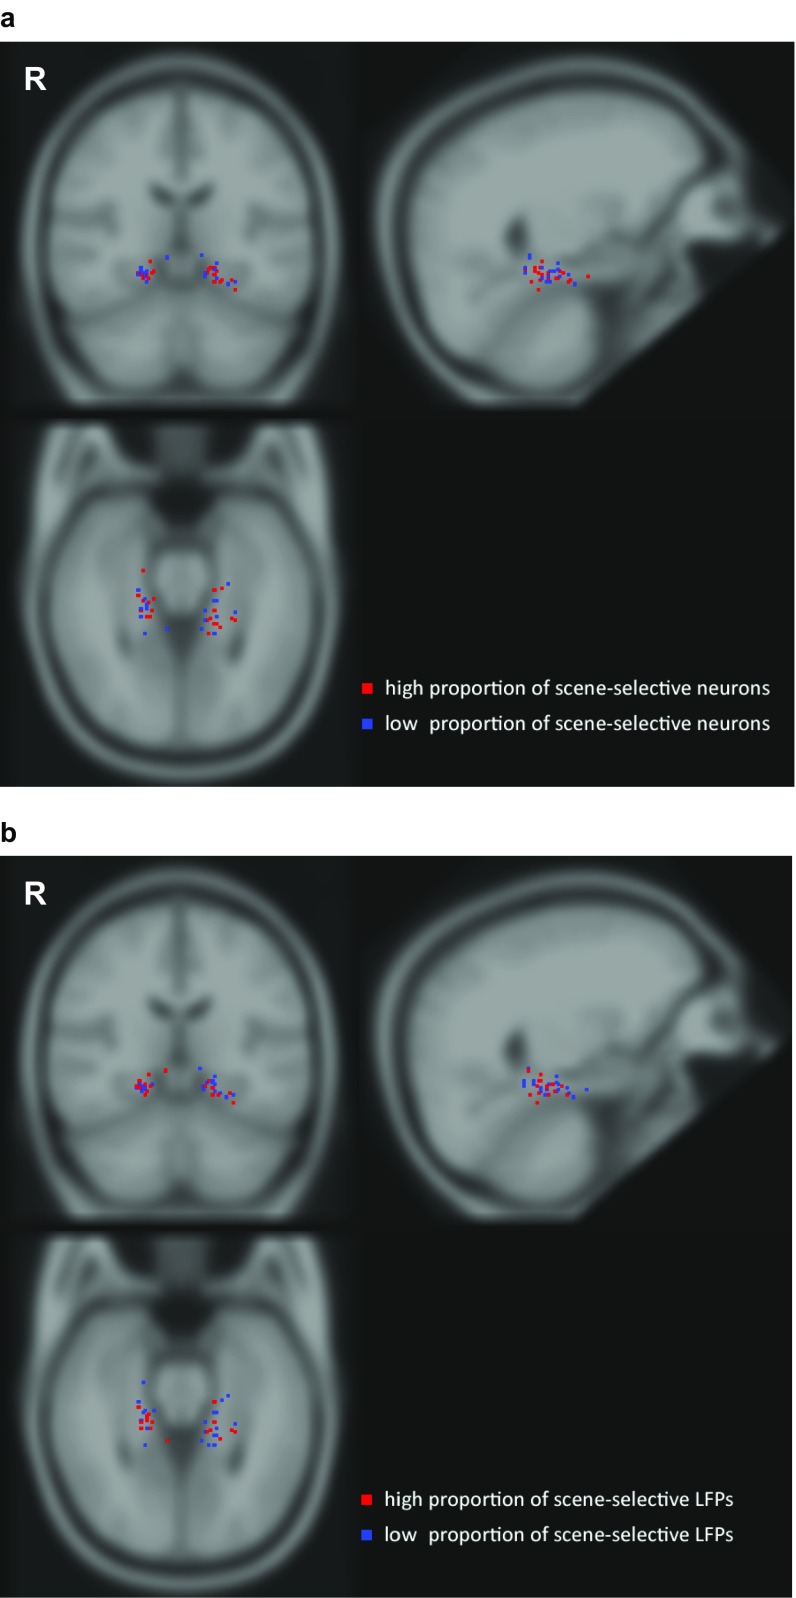
Localization of microwire bundles in PHC showing high and low scene selectivity. The tips of the microwire bundles were localized using a postimplantational CT scan coregistered with a preimplantation MRI scan, and normalized to Montreal Neurological Institute space. (A) Recording sites (i.e., location of bundle tips) projected onto a coronal (Upper left), sagittal (Upper right), and axial (Bottom left) section of the MNI ICBM brain for all 24 subjects. All 37 recording sites were individually verified to be located in PHC. Scene selectivity was quantified as the proportion of neurons showing significant scene/nonscene category distinction (compare Table S1). A median split was performed to distinguish bundles with high and low scene selectivity. (B) Same as A, but showing bundles with high vs. low scene selectivity based on LFPs instead of neurons. R, right. Note the lack of a clear spatial cluster of scene-selective localizations across patients reflecting the well-known interindividual variability across subjects.
Neuronal Scene Responses in the PHC Form a Distributed Code.
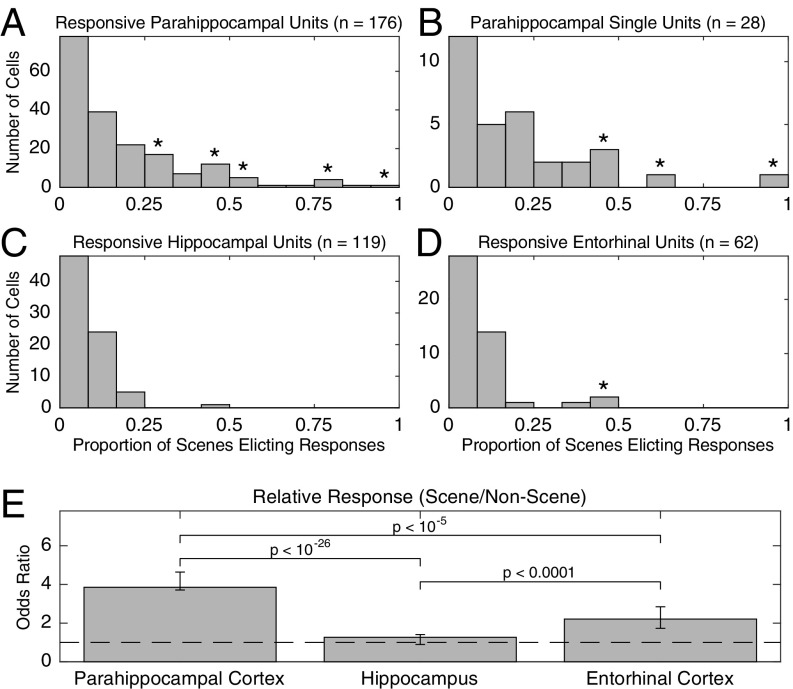
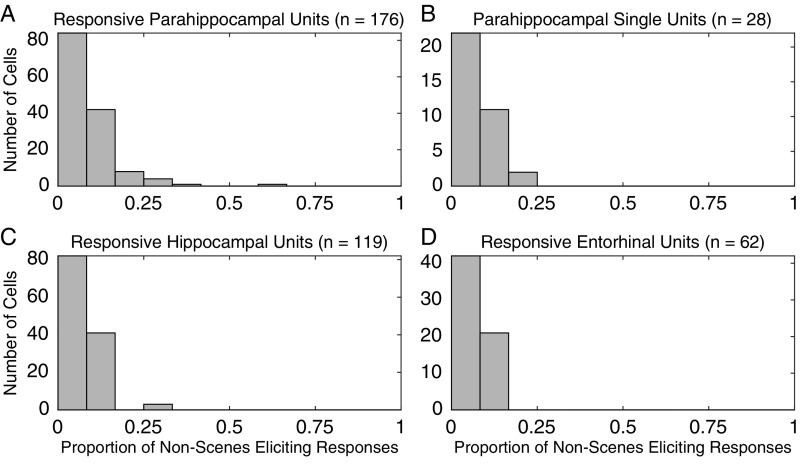
Units that responded to at least one scene often responded to multiple scenes. A total of 176 (28%) of the 630 PHC single and multiunits responded to at least one image with spatial layout (scene). In comparison, on average, 106.6 of 630 PHC units (17%) responded to at least one image without spatial layout (nonscene) when randomly drawing a set of nonscene stimuli equal to the number of scene stimuli (P < 10−6, permutation test; Materials and Methods). Of the 176 scene-responsive units, 49 (28%) responded to at least 25% of scenes (Fig. 4A); in contrast, of the 106.6 units responsive to nonscenes, on average, only 8.3 (7.8%) responded to at least 25% of a matched number of nonscenes (P < 10−6). A comparable effect was present when only single units were included in the analysis (Fig. 4B): of the 22% (28/126) of single units responding to at least one scene, 32% (n = 9) responded to at least 25% of scenes compared with 4.1% responding to 25% of a matched number of nonscenes (P < 10−6). Thus, PHC responses to stimuli with spatial layout were far more distributed than responses in other areas (and to other stimuli; Fig. S10). This category effect was much weaker or not present for the sparser response behavior of entorhinal and hippocampal neurons (Fig. 4 C and D). In the hippocampus, 14% (n = 119) of single and multiunits responded to at least one scene (to nonscenes, 14%; P = 0.31), and of those, 0.84% (n = 1) responded to at least 25% (to nonscenes, 2.41%; P = 0.96), whereas in EC, 12% (n = 62) of units responded to at least one scene (to nonscenes, 7%; P < 10−6), and of those, 4.8% (n = 3) responded to at least 25% (to nonscenes, 0.63%; P = 0.015).
Fig. 4.
Histograms of proportion of scene stimuli (i.e., stimuli possessing spatial layout) eliciting responses in cells responding to at least one scene stimulus for single and multiunits (A) and single units only (B) in PHC, as well as single and multiunits in the hippocampus (C) and EC (D). Asterisks indicate a significant difference (P < 0.05 corrected) from a null distribution, as calculated by drawing, with replacement, a number of nonscene stimuli equal to the number of scene stimuli presented for each session and computing the proportion of stimuli eliciting responses for those nonscene stimuli. (E) Mode of the conditional distribution of the common odds ratio (responsesspatial/nspatial)/(responsesnonspatial/nnonspatial), the number of times more likely a unit is to respond to a stimulus with spatial layout than a stimulus without spatial layout, for units in each region, given the observed responses. Error bars are 95% CIs.
Fig. S10.
Same as Fig. 4 A–D, but for the proportion of nonscenes eliciting responses in units responding to at least one nonscene stimulus.
We additionally computed and compared the odds ratio (OR) of scene to nonscene responses across regions. This ratio measures how much more likely it is that a unit responds to a stimulus with spatial layout than to a stimulus without spatial layout. We found that in both PHC and EC, but not in the hippocampus, the OR was significantly greater than 1, suggesting units were more likely to respond to scene stimuli than nonscene stimuli (PHC: P < 10−135; EC: P < 10−9; hippocampus: P = 0.33, exact test of common odds ratio; Fig. 4E). However, the OR was significantly greater in PHC than in the other two regions (both P < 10−4), indicating that parahippocampal units responded to a greater number of scenes relative to nonscenes compared with units elsewhere in the medial temporal lobe.
These findings show that neurons in PHC respond less selectively within their preferred category (i.e., scenes) than within other categories, as well as less selectively than neurons in hippocampus and EC, indicating a more distributed code for scenes in PHC compared with the sparser code in other MTL areas.
Neuronal Scene Responses in the MTL Are Independent of Familiarity.
Some scenes, such as the picture of Mt. Rushmore in Fig. 1, were previously known to the subjects, whereas others such as the Victorian house were not. To test whether familiarity of scenes had a differential effect on neural responses in different MTL regions, we divided all scenes into the categories previously known vs. previously unknown and compared responsiveness to both categories by computing an OR. We found no significant differences in any of the three regions examined (PHC: P = 0.24; EC: P = 0.13; hippocampus: P = 0.95; exact test of common odds ratio). This is in good agreement with a previous study reporting no difference in the proportion of MTL cells responding to famous vs. unknown landscapes (21).
SI Materials and Methods
Image Classification via Amazon Mechanical Turk.
We collected data for other classifications using Amazon Mechanical Turk. For these classifications, we excluded presented images containing an image of the patient or their family, leaving 572 unique images (consisting of persons, animals, and landscapes). We required that subjects had performed at least 1,000 previous Amazon Mechanical Turk human intelligence tasks, that at least 95% of previous human intelligence tasks were accepted by their requesters, and that participants were located in Australia, Canada, Ireland, New Zealand, the United Kingdom, or the United States. To determine whether images had a background, we asked 27 subjects to sort all images into one of four categories: “no background, or background is solid color or pattern,” “background present but unrecognizable,” “background is clearly visible,” and “no centrally presented object, building, or landmark (only background).” Because the latter category was underrepresented, with only four pictures shown to only one patient, we excluded it from further analysis. The order in which the images were presented was randomized across subjects. We excluded data from two subjects with implausibly low reaction times and from one subject who classified >100 objects as having no centrally presented object, building, or landmark (far more than any other subject), leaving 24 subjects for further analysis. According to the modal rankings across subjects, 237 images had no background, 141 images had an unrecognizable background, and 190 images had a clearly visible background.
To construct a ranking of depth in each of the presented images, we restricted our task to only the 186 images that more subjects had said contained a recognizable background than no background or an unclear background. Our task used a merge sort procedure to construct a ranking of all 186 images based on pairwise comparisons, as described in a previous study (15). For ∼1,100 pairs, 25 subjects saw two simultaneously presented images and were instructed to click the image with the greater distance from the closest to the farthest point in the image. We excluded data from three subjects with implausibly low reaction times and a fourth subject for whom the rankings were uncorrelated with the rankings of all other subjects, leaving 21 subjects for further analysis.
Selection Algorithm for Population Response Plots.
Because stimulus sets were tailored to individual subjects, to compute the population plots shown in Fig. 2 and Figs. S1 and S8, we needed to select a set of stimuli and cells to show in the plot. Our goal here was to find a large set of stimuli, particularly landscapes, that had all been presented to a large number of units recorded in our subjects, particularly PHC units. The problem of selecting k cells such that the number of common stimuli n is maximized is termed the maximum k-intersection problem (52). Because an exact solution is computationally intractable, we used a greedy algorithm to determine the maximal set of parahippocampal units and landscape stimuli presented to them (46). We first selected the complete landscape picture set from the session with the highest yield of parahippocampal units. We then added the session whose landscape picture set produced the largest intersection of landscape stimuli, replaced our previous stimulus set with this intersection, and repeated this procedure until all 67 sessions were included in the intersection set. During each step, we recorded the number of landscape stimuli in the intersection set and the cumulative number of PHC units across sessions these stimuli were presented to. After plotting the number of stimuli against the cumulative number of units, we selected an operating point on this curve by maximizing the product of units times stimuli, resulting in a set of k = 226 parahippocampal units (36 single units and 190 multiunits) that were all presented with the same n = 7 landscape stimuli. The intersection set of stimuli for these sessions also included 20 additional pictures showing persons and animals. In addition to the 226 parahippocampal units, these 27 stimuli had also been presented to 231 hippocampal single and multiunits and 286 entorhinal single and multiunits. No additional selection criterion was applied; in particular, units were not required to be responsive to the presented stimuli. We used this set of 27 stimuli presented to a total of 743 MTL units to generate all population plots (Fig. 2 and Figs. S1 and S8).
Calculation of Response Onset Latencies.
The latencies of PHC units responding to pictures from different categories were calculated using Poisson spike train analysis. For this procedure, the ISIs of a given unit are processed continuously during the entire recording session, and the onset of a spike train is detected on the basis of its deviation from a baseline exponential distribution of ISIs. For each response-eliciting stimulus, we determined the time between stimulus onset and the onset of the first spike train in all six image presentations. Only spike train onsets within the first 1,000 ms after stimulus onset were considered. The median length of these six time intervals was taken as response latency. For sparsely firing units with mean baseline firing activity of <2 Hz, Poisson spike train analysis generally failed to pick up a reliable onset; thus, we used the median latency of the first spike during stimulus presentation instead. For neurons responding to more than one stimulus from a given category, the median of the different stimulus latencies was taken for each category. Whenever the four median onset times of a response did not fall within 200 ms, as in previous studies (25, 46), this response was excluded from further analysis.
Spatial Clustering of Scene-Selective Units.
For each scene-selective parahippocampal unit (i.e., for each unit responding to at least one stimulus with spatial layout), we determined the proportion of other units on the same bundle of microwires that showed significant scene-selective responses. We then averaged these proportions across all scene-selective parahippocampal units and compared this value against a distribution of 1,000,000 realizations in which we randomly permuted the bundle labels for every unit. This procedure yielded a probability of 52% of finding additional scene-selective responses on a parahippocampal wire bundle vs. an average of 28% for the permuted realizations, which was significant at P < 10−6 (permutation test). To rule out any bias potentially caused by subjects with exceptionally high responsiveness to scenes, we repeated the permutation test, but allowed permutation of bundle labels only within, not across, patients. This test confirmed significant spatial clustering at P = 0.006.
Discussion
Our results provide insight into how the human PHC encodes space at the level of individual neurons. The population response was significantly stronger to images that represent space than to images that do not, providing further evidence for correspondence between functional imaging and electrophysiology. PHC neurons prefer landscapes over persons and animals, but even among persons and animals, they prefer outdoor over indoor pictures, and even among these indoor pictures, stimuli with spatial layout are preferred over those without. Furthermore, PHC neurons were found to respond faster to landscapes than to other stimulus categories, indicating a facilitated processing of this stimulus class. In line with results obtained with fMRI and iEEG (1, 2, 5), comparison of LFP and unit responses indicated that scene-selective units were spatially clustered. Furthermore, we observed a distributed code in PHC, one in which the typical responsive unit was relatively specific to scenes in general, but not to any one particular scene, whereas, for example, in the hippocampus, a much sparser code was observed, one in which the typical responsive unit was not specific to scenes in general, but was specific to one particular image.
The scene-selective population response observed at the macroscopic level by fMRI could in principle be produced by three different types of single neuron selectivity profiles. First, units could exhibit sparse responses, each tuned to relatively few individual scenes, similar to the semantically invariant neurons observed in the human medial temporal lobe (13). In this case, the scene-selective responses observed macroscopically would reflect the spatial average of neurons with different responses. Second, each unit could be scene-selective, but respond to many scenes, thus representing a distributed code, as found in macaque face and scene patches (14, 15). Third, units might represent conjunctions of low-level features more prevalent in scene than in nonscene stimuli, such that population activity to scenes exceeds that to nonscenes.
The parahippocampal neurons analyzed in this study, similar to neurons in macaque scene areas (15), but unlike the sparse neurons elsewhere in the human medial temporal lobe (13), showed characteristics of a more distributed code (units that responded to one scene stimulus often responded to many), and these responses could not be attributed to low-level visual features, as established with the analysis using a feature classifier (the HMAX model). The second scenario described here therefore seems most realistic. Of note, a recent study reported a more distributed code for representation of visual stimuli in the human hippocampus (22). This study, however, used a less conservative response criterion, thus trading response selectivity for sensitivity, and contained no comparison with PHC representations.
Our study builds on previous intracranial studies of neural activity in human PHC. Although Ekstrom et al. (23) found no location selectivity in parahippocampal neurons during virtual navigation, they found that 15% of parahippocampal single and multiunits responded to views of shops in the environment vs. <5% in the hippocampus, amygdala, and frontal lobes. Several studies have reported stronger broadband gamma activity in human PHC to scenes vs. objects and earlier selectivity for scenes than for buildings (2, 5), but these studies recorded neural activity using macroelectrodes instead of microwires, and thus could not characterize the responses of individual neurons. Finally, Kraskov et al. (24) previously investigated the selectivity of spikes and LFPs across several medial temporal lobe regions, including the parahippocampal gyrus. However, they reported no parahippocampal electrodes with scene-selective LFPs, and few scene-selective units. Because the number of parahippocampal electrodes analyzed was small, it is possible that most or all were outside of the parahippocampal place area.
The response onset latencies of PHC neurons of ∼300 ms are similar to those reported previously (25) and are substantially shorter than those found in other MTL regions such as EC, hippocampus, and amygdala. In addition, this onset of neuronal firing occurs on average well after the peaking of the evoked LFP response at 243 ms, and even longer after the onset of selectivity in the LFP response at 153 ms. This difference in response latency between unit activity and LFP confirms the notion that neuronal action potentials represent the output activity of a neuron, whereas the LFP represents postsynaptic input activity and ongoing neuronal processing (20). These findings are in line with previous reports that LFP responses precede the onset of single-cell firing in the human MTL (26).
Our results demonstrate that a substantial proportion of PHC neurons respond not just to one scene but to multiple different scenes. This contrasts with neurons in other human MTL subregions, which, in this study and others (27, 25, 28), have been shown to exhibit much sparser responses. Because previous studies have shown that neurons in other MTL subregions show a high degree of invariance to specific concepts, it is natural to ask whether neurons in PHC, despite responding to a large number of scenes, might nonetheless encode the locations depicted in an invariant manner. Because we did not present the same scenes from multiple viewpoints, our data cannot rule out this possibility. However, fMRI studies have reported that activation in PHC is suppressed by repeated presentation of the same scene, but not when the same location is repeatedly presented from different viewpoints (29, 30). Assuming that fMRI adaptation measures underlying neural selectivity (ref. 31, but see ref. 32), these results suggest that most scene-selective PHC neurons do not respond invariantly to the same scene. Moreover, previous human single-neuron studies have shown that parahippocampal neurons exhibit little or no location selectivity during virtual navigation (23, 33). Thus, available evidence indicates that scene representations in the PHC are neither as sparse nor as invariant as responses elsewhere in the MTL. It is, however, possible that PHC neurons possess some invariance to individual features, if not to individual locations.
Given the well-established role of the MTL in declarative memory (34) it is plausible to postulate that the PHC responses described in this study may have a relatively distributed code of space/location to provide contextual information to more specific items and associations coded in neurons higher up within the hierarchical structure of the MTL, in the hippocampus and EC. This notion is further supported by the fact that PHC is one of the primary inputs to EC and one of few cortical areas that project directly to the hippocampus (35). This denser distributed code may be necessary to rapidly form memories and contextual associations in novel environments. Given that scenes are defined by conjunctions of many features, it is implausible that the brain could possess sparse representations that are selectively and invariantly tuned to previously unseen environments. Moreover, rapidly forming such representations by integrating responses of neurons that respond sparsely to individual features would require a very high degree of connectivity. Instead, the brain may form sparse representations by integrating responses of neurons that respond to many features, but that are tuned along feature dimensions relevant to distinguishing scenes rather than to low-level features. In line with this hypothesis, the primary deficit observed in parahippocampal lesion patients is inability to navigate in novel environments (3, 4). This denser distributed representation may similarly be useful in forming novel contextual associations, a process in which the PHC has been shown to be involved (36–39).
The absence of a region-wide category preference in hippocampus and entorhinal cortex can in principle be attributed to their sparse and invariant representation (40). However, studies with a larger number of categories (compared with only landscapes, animals, and persons, as used here) might be necessary to rule out the presence of category preferences in these areas. In particular, functional imaging studies have shown that perirhinal and entorhinal cortex is preferentially activated by objects (41), a stimulus category underrepresented in this study.
Although our study gives insight into how individual neurons represent aspects of scenes, its retrospective nature makes it difficult to determine their exact nature. In accordance with neuroimaging studies, we show that single neurons in PHC responded more strongly to landscapes, outdoor scenes, images with spatial cues, images with a clearly recognizable background, images with greater depth, and larger real-world landmarks. However, our data are insufficient to determine what exactly about these images and features evokes a response in PHC neurons. fMRI studies suggest a wealth of parameters these neurons might encode, including scene category (42), spatial expanse (43, 6), texture (44), and clutter (11). Further studies will be necessary to determine the specific features to which individual PHC neurons are selective, and the role of these features in navigation and memory.
Materials and Methods
Subjects and Recordings.
Twenty-four subjects undergoing treatment for pharmacologically intractable epilepsy were implanted with chronic depth electrodes (Fig. S9) to localize the epileptogenic focus for possible clinical resection (45). All studies conformed to the guidelines of the Medical Institutional Review Board of the University of California, Los Angeles, and the Institutional Review Board of California Institute of Technology. Informed written consent was obtained from each subject. Recordings were obtained from a bundle of nine microwires (eight high-impedance recording electrodes, one low-impedance reference) protruding from the end of each depth electrode. The voltage differences between the recording and reference electrodes were amplified, band-pass filtered from 1 to 9,000 Hz, and sampled at 28 kHz, using a Neuralynx Cheetah system. These recordings were stored digitally for further analysis. During each of 67 recording sessions, 23–190 images (median, 100; interquartile range, 95–124.5) were presented six times in pseudorandom order on a laptop computer, as described previously (13, 25, 46), while subjects sat comfortably in bed. Each image was presented for 1 s, at a random interspike interval (ISI) no less than 1.5 s, and subtended a visual angle of ∼5 degrees. To maintain attention, after image offset, subjects were ask to press the Y or N key on the keyboard to signal whether or not the presented image contained a face. Stimulus sets were composed of persons (grand average 75%), animals (9%), landscapes (13%), and stimuli from other categories (3%). Around 23% of the landscape pictures depicted contents the subjects had never seen before, whereas the others contained familiar landmarks and landscapes.
Image Classification.
Before analysis, the authors categorized the types of all stimuli (747 pictures in total) and whether the pictures were indoors or outdoors. Stimuli were categorized as persons, animals, landscapes (with and without buildings; i.e., including landmarks), cartoons, food, abstract, or other. The latter four categories consisted of only a small number of stimuli and were excluded from further analysis. Indoor/outdoor discrimination was based on the visual properties of the image, and ambiguous cases were excluded from the analysis of this attribute. Spatial layout was defined as presence of elements relevant to navigation, such as topographical continuities in walls, room corners, and horizon lines. Because this distinction is sometimes ambiguous, one of the authors (S. Kornblith) and three additional individuals unrelated to this study also classified all images as possessing or not possessing spatial layout, blind to the neural responses to these stimuli. Three or more ratings agreed for 94% of stimuli. The remaining stimuli were excluded from analyses of spatial layout. Data for other classifications was collected using Amazon Mechanical Turk (SI Materials and Methods).
Population Response Plots.
Because composition of the stimulus sets varied across patients and sessions, we used an automated, objective algorithm (SI Materials and Methods) to determine a set of 27 stimuli that had all been presented to the same 743 units to generate Fig. 2 and Figs. S1 and S8.
Spike Detection, Sorting, and Response Magnitude.
After data collection, the signal recorded from the microelectrodes was band-pass filtered between 300 and 3,000 Hz and notch filtered at 2,000 Hz to remove artifacts produced by the clinical EEG system. The wave_clus software package was used to perform automated spike detection and sorting (47). To assess responsiveness, we calculated the average firing rate in the periods from 600 to 200 ms before stimulus onset (the baseline period) and from 200 to 600 ms after stimulus onset (the stimulus period). To measure the average population response of parahippocampal neurons, for each unit and stimulus, we computed a z-score-like normalized response as [mean(stimulus) − mean(baseline)]/standard deviation(baseline). We then averaged responses across units by stimulus category to yield the response magnitude values shown in Fig. 3 B and C. For the comparison between different MTL regions in Fig. 3A, we used wider periods from 1,000 to 0 ms before stimulus onset and from 0 to 1,000 ms after stimulus onset as the baseline and stimulus period, respectively, as average response latencies in EC and the hippocampus have been shown to be significantly longer than in PHC (25).
Response Onset Latencies.
The latencies of PHC units responding to pictures from different categories were calculated using Poisson spike train analysis, as described in our earlier work (25). A detailed description of this procedure is given in the SI Materials and Methods. To compare latencies for two stimulus categories, we applied two different tests. First, we used an independent-sample unequal-variance t test to compare the groups of cells responding to each category. If a cell responded to both categories, then the median response latency for each category was used in each group. Second, we selected all cells that responded to both categories and ran a paired-sample Wilcoxon signed-rank test on these cells to compare response latencies.
Local Field Potentials.
LFPs were band-pass filtered between 1 and 100 Hz and notch filtered at 60 Hz (4 Hz bandwidth) before downsampling to 365.5 Hz, using second-order Butterworth filters in the forward and reverse directions. To compute the average normalized LFP, we computed the trial-averaged response of each channel to stimuli with and without spatial layout and divided the result by the pooled SD of the 1-s interval before stimulus onset, and then averaged the per condition channel means across all channels. Population LFP selectivity to spatial layout was tested by averaging the response of each microelectrode across images with and without spatial layout and performing a paired t test at each of the 1,096 points in the interval from 1 s before stimulus onset to 2 s after. Selectivity in individual LFPs was determined by a two-sample t test, comparing the LFP amplitude for stimuli with and without spatial layout at each of the 365 points in the 1-s interval after stimulus onset. In both cases, to be considered significant, the LFP amplitude had to differ significantly between the two stimulus groups at a threshold of P < 0.05 after Holm-Bonferroni correction. To assess the spatial layout selectivity of individual units for comparison with the selectivity of the LFP and for computation of the spatial clustering statistic below, for each unit, we performed a Mann–Whitney U test on the firing rates during the interval from 200 to 600 ms after stimulus onset.
Proportion of Stimuli Eliciting a Response.
The proportion of stimuli that elicited a response (PSER) was computed by dividing the number of stimuli eliciting a response according to the response criterion described earlier within a given category by the total number of images within the category. Because all sessions contained more images without spatial layout than with spatial layout, naive calculation of the PSER for images with and without spatial layout would lead to indices with different distributions, thus clouding interpretation. To make the indices directly comparable, for each cell, we computed the PSER for images with spatial layout and then randomly drew an equal number of images without spatial layout with replacement and computed a PSER for images without spatial layout based on this reduced set. Proportions of stimuli eliciting a response for matched numbers of nonscene stimuli and the null distribution, shown in Fig. S10, are based on 1,000,000 applications of this procedure. Because most cells did not respond to most stimuli, responses are rare events, and standard logistic regression is not applicable. Instead, we determined the conditional distribution of the common OR by convolving the corresponding hypergeometric distributions and found the corresponding confidence intervals by using a root solver (48). We then computed the mode of the conditional distribution. This procedure gives an estimate of the common OR, as well as exact CIs.
Analysis of Low-Level Features.
We computed the response of the HMAX C1 layer to each stimulus in our stimulus set, using the Cortical Network Stimulator package (49). Features were extracted from the original 160 × 160-pixel images presented at each subject at nine different scales, using the parameters described in Mutch and Lowe (50). After extracting the features, we trained a linear support vector machine on all but one stimulus and tested the remaining stimulus for each stimulus in our stimulus set. We used LIBLINEAR to train support vector machines (51), selected the regularization parameter C using 10-fold cross validation for each SVM trained, and inversely weighted training exemplars according to proportion in each category.
Acknowledgments
We thank all our subjects for their participation; E. Behnke, T. Fields, E. Ho, V. Isiaka, E. Isham, K. Laird, N. Parikshak, and A. Postolova for technical assistance with the recordings; and D. Tsao for useful discussion. This research was supported by grants from the Volkswagen Foundation (Lichtenberg Program), the German Research Council (DFG MO930/4-1 and SFB 1089), the National Institute of Neurological Disorders and Stroke, the G. Harold and Leila Y. Mathers Foundation, the Gimbel Discovery Fund, the Dana Foundation, the Human Frontiers Science Program, and a National Science Foundation Graduate Research Fellowship (to S. Kornblith).
Footnotes
The authors declare no conflict of interest.
This article is a PNAS Direct Submission.
This article contains supporting information online at www.pnas.org/lookup/suppl/doi:10.1073/pnas.1608159113/-/DCSupplemental.
References
- 1.Epstein R, Kanwisher N. A cortical representation of the local visual environment. Nature. 1998;392(6676):598–601. doi: 10.1038/33402. [DOI] [PubMed] [Google Scholar]
- 2.Bastin J, et al. Temporal components in the parahippocampal place area revealed by human intracerebral recordings. J Neurosci. 2013;33(24):10123–10131. doi: 10.1523/JNEUROSCI.4646-12.2013. [DOI] [PMC free article] [PubMed] [Google Scholar]
- 3.Aguirre GK, D’Esposito M. Topographical disorientation: A synthesis and taxonomy. Brain. 1999;122(Pt 9):1613–1628. doi: 10.1093/brain/122.9.1613. [DOI] [PubMed] [Google Scholar]
- 4.Epstein R, Deyoe EA, Press DZ, Rosen AC, Kanwisher N. Neuropsychological evidence for a topographical learning mechanism in parahippocampal cortex. Cogn Neuropsychol. 2001;18(6):481–508. doi: 10.1080/02643290125929. [DOI] [PubMed] [Google Scholar]
- 5.Mégevand P, et al. Seeing scenes: Topographic visual hallucinations evoked by direct electrical stimulation of the parahippocampal place area. J Neurosci. 2014;34(16):5399–5405. doi: 10.1523/JNEUROSCI.5202-13.2014. [DOI] [PMC free article] [PubMed] [Google Scholar]
- 6.Harel A, Kravitz DJ, Baker CI. Deconstructing visual scenes in cortex: Gradients of object and spatial layout information. Cereb Cortex. 2013;23(4):947–957. doi: 10.1093/cercor/bhs091. [DOI] [PMC free article] [PubMed] [Google Scholar]
- 7.Cate AD, Goodale MA, Köhler S. The role of apparent size in building- and object-specific regions of ventral visual cortex. Brain Res. 2011;1388:109–122. doi: 10.1016/j.brainres.2011.02.022. [DOI] [PubMed] [Google Scholar]
- 8.Konkle T, Oliva A. A real-world size organization of object responses in occipitotemporal cortex. Neuron. 2012;74(6):1114–1124. doi: 10.1016/j.neuron.2012.04.036. [DOI] [PMC free article] [PubMed] [Google Scholar]
- 9.Mullally SL, Maguire EA. A new role for the parahippocampal cortex in representing space. J Neurosci. 2011;31(20):7441–7449. doi: 10.1523/JNEUROSCI.0267-11.2011. [DOI] [PMC free article] [PubMed] [Google Scholar]
- 10.Amit E, Mehoudar E, Trope Y, Yovel G. Do object-category selective regions in the ventral visual stream represent perceived distance information? Brain Cogn. 2012;80(2):201–213. doi: 10.1016/j.bandc.2012.06.006. [DOI] [PubMed] [Google Scholar]
- 11.Park S, Konkle T, Oliva A. Parametric Coding of the Size and Clutter of Natural Scenes in the Human Brain. Cereb Cortex. 2015;25(7):1792–1805. doi: 10.1093/cercor/bht418. [DOI] [PMC free article] [PubMed] [Google Scholar]
- 12.Logothetis NK. What we can do and what we cannot do with fMRI. Nature. 2008;453(7197):869–878. doi: 10.1038/nature06976. [DOI] [PubMed] [Google Scholar]
- 13.Quiroga RQ, Reddy L, Kreiman G, Koch C, Fried I. Invariant visual representation by single neurons in the human brain. Nature. 2005;435(7045):1102–1107. doi: 10.1038/nature03687. [DOI] [PubMed] [Google Scholar]
- 14.Tsao DY, Freiwald WA, Tootell RBH, Livingstone MS. A cortical region consisting entirely of face-selective cells. Science. 2006;311(5761):670–674. doi: 10.1126/science.1119983. [DOI] [PMC free article] [PubMed] [Google Scholar]
- 15.Kornblith S, Cheng X, Ohayon S, Tsao DY. A network for scene processing in the macaque temporal lobe. Neuron. 2013;79(4):766–781. doi: 10.1016/j.neuron.2013.06.015. [DOI] [PMC free article] [PubMed] [Google Scholar]
- 16.Eichenbaum H, Yonelinas AP, Ranganath C. The medial temporal lobe and recognition memory. Annu Rev Neurosci. 2007;30:123–152. doi: 10.1146/annurev.neuro.30.051606.094328. [DOI] [PMC free article] [PubMed] [Google Scholar]
- 17.Rolls ET. The mechanisms for pattern completion and pattern separation in the hippocampus. Front Syst Neurosci. 2013;7:74. doi: 10.3389/fnsys.2013.00074. [DOI] [PMC free article] [PubMed] [Google Scholar]
- 18.Riesenhuber M, Poggio T. Hierarchical models of object recognition in cortex. Nat Neurosci. 1999;2(11):1019–1025. doi: 10.1038/14819. [DOI] [PubMed] [Google Scholar]
- 19.Buzsáki G, Anastassiou CA, Koch C. The origin of extracellular fields and currents--EEG, ECoG, LFP and spikes. Nat Rev Neurosci. 2012;13(6):407–420. doi: 10.1038/nrn3241. [DOI] [PMC free article] [PubMed] [Google Scholar]
- 20.Mitzdorf U. Current source-density method and application in cat cerebral cortex: Investigation of evoked potentials and EEG phenomena. Physiol Rev. 1985;65(1):37–100. doi: 10.1152/physrev.1985.65.1.37. [DOI] [PubMed] [Google Scholar]
- 21.Viskontas IV, Quiroga RQ, Fried I. Human medial temporal lobe neurons respond preferentially to personally relevant images. Proc Natl Acad Sci USA. 2009;106(50):21329–21334. doi: 10.1073/pnas.0902319106. [DOI] [PMC free article] [PubMed] [Google Scholar]
- 22.Valdez AB, et al. Distributed representation of visual objects by single neurons in the human brain. J Neurosci. 2015;35(13):5180–5186. doi: 10.1523/JNEUROSCI.1958-14.2015. [DOI] [PMC free article] [PubMed] [Google Scholar]
- 23.Ekstrom AD, et al. Cellular networks underlying human spatial navigation. Nature. 2003;425(6954):184–188. doi: 10.1038/nature01964. [DOI] [PubMed] [Google Scholar]
- 24.Kraskov A, Quiroga RQ, Reddy L, Fried I, Koch C. Local field potentials and spikes in the human medial temporal lobe are selective to image category. J Cogn Neurosci. 2007;19(3):479–492. doi: 10.1162/jocn.2007.19.3.479. [DOI] [PubMed] [Google Scholar]
- 25.Mormann F, et al. Latency and selectivity of single neurons indicate hierarchical processing in the human medial temporal lobe. J Neurosci. 2008;28(36):8865–8872. doi: 10.1523/JNEUROSCI.1640-08.2008. [DOI] [PMC free article] [PubMed] [Google Scholar]
- 26.Rey HG, Fried I, Quian Quiroga R. Timing of single-neuron and local field potential responses in the human medial temporal lobe. Curr Biol. 2014;24(3):299–304. doi: 10.1016/j.cub.2013.12.004. [DOI] [PMC free article] [PubMed] [Google Scholar]
- 27.Waydo S, Kraskov A, Quian Quiroga R, Fried I, Koch C. Sparse representation in the human medial temporal lobe. J Neurosci. 2006;26(40):10232–10234. doi: 10.1523/JNEUROSCI.2101-06.2006. [DOI] [PMC free article] [PubMed] [Google Scholar]
- 28.Ison MJ, et al. Selectivity of pyramidal cells and interneurons in the human medial temporal lobe. J Neurophysiol. 2011;106(4):1713–1721. doi: 10.1152/jn.00576.2010. [DOI] [PMC free article] [PubMed] [Google Scholar]
- 29.Epstein R, Graham KS, Downing PE. Viewpoint-specific scene representations in human parahippocampal cortex. Neuron. 2003;37(5):865–876. doi: 10.1016/s0896-6273(03)00117-x. [DOI] [PubMed] [Google Scholar]
- 30.Park S, Chun MM. Different roles of the parahippocampal place area (PPA) and retrosplenial cortex (RSC) in panoramic scene perception. Neuroimage. 2009;47(4):1747–1756. doi: 10.1016/j.neuroimage.2009.04.058. [DOI] [PMC free article] [PubMed] [Google Scholar]
- 31.Grill-Spector K, Malach R. fMR-adaptation: A tool for studying the functional properties of human cortical neurons. Acta Psychol (Amst) 2001;107(1-3):293–321. doi: 10.1016/s0001-6918(01)00019-1. [DOI] [PubMed] [Google Scholar]
- 32.Sawamura H, Orban GA, Vogels R. Selectivity of neuronal adaptation does not match response selectivity: A single-cell study of the FMRI adaptation paradigm. Neuron. 2006;49(2):307–318. doi: 10.1016/j.neuron.2005.11.028. [DOI] [PubMed] [Google Scholar]
- 33.Miller JF, et al. Neural activity in human hippocampal formation reveals the spatial context of retrieved memories. Science. 2013;342(6162):1111–1114. doi: 10.1126/science.1244056. [DOI] [PMC free article] [PubMed] [Google Scholar]
- 34.Squire LR, Stark CEL, Clark RE. The medial temporal lobe. Annu Rev Neurosci. 2004;27:279–306. doi: 10.1146/annurev.neuro.27.070203.144130. [DOI] [PubMed] [Google Scholar]
- 35.Suzuki WA, Amaral DG. Cortical inputs to the CA1 field of the monkey hippocampus originate from the perirhinal and parahippocampal cortex but not from area TE. Neurosci Lett. 1990;115(1):43–48. doi: 10.1016/0304-3940(90)90515-b. [DOI] [PubMed] [Google Scholar]
- 36.Aminoff E, Gronau N, Bar M. The parahippocampal cortex mediates spatial and nonspatial associations. Cereb Cortex. 2007;17(7):1493–1503. doi: 10.1093/cercor/bhl078. [DOI] [PubMed] [Google Scholar]
- 37.Buffalo EA, Bellgowan PSF, Martin A. Distinct roles for medial temporal lobe structures in memory for objects and their locations. Learn Mem. 2006;13(5):638–643. doi: 10.1101/lm.251906. [DOI] [PMC free article] [PubMed] [Google Scholar]
- 38.Ison MJ, Quian Quiroga R, Fried I. Rapid encoding of new memories by individual neurons in the human brain. Neuron. 2015;87(1):220–230. doi: 10.1016/j.neuron.2015.06.016. [DOI] [PMC free article] [PubMed] [Google Scholar]
- 39.Law JR, et al. Functional magnetic resonance imaging activity during the gradual acquisition and expression of paired-associate memory. J Neurosci. 2005;25(24):5720–5729. doi: 10.1523/JNEUROSCI.4935-04.2005. [DOI] [PMC free article] [PubMed] [Google Scholar]
- 40.Quian Quiroga R, Kraskov A, Koch C, Fried I. Explicit encoding of multimodal percepts by single neurons in the human brain. Curr Biol. 2009;19(15):1308–1313. doi: 10.1016/j.cub.2009.06.060. [DOI] [PMC free article] [PubMed] [Google Scholar]
- 41.Litman L, Awipi T, Davachi L. Category-specificity in the human medial temporal lobe cortex. Hippocampus. 2009;19(3):308–319. doi: 10.1002/hipo.20515. [DOI] [PMC free article] [PubMed] [Google Scholar]
- 42.Walther DB, Caddigan E, Fei-Fei L, Beck DM. Natural scene categories revealed in distributed patterns of activity in the human brain. J Neurosci. 2009;29(34):10573–10581. doi: 10.1523/JNEUROSCI.0559-09.2009. [DOI] [PMC free article] [PubMed] [Google Scholar]
- 43.Kravitz DJ, Peng CS, Baker CI. Real-world scene representations in high-level visual cortex: It’s the spaces more than the places. J Neurosci. 2011;31(20):7322–7333. doi: 10.1523/JNEUROSCI.4588-10.2011. [DOI] [PMC free article] [PubMed] [Google Scholar]
- 44.Cant JS, Goodale MA. Scratching beneath the surface: New insights into the functional properties of the lateral occipital area and parahippocampal place area. J Neurosci. 2011;31(22):8248–8258. doi: 10.1523/JNEUROSCI.6113-10.2011. [DOI] [PMC free article] [PubMed] [Google Scholar]
- 45.Fried I, MacDonald KA, Wilson CL. Single neuron activity in human hippocampus and amygdala during recognition of faces and objects. Neuron. 1997;18(5):753–765. doi: 10.1016/s0896-6273(00)80315-3. [DOI] [PubMed] [Google Scholar]
- 46.Mormann F, et al. A category-specific response to animals in the right human amygdala. Nat Neurosci. 2011;14(10):1247–1249. doi: 10.1038/nn.2899. [DOI] [PMC free article] [PubMed] [Google Scholar]
- 47.Quiroga RQ, Nadasdy Z, Ben-Shaul Y. Unsupervised spike detection and sorting with wavelets and superparamagnetic clustering. Neural Comput. 2004;16(8):1661–1687. doi: 10.1162/089976604774201631. [DOI] [PubMed] [Google Scholar]
- 48.Vollset SE, Hirji KF, Elashoff RM. Fast computation of exact confidence limits for the common odds ratio in a series of 2 × 2 tables. J Am Stat Assoc. 1991;86(414):404–409. [Google Scholar]
- 49.Mutch J, Knoblich U, Poggio T. 2010 CNS: A GPU-based framework for simulating cortically-organized networks (MIT CSAIL). Available at dspace.mit.edu/handle/1721.1/51839. Accessed May 17, 2013.
- 50.Mutch J, Lowe DG. Proceedings of the IEEE Computer Society Conference on Computer Vision and Pattern Recognition. IEEE; Washington, DC: 2006. Multiclass object recognition with sparse, localized features; pp. 11–18. [Google Scholar]
- 51.Fan R-E, Chang K-W, Hsieh C-J, Wang X-R, Lin C-J. LIBLINEAR: A library for large linear classification. J Mach Learn Res. 2008;9:1871–1874. [Google Scholar]
- 52.Vinterbo SA. Maximum k-Intersection, Edge Labeled Multigraph Max Capacity k-Path, and Max Factor k-gcd Are All NP-Hard. Decision Systems Group, Brigham and Women’s Hospital; Boston: 2002. Decision System Group Technical Report 2002/12. [Google Scholar]


