Significance
Although PD-1 blockade has innovated cancer therapy, a novel combinatorial strategy is required to save less sensitive cancer patients. Mitochondria are key cytoplasmic organelles that efficiently supply the ATP necessary for the rapid proliferation and differentiation of T cells. We found that reactive oxygen species (ROS) strongly activate mitochondrial function of tumor-reactive T cells and synergize tumor regression by PD-1 blockade. ROS appear to activate both AMP-activated protein kinase (AMPK) and mechanistic target of rapamycin (mTOR), which subsequently induce the PPAR-gamma coactivator 1α (PGC-1α) transcription factor. Small-molecule activators of AMPK and mTOR, or PGC-1α, also synergistically enhance tumor-growth suppression by PD-1 blockade therapy. These findings not only open a new aspect of immune metabolism but also pave a way to developing a combinational strategy of PD-1 cancer immunotherapy.
Keywords: PD-1, cancer immunotherapy, mitochondria, immune metabolism, PGC-1α
Abstract
Although immunotherapy by PD-1 blockade has dramatically improved the survival rate of cancer patients, further improvement in efficacy is required to reduce the fraction of less sensitive patients. In mouse models of PD-1 blockade therapy, we found that tumor-reactive cytotoxic T lymphocytes (CTLs) in draining lymph nodes (DLNs) carry increased mitochondrial mass and more reactive oxygen species (ROS). We show that ROS generation by ROS precursors or indirectly by mitochondrial uncouplers synergized the tumoricidal activity of PD-1 blockade by expansion of effector/memory CTLs in DLNs and within the tumor. These CTLs carry not only the activation of mechanistic target of rapamycin (mTOR) and AMP-activated protein kinase (AMPK) but also an increment of their downstream transcription factors such as PPAR-gamma coactivator 1α (PGC-1α) and T-bet. Furthermore, direct activators of mTOR, AMPK, or PGC-1α also synergized the PD-1 blockade therapy whereas none of above-mentioned chemicals alone had any effects on tumor growth. These findings will pave a way to developing novel combinatorial therapies with PD-1 blockade.
Immunotherapy by PD-1 blockade has had a revolutionary impact on cancer treatment by its durable effect and high efficacy against a wide variety of cancers with limited adverse effects (1–3). Indeed, since its impressive clinical trial report in solid-tumor patients in 2010 (4), almost all clinical studies on various types of cancers carried out so far have shown surprisingly effective outcomes of PD-1 blockade (5). Currently, this therapy has been approved for melanoma, non–small-cell lung carcinoma (NSLC), kidney cancer, non-Hodgkin lymphoma, and head and neck cancer. It has dramatically ameliorated the survival rate of cancer patients compared with not only previous cancer immunotherapy but also current standard cancer treatments. However, around 30 to 50% of patients still remain unresponsive, or less responsive, to PD-1 blockade therapy (5, 6). To overcome this lack of response, PD-1 blockade therapy has been combined with various types of treatments including inhibition of other negative coreceptors such as Lag3 and Tim3, cancer vaccines, mild irradiation, and low doses of chemotherapy, but no striking synergistic effects have so far been reported (7). Consequently, effort has been focused on the identification of biomarkers that can distinguish between responders and nonresponders at the initiation of PD-1 blockade treatment (5). Such marker identification will save the precious time of patients, laborious efforts of doctors, and cost of social welfare. Again, none of the biomarkers tested so far have been demonstrated to be useful in clinical samples, although PD-L1 expression levels on NSLC are associated with clinical responses to some extent (2, 5).
PD-1, a surface receptor expressed mostly by activated T cells, acts as a negative regulator of the immune response at the effector phase. Engagement of PD-1 by either one of two ligands (PD-L1 and PD-L2) causes phosphorylation of the tyrosine residue in the immunoreceptor tyrosine-based switch motif, which leads to the recruitment of the Src homology region 2 domain-containing phosphatase-2, resulting in dephosphorylation of T-cell receptor (TCR) activation-induced phosphorylated accessory molecules, including Zap70 (8, 9). The negative regulatory function of PD-1 has been proven by the observation that PD-1 deficiency leads to autoimmunity (10–12). The discovery of the fundamental role of PD-1 led to the idea that PD-1 could be manipulated to help the immune system fight cancer or infections. Although the animal model of cancer therapy by PD-1 blockade has been established (13, 14), detailed mechanisms for the breakage of immune tolerance that leads to activation of tumor-reactive cytotoxic T lymphocytes (TR CTLs) and enhancement of their tumoricidal effects still remain unknown. It is also a mystery how effective immune surveillance induced by PD-1 blockade can last for years in treated cancer patients (15, 16). To answer these questions, it is particularly important to understand how PD-1 signal blockade affects the properties of TR CTLs in vivo. However, we do not even know whether effector T cells are generated at the tumor site or in the draining lymph nodes (DLNs). All these questions have to be asked in in vivo systems where CD8+ T cells differentiate into heterogeneous CTL populations, including tumoricidal effectors and long-term memory cells.
Recently, mitochondrial activation has been reported to be critical for generation of T-cell proliferation and memory formation by studies in vitro (17) as well as in vivo (18). T-cell receptor signaling induces Ca2+ release, which in turn promotes mitochondrial activities including the tricarboxylic acid (TCA) cycle and reactive oxygen species (ROS) generation (19). ROS are generated at complexes I, II, and III of the mitochondrial electron transport chain (20), and superoxide converted from ROS was shown to activate CD4+ as well as CD8+ T cells through NFAT activation and IL-2 production (21).
Because our studies on PD-1–deficient animals as well as tumor-bearing mice with PD-1 blockade indicated that mitochondrial activities are augmented in vivo by blocking PD-1 signaling, we examined whether ROS generators or uncouplers enhance the antitumor effect of PD-1 blockade therapy. Indeed, not only both ROS and uncouplers but also a series of chemical activators of AMP-activated protein kinase (AMPK) and the mechanistic target of rapamycin (mTOR) showed synergistic antitumor effects with PD-1 blockade. These activators increased expression of PPAR-gamma coactivator 1α (PGC-1α), a downstream target of both AMPK and mTOR. Finally, chemical activators of PGC-1α, known to increase mitochondrial activity, synergize with PD-1 blockade for tumor-growth suppression. These findings will pave a way for the development of combinatorial cancer therapy for those patients who are currently less responsive to PD-1 blockade treatment. Furthermore, mitochondrial activation can be used as a biomarker for effectiveness of PD-1 blockade therapy.
Results
Antitumor Effect by PD-1 Blockade Requires CD8+ T-Cell Priming in DLNs and Their Trafficking to Tumor Sites via the MIG/CXCR3 Axis.
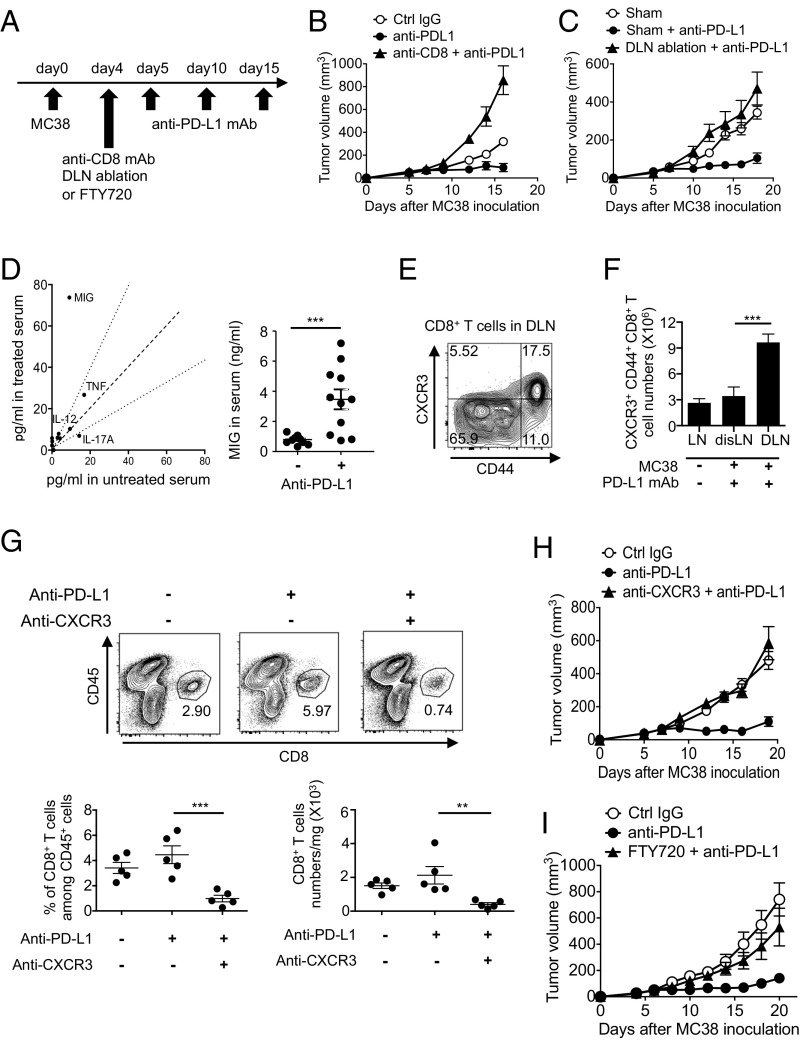
To examine the requirement of the priming and effector phases of CTLs in DLNs and the tumor mass, respectively, we either deleted CD8+ T cells or ablated the DLNs in the PD-L1 mAb therapy model using mouse colon cancer MC38. Both manipulations completely canceled the tumor-growth inhibition by PD-L1 mAb, indicating that DLNs are critical for CD8+ T-cell priming and CTL generation in PD-1 blockade therapy (Fig. 1 A–C). Using the cytokine and chemokine array, we found that the serum level of MIG (CXCL9) was significantly elevated during the therapy (Fig. 1D). Importantly, CXCR3, the receptor of MIG, was predominantly expressed on activated CD44+ CD8+ T cells (Fig. 1E). During the therapy, the numbers of CXCR3+ CD44+ CD8+ T cells significantly increased in DLNs but not in distal LNs, again indicating that CTL generation after the injection of PD-L1 mAb mainly occurs in DLNs (Fig. 1F). Furthermore, the CXCR3 blockade significantly reduced the frequency and number of CD8+ tumor-infiltrating lymphocytes (TIL) (Fig. 1G) and completely abolished the PD-L1 mAb tumoricidal effect (Fig. 1H). Experiments using the sphingosine 1-phosphate receptor antagonist FTY720, which inhibits the egression of T cells from LNs, also showed the requirement of CTL migration into tumor sites for effective tumor suppression by PD-1 blockade (Fig. 1I). Together, these data clearly demonstrate the requirement of DLNs for priming and generation of CTLs, and of their MIG/CXCR3-dependent trafficking to the tumor site for efficient tumor killing.
Fig. 1.
CD8+ T-cell priming in DLNs and their trafficking to tumor sites via the MIG/CXCR3 pathway. (A) MC38-bearing mice were treated with PD-L1 mAb on days 5, 10, and 15. (B and C) Tumor sizes of mice with CD8+ T-cell depletion (B) or DLN ablation (C) on day 4 are shown. Data represent the means ± SEM of five mice. (D) Cytokine and chemokine levels in the serum 1 d after the second therapy were detected by bead array. Data are representative of three mice (Left). MIG level in the serum was measured by ELISA. Data represent the means ± SEM of 11 mice. ***P < 0.001, two-tailed Student t test (Right). (E) CD8+ T cells of DLNs 1 d after the second therapy were stained with anti-CD44 mAb and anti-CXCR3 mAb. (F) The numbers of CXCR3+ CD44+ CD8+ T cells in distal LNs (disLNs) or DLNs of PD-L1 mAb-treated mice were calculated 1 d after the second therapy. Numbers of CXCR3+ CD44+ CD8+ T cells in LNs of tumor-free mice were used as a control (LN). ***P < 0.001, one-way ANOVA analysis. (G) Cells isolated from tumor mass 1 d after the second therapy were stained with anti-CD45 mAb and anti-CD8 mAb (Upper). The frequency of CD8+ T cells among CD45+ cells and number of CD8+ T cells per mg of tumor tissue were calculated (Lower). Data represent the means ± SEM of five mice. **P < 0.01, ***P < 0.001, one-way ANOVA analysis. (H) Tumor sizes of mice treated with anti–PD-L1 mAb along with anti-CXCR3 mAb on days 5 and 10 are shown. Data represent the means ± SEM of five mice. (I) Tumor sizes of mice treated with anti–PD-L1 mAb and FTY720. FTY720 was injected on day 4 and every 2 d for 3 wk. Data represent the means ± SEM of five mice. Data are representative of two independent experiments.
Augmentation of Mitochondrial Activities of Tumor-Reactive CD8+ T Cells in DLNs by PD-1 Blockade.
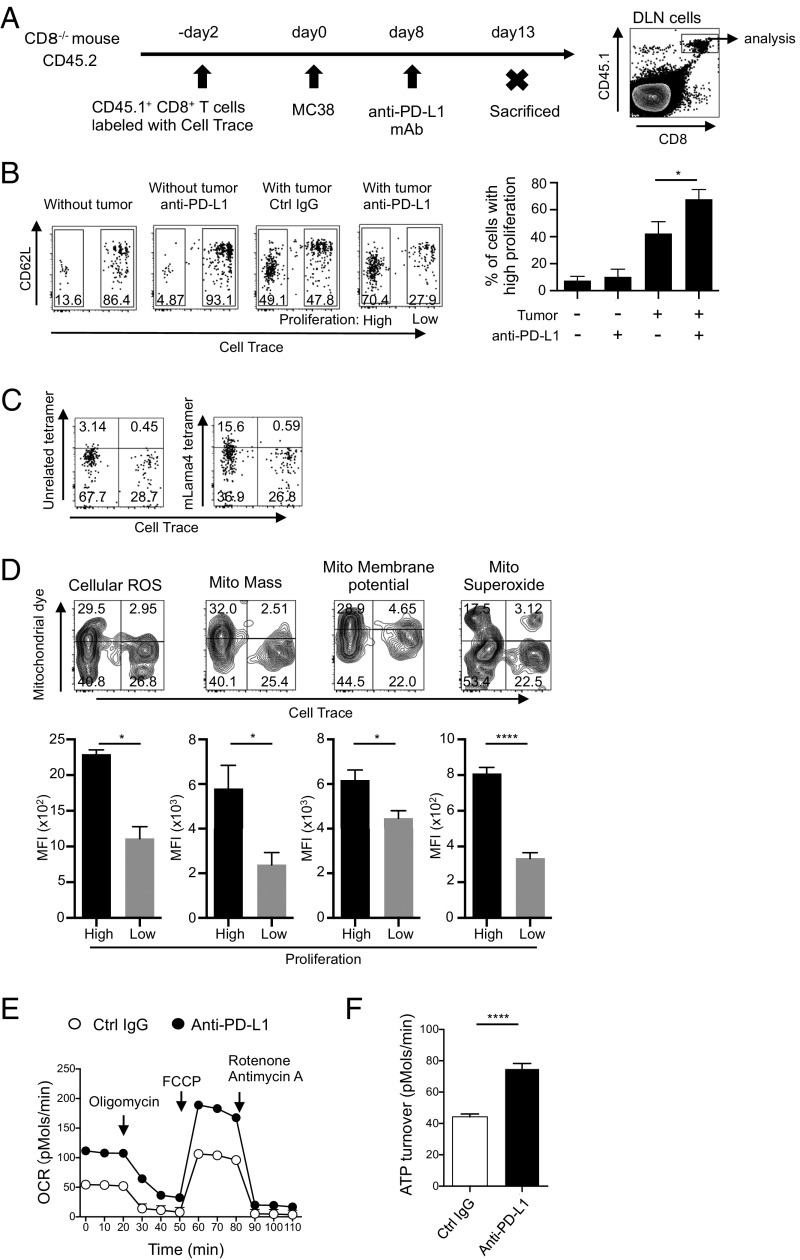
Because CTL priming takes place in DLNs, we next investigated proliferative changes of tumor-reactive CD8+ T cells in DLNs induced by PD-1 blockade. One problem with studying the mechanism of PD-1 blockade therapy is the difficulty in identification of the TR CTLs, because PD-1 blockade likely generates CTLs with a large repertoire of TCRs in response to a variety of tumor antigens (22, 23). To circumvent this problem, CellTrace-labeled CD45.1+ CD8+ T cells were transferred into CD45.2+ CD8−/− mice and their proliferation in DLNs was examined assuming that tumor-activated CD8+ T cells will proliferate vigorously (Fig. 2A). Among the transferred CD45.1+ CD8+ T cells, we could easily distinguish the vigorously proliferating population (high proliferation) and less dividing population (low proliferation) in mice with MC38 (Fig. 2B). The frequency and number of rapidly proliferating CD45.1+ CD8+ T cells increased in tumor-bearing mice treated with PD-L1 mAb compared with those injected with control IgG. Remarkably, PD-L1 mAb did not induce proliferation in the absence of tumor, strongly indicating that highly proliferating CD8+ T cells are indeed activated by tumor antigens (Fig. 2B). Moreover, a significantly higher fraction of such highly proliferating CD45.1+ CD8+ T cells in DLNs became positive for the MHC tetramer loaded with mLama4 peptide, a mutated epitope of MC38, by the anti–PD-L1 treatment (Fig. 2C) (24). Therefore, it is highly likely that the vigorously proliferating cell population in DLNs is rich in TR CTLs.
Fig. 2.
Mitochondrial activation in TR CTLs by PD-1 blockade in vivo. (A) A schematic diagram of the experimental schedule. (B–D) CellTrace-labeled CD45.1+ CD8+ T cells were transferred into CD45.2+ CD8−/− mice. The mice were inoculated with MC38 and treated with PD-L1 mAb on day 8. CD8+ CD45.1+ T cells in DLNs were gated and analyzed. (B) Intensities of CD62L and CellTrace among the gate are shown (Left). The frequencies of highly proliferating cells were compared between groups. Data represent the means ± SEM of four or five mice. *P < 0.05, one-way ANOVA analysis (Right). (C) Among the gated cells shown in A, the positivity of CellTrace and MHC tetramer loaded with mLama4 peptide or an unrelated peptide was analyzed in the group treated with PD-L1 mAb. (D) DLN cells of PD-L1 mAb-treated mice were stained with dyes indicating mitochondrial activities. Representative FACS data of the gated population (A) are shown (Upper). The median of fluorescence intensity (MFI) of each dye was compared between highly proliferating (high) and less proliferating (low) populations. Data represent the means ± SEM of five mice. *P < 0.05, ****P < 0.0001, two-tailed Student t test (Lower). Data are representative of three independent experiments (A–D). (E and F) MC38-bearing wild-type mice were treated with the same schedule as in Fig. 1A. The oxygen consumption rate of DLN CD8+ T cells isolated from treated or untreated mice was measured by the Seahorse XFe96 analyzer. Cells were mixed from three mice 2 d after the second therapy (E). ATP turnover defined as (last rate measurement before oligomycin) − (minimum rate measurement after oligomycin injection) was calculated (F). Data represent the means ± SEM of six wells. ****P < 0.0001, two-tailed Student t test. Data are representative of two independent experiments.
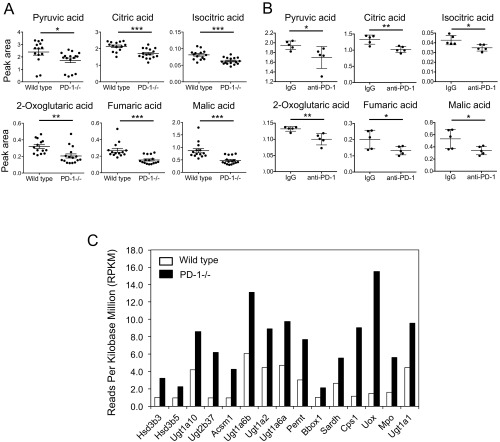
During our studies on the mechanism of disease development in PD-1–deficient mice (10–12), we found that these mice show drastic metabolic changes. A metabolic snapshot of serum metabolome for small, water-soluble molecules revealed a significant reduction of compounds involved in the TCA cycle in PD-1–deficient mice compared with wild-type mice, which led us to speculate excessive consumption by accelerated mitochondrial activities in CTLs (Fig. S1A). Similar metabolic changes in sera were also observed in MC38-bearing mice treated with anti–PD-1 mAb (Fig. S1B). In addition, RNA-sequencing data of PD-1–deficient mouse LNs showed enhanced transcription of genes required for mitochondrial activation (Fig. S1C). We therefore suspected that mitochondrial activation may be induced in DLN CTLs of tumor-bearing mice by PD-1 blockade.
Fig. S1.
Mitochondrial activation in PD-1 blockade conditions. (A) The tricarboxylic acid cycle-associated metabolites in sera of wild-type and PD-1−/− mice were measured by gas-chromatography-mass spectrometry. The levels of the metabolites indicated were compared. Data represent the means ± SEM of 14 to 16 mice. *P < 0.05, **P < 0.01, ***P < 0.001, two-tailed Student t test. (B) MC38-bearing mice were treated with PD-1 mAb (4H2) according to the schedule described in Fig. 1A. TCA-associated metabolites were measured in sera harvested on day 13. *P < 0.05, **P < 0.01, two-tailed Student t test. (C) RNA extracted from lymph nodes of wild-type and PD-1−/− mice was subjected to RNA sequencing to compare the expression levels of genes associated with mitochondrial activity. The same amounts of RNA from seven individual mice were pooled. The mitochondria-related genes were selected using Gene Ontology GOterm_Cellular Component (CC)_FAT.
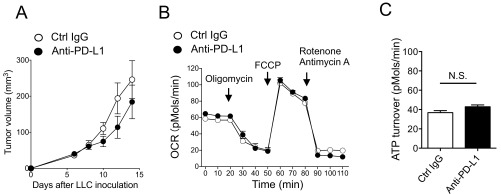
In fact, compared with less dividing cells, highly proliferating CD8+ T cells in response to tumor antigens contained more cellular ROS, larger mitochondrial mass, higher mitochondrial membrane potential, and more mitochondrial superoxide, a major source of mitochondrial ROS (25), clearly indicating activation of mitochondria in TR CTLs in vivo by PD-1 blockade (Fig. 2D). In agreement with this, the oxygen consumption rate (OCR), an indicator of mitochondrial respiration, and ATP turnover were significantly higher in CD8+ T cells isolated from DLNs of PD-L1 mAb-treated mice (Fig. 2 E and F) (26). In contrast, PD-1 blockade-dependent mitochondrial activation was not observed in mice carrying Lewis lung carcinoma (LLC), whose proliferation was not efficiently inhibited by PD-L1 mAb treatment (Fig. S2). Together, these data demonstrate that increased mitochondrial activity in proliferating TR CTLs is associated with tumor regression by PD-1 blockade therapy. The results also suggest that indicators for mitochondrial activation could serve as biomarkers for effectiveness of antitumor therapy by PD-1 blockade.
Fig. S2.
Lack of mitochondrial activation of CTLs in the therapy of unresponsive tumor cells (LLC). (A) LLC-bearing mice were treated with PD-L1 mAb with the same schedule as in Fig. 1A. (B) OCRs of DLN CD8+ T cells isolated from treated or untreated mice were measured by Seahorse XFe96 analyzer. Cells were mixed from three mice 2 d after the second therapy. (C) ATP turnover defined as (last rate measurement before oligomycin) − (minimum rate measurement after oligomycin injection) was calculated. Data represent the means ± SEM of six wells. N.S., no significant difference, two-tailed Student t test.
ROS Can Enhance Antitumor Activity by PD-1 Blockade.
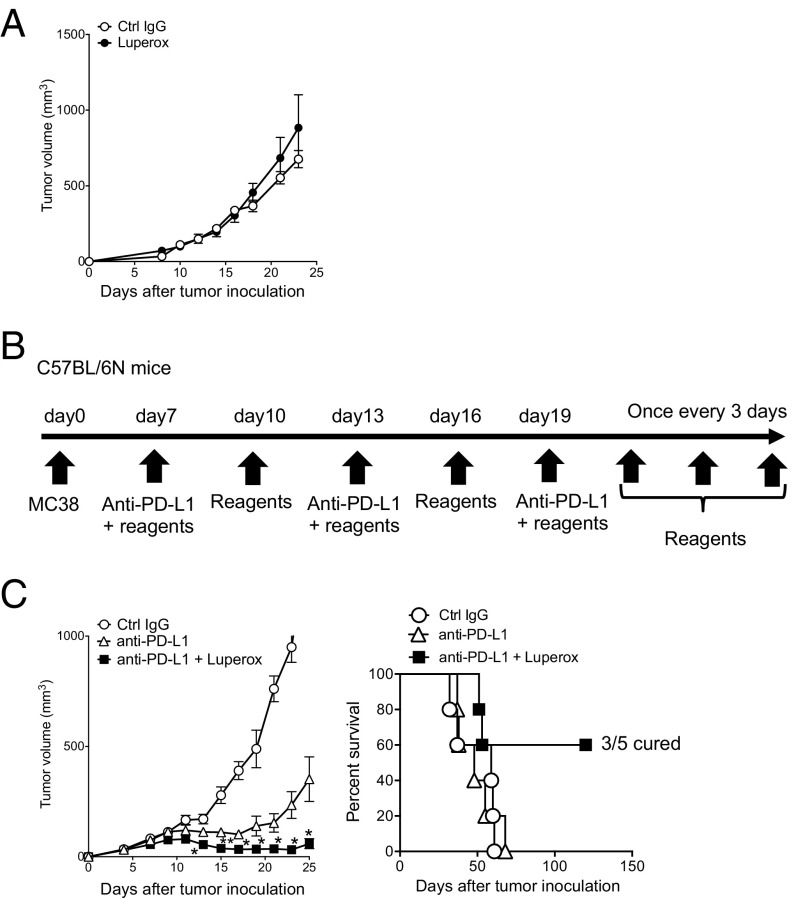
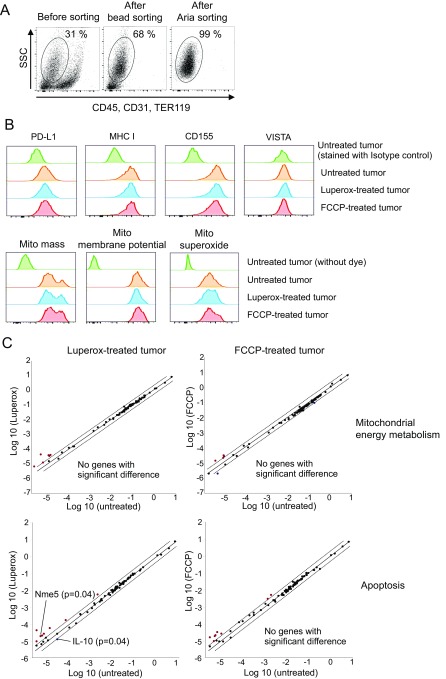
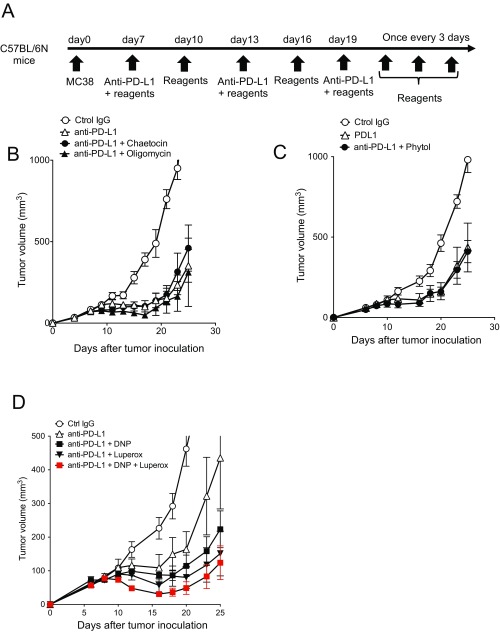
We thus suspected ROS may be involved in CTL activation by PD-L1 mAb treatment. Because exogenous ROS or its generators are known to directly damage tumor cells (27), we first tested whether a ROS generator alone exhibits tumor-killing activity. When a ROS precursor, tert-butyl hydroperoxide solution (Luperox), was injected into MC38-bearing mice, it did not show any antitumor activity (Fig. 3A). We further confirmed the absence of significant changes in immune-regulatory surface markers and transcriptional profiles of tumor cells treated in vivo with Luperox alone (Fig. S3). However, combined with PD-L1 mAb, Luperox greatly enhanced the antitumor activity and survival of tumor-bearing mice (Fig. 3 B and C). These data indicate that Luperox synergized with the antitumor activity of PD-L1 mAb, probably through modulation of the T-cell activation status but not through a direct effect on tumor cells. Other ROS generators, chaetocin and phytol, however, did not show the synergistic antitumor effect, suggesting they differ quantitatively or qualitatively from Luperox in the ROS generation mechanism in T cells (Fig. S4 A–C) (28, 29).
Fig. 3.
Synergistic effect of Luperox, a ROS generator, with PD-L1 mAb therapy. (A) tert-butyl hydroperoxide solution (Luperox) treatment was conducted from day 7 every 3 d for 3 wk. Tumor sizes are shown. Data represent the means ± SEM of five mice. (B) Schematic diagram of the combination therapy schedule. (C) Following the schedule of B, mice were treated with PD-L1 mAb and the chemicals indicated. Tumor sizes and/or survival rates are shown. Data represent the means ± SEM of five mice. *P < 0.05, **P < 0.01, two-tailed Student t test (anti–PD-L1 vs. anti–PD-L1 + Luperox). Data are representative of two independent experiments.
Fig. S3.
Luperox and FCCP have little effect on tumor cells in vivo. (A) Tumor tissues were harvested 1 d after the second injection of FCCP or Luperox alone. After digestion, tumor cells were negatively sorted by a tumor cell isolation kit that can exclude lymphocytes, red blood cells, fibroblasts, endothelial cells, and tumor-associated stromal cells. Isolated tumor cells were further purified by FACSAria-guided sorting and used for the following experiments. (B) Tumor cells were stained with antibodies targeting PD-L1, MHC class I, CD155 (ligand of TIGIT), and VISTA or with dyes for mitochondrial mass, membrane potential, and superoxide. (C) Expression levels of genes associated with mitochondrial energy metabolism and apoptosis were examined using RT2 Profiler PCR Array Kits. Named genes were significantly up-regulated more than twofold compared with untreated tumor cells among 84 genes. Other genes loaded on the array plates are mentioned in SI Methods.
Fig. S4.
Synergistic or nonsynergistic effects of certain mitochondrial activation-associated chemicals. (A) Schematic diagram of the combinational therapy schedule. (B) Mice were treated with PD-L1 mAb and chaetocin or oligomycin. The mice treated with control IgG and anti–PD-L1 mAb were shared with Fig. 3C. (C) MC38 mice were treated with anti–PD-L1 mAb and phytol. (D) Mice were treated with PD-L1 mAb along with DNP, Luperox, or both. Data represent the means ± SEM of five or six mice. Data are representative of two independent experiments.
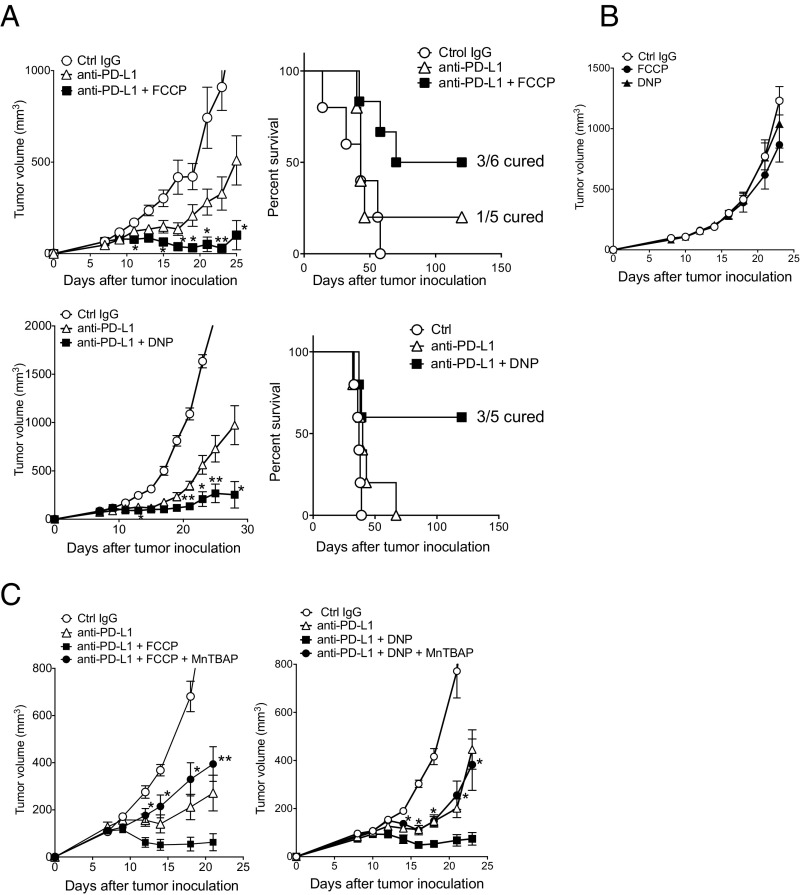
Although chemical uncouplers are known to decrease ROS production in isolated mitochondria (30, 31), there are reports that the uncouplers rather increase mitochondrial ROS production in cells through hypoxia and HIF-1α activity (32–34). We thus tested the effect of carbonylcyanide-p-trifluoromethoxyphenylhydrazone (FCCP) and 2,4-dinitrophenol (DNP), and compared with oligomycin (an ATP synthase inhibitor) as control. FCCP and DNP, but not oligomycin, augmented the efficacy of the PD-L1 mAb therapy and considerably extended the survival time of treated animals compared with those treated by PD-L1 mAb alone (Fig. 4A and Fig. S4B). Importantly, like in the case of Luperox, administration of FCCP or DNP alone did not exhibit any antitumor activity (Fig. 4B). Furthermore, the phenotypic analysis of tumor cells harvested from mice treated with FCCP alone did not show a significant difference, indicating again that uncouplers synergized with the antitumor activity of PD-L1 mAb but did not directly affect the tumor cells (Fig. S3). We found that the effect of the uncouplers on the PD-L1 mAb therapy was cancelled when ROS were quenched by treatment with MnTBAP (a synthetic metalloporphyrin acting as a ROS scavenger) (Fig. 4C). These results strongly indicate that the synergistic effect of the uncouplers is mediated by ROS signals. Curiously, the combination of DNP and Luperox additionally augmented the antitumor activity by PD-L1 mAb (Fig. S4D), suggesting that they may have additional nonoverlapping mechanisms to augment the effect of PD-1 blockade.
Fig. 4.
Synergistic effect of uncouplers is mediated by ROS. (A) MC38-bearing mice were treated with PD-L1 mAb along with FCCP or DNP with the same schedule as shown in Fig. 3B. Tumor sizes and/or survival rates are shown. Data represent the means ± SEM of five or six mice. *P < 0.05, **P < 0.01, two-tailed Student t test (anti–PD-L1 vs. anti–PD-L1 + FCCP or DNP). (B) MC38-bearing mice were treated with FCCP or DNP alone with the same schedule as in A. Tumor sizes are shown. Data represent the means ± SEM of five mice. (C) MC38-bearing mice were treated with PD-L1 mAb and FCCP (Left) or DNP (Right) along with a ROS scavenger (MnTBAP). Data represent the means ± SEM of four or five mice. *P < 0.05, **P < 0.01, two-tailed Student t test (combination therapy vs. combination therapy + MnTBAP). The mice of the control IgG group in DNP combination therapy (Right) were shared with those of B. Data are representative of two independent experiments.
FCCP Increases Cellular ROS in CD62L− CD44+ Effector T Cells in DLNs and Their Accumulation at the Tumor Site.
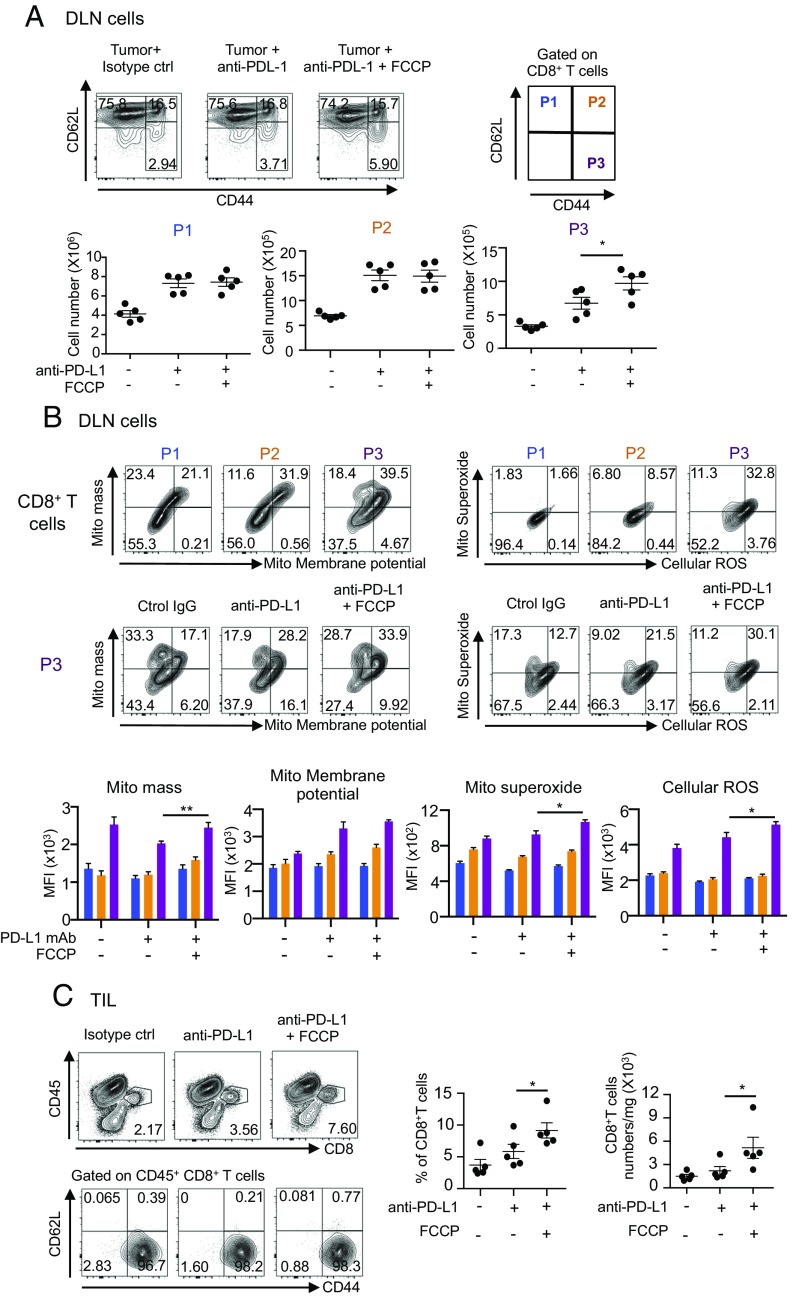
We then examined whether the uncouplers enhanced proliferation of CTLs in DLNs and tumor sites synergistically with the PD-L1 mAb treatment. As shown in Fig. 5A, we found that in DLNs the frequency and number of CD8+ T cells with the surface phenotype indicative of effector/memory T cells (CD62L− CD44+ gated as P3) significantly increased by the combination therapy with PD-L1 mAb and FCCP compared with anti–PD-L1 mAb alone. By contrast, the numbers of naïve (CD62L+ CD44− gated as P1) and central memory T cells (CD62L+ CD44+ gated as P2) were not increased by the FCCP addition, although these populations were significantly increased by the injection of anti–PD-L1 mAb alone (Fig. 5A).
Fig. 5.
Increase in the number of effector CD8+ T cells by FCCP addition. (A) MC38-bearing mice were treated with PD-L1 mAb and FCCP with the same schedule as shown in Fig. 3B. DLN cells on day 14 were stained with anti-CD8, -CD62L, and -CD44 mAb, and CD8+ T cells were gated. P1 to P3 populations were defined according to CD62L and CD44 positivity (Upper). The absolute numbers of P1 to P3 were calculated (Lower). Data represent the means ± SEM of five mice. *P < 0.05, one-way ANOVA analysis. (B) Representative FACS profiles of P1 to P3 stained with each mitochondrial dye in mice treated with PD-L1 mAb and FCCP (Upper). Representative FACS profiles of the P3 population stained with each mitochondrial dye in each group (Middle). MFI of P1 to P3 stained with each dye was compared between treated groups. Colors correspond to the P1 to P3 populations. Data represent the means ± SEM of five mice (Lower). *P < 0.05, **P < 0.01, one-way ANOVA analysis. (C) Cells isolated from the tumor mass on day 11 were stained with anti-CD8, -CD45, -CD62L, and -CD44 mAb. CD45+ CD8+ T cells were gated and their CD62L and CD44 phenotypes were analyzed (Left). The frequencies of CD8+ T cells among CD45+ T cells and the numbers of CD45+ CD8+ T cells were compared between groups (Right). Data represent the means ± SEM of five mice. *P < 0.05, one-way ANOVA analysis. FACS data are representative of five mice in each group. Data are representative of two independent experiments.
Importantly, the P3 population in any treatment group contained larger mitochondrial areas, higher membrane potential, and more ROS per cell than either the P1 or P2 CD8+ T cells, and the cellular levels of membrane potential and ROS were significantly augmented when FCCP was combined with PD-L1 mAb (Fig. 5B). These observations suggest that (i) the dose of FCCP used did not have irreversible toxic effects (which might be expected at higher doses); (ii) ROS were increased and may be involved in the enhanced tumoricidal efficacy by uncouplers, as the expanded P3 population contained higher levels of superoxide per cell (Fig. 5B); and (iii) the feedback mechanism of mild mitochondrial damage may have rather augmented the mitochondrial activity (35). Remarkably, such changes in DLNs were accompanied by a significant increase in P3 cells infiltrating the tumor (Fig. 5C). Together, these data indicate that the combination treatment of the uncoupler and PD-L1 mAb boosted the size and functional potency of the effector/memory CD8+ T cells both in DLNs and at their target tumor site.
Energy Sensors AMPK and mTOR Are Involved in Immune-Enhancing Activity by Uncouplers.
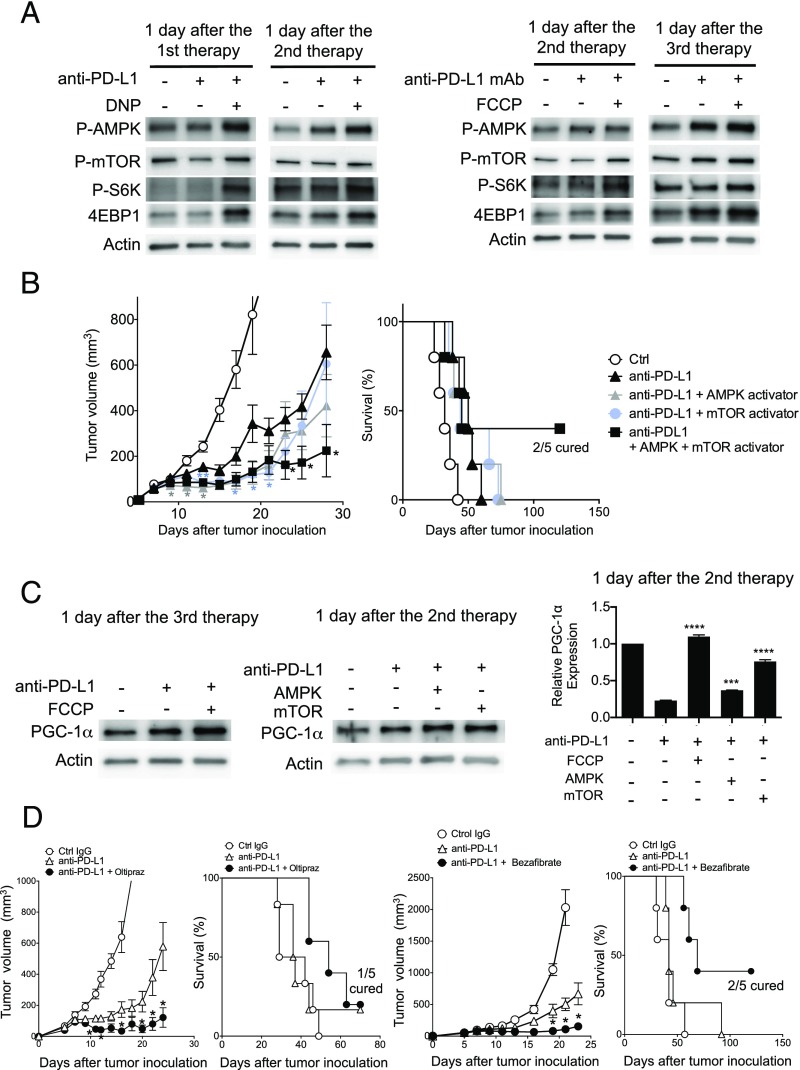
Because the balance of phosphorylated AMPK and mTOR, known as differential energy sensors, is proposed to control the fate of CD8+ T-cell differentiation (36–41), we investigated the activation of AMPK and mTOR pathways in CD8+ T cells of DLNs from tumor-bearing mice treated with PD-L1 mAb and the uncouplers. AMPK was activated at multiple time points after the combination therapy in CD8+ T cells harvested from mice treated by DNP or FCCP and PD-L1 mAb (Fig. 6A). Unexpectedly, however, mTOR and its associated proteins S6K and 4EBP1 were also activated after the combination therapy, although p-mTOR signal was rather weak, probably due to its rapid turnover (Fig. 6A) (42).
Fig. 6.
Involvement of the mTOR and AMPK pathways for the synergistic effects of uncouplers and PD-L1 mAb. (A) CD8+ T cells were isolated from the pooled DLN cells of five mice at the indicated time points of the DNP or FCCP combination therapy scheduled as in Fig. 3B. Phosphorylation of AMPK, mTOR, and S6K and the expression of 4EBP1 were analyzed by Western blotting with the indicated antibodies. (B) MC38-bearing mice were treated with PD-L1 mAb along with AMPK activator (A769662) and/or mTOR activator (MHY1485). Tumor sizes and survival rates are shown. Data represent the means ± SEM of five mice. *P < 0.05, **P < 0.01, two-tailed Student t test (anti–PD-L1 mAb vs. each combination therapy). Each color of asterisk corresponds to the group indicated by the same color. (C) PGC-1α expression levels were examined by Western blotting and quantitative PCR (qPCR) in DLN CD8+ T cells treated with PD-L1 mAb along with FCCP, AMPK activator, or mTOR activator. Mice were killed on the indicated day and CD8+ T cells were pooled from five mice. Data represent the means ± SEM of three wells, assuming the untreated group equals 1 in the qPCR analysis. The expression level of each group was compared with the PD-L1–treated group. ***P < 0.001, ****P < 0.0001, one-way ANOVA analysis. (D) MC38-bearing mice were treated with PD-L1 mAb along with NRF2 activator (oltipraz) or PPAR activator (bezafibrate). Tumor sizes and survival rates are shown. Data represent the means ± SEM of five mice. *P < 0.05, two-tailed Student t test (anti–PD-L1 mAb vs. each combination therapy).
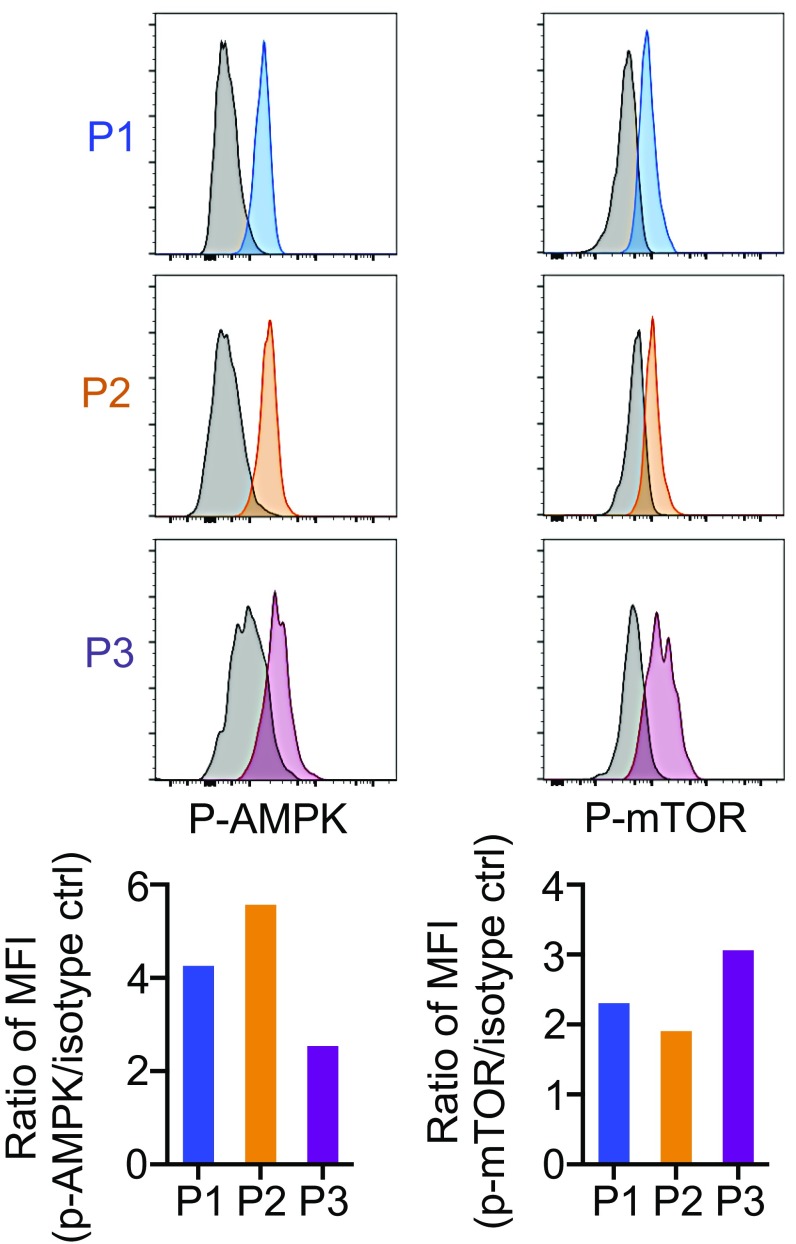
The simultaneous activation of AMPK and mTOR is puzzling. However, this could be explained by the presence of heterogeneous populations of CTLs at different differentiation stages, each of which may carry distinct AMPK–mTOR balance, within the total CD8+ T cells in DLNs. Indeed, the P2 population was found to up-regulate p-AMPK more than p-mTOR, whereas the P3 population expressed higher p-mTOR compared with p-AMPK, although each of the P2 and P3 populations should contain heterogeneous stages of CTLs (Fig. S5). Based on these results, we next tested whether direct activation of either mTOR or AMPK enhances the efficacy of the PD-1 blockade therapy. As shown in Fig. 6B, either the mTOR activator or AMPK activator moderately augmented the efficacy of PD-1 blockade therapy in the early phase (before day 20), whereas their combination further enhanced the antitumor activity by the PD-L1 mAb treatment and improved animal survival. The results indicate that activation of both mTOR and AMPK is involved in the synergistic tumoricidal activity of the uncouplers with PD-L1 mAb.
Fig. S5.
Distinctive activation of mTOR and AMPK depending on the differentiation stage of CD8+ T cells. MC38-bearing mice were treated with PD-L1 mAb along with DNP. One day after the first therapy, DLN cells were stained with antibody against CD8, CD62L, CD44, p-mTOR, and p-AMPK. After gating on P1 to P3 as shown in Fig. 5A, the intensity of p-AMPK and p-mTOR was compared between P1, P2, and P3. Data are representative of two independent experiments.
PGC-1α Activators Enhance PD-1 Blockade Therapy.
PGC-1α, a transcriptional cofactor regulated by either AMPK or mTOR, is known to enhance mitochondrial biogenesis and oxidative phosphorylation (43, 44). We found that combination of not only FCCP but also activators of mTOR and AMPK with PD-L1 mAb increased the expression levels of PGC-1α protein and mRNA in agreement with recent reports (Fig. 6C) (35, 43, 44). The reduction of PGC-1α mRNA by PD-L1 mAb treatment alone despite an increase in its protein is probably due to multiple steps of PGC-1α regulation, namely transcription, translation, and protein stabilization (44, 45). It is reported that PGC-1α enhances mitochondrial activity through partner transcription factors: nuclear respiratory factors (NRFs) and peroxisome proliferator-activated receptors (PPARs) (44). We tested oltipraz and bezafibrate, known to activate PGC-1α/NRF2 and PGC-1α/PPARs, respectively, for their synergistic tumor-suppression activity with anti–PD-L1 mAb (46, 47). Both oltipraz and bezafibrate strongly enhanced tumor-growth suppression and animal-survival activities by anti–PD-L1, whereas these chemicals alone did not show any effects on tumor growth (Fig. 6D).
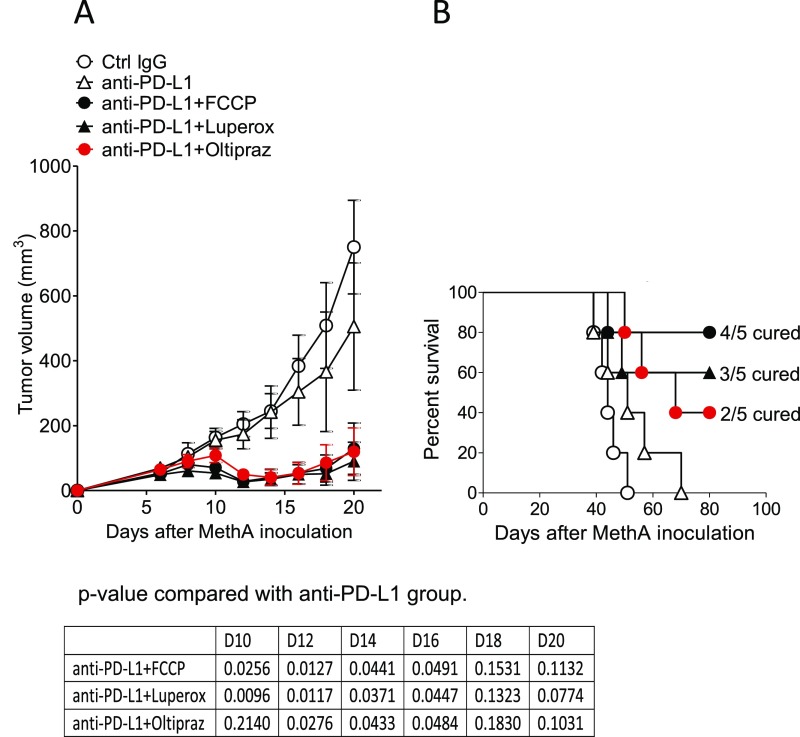
To examine whether this PD-1 blockade combination therapy is applicable to tumors other than MC38, we tested the effect of the FCCP, Luperox, or oltipraz combination therapy on MethA, a murine skin sarcoma line injected intradermally into BALB/c mice. All of the chemicals tested had strong synergistic effects with anti–PD-L1 on MethA-growth suppression (Fig. S6). The results clearly indicate that the combinatorial therapy of mitochondrial activators with PD-1 blockade is applicable to multiple tumors of different genetic backgrounds.
Fig. S6.
Mitochondrial activation-related chemicals work on the different tumor and mouse strains. Fibrosarcoma, MethA-bearing BALB/c mice were treated with PD-L1 mAb along with FCCP, Luperox, and oltipraz according to the schedule shown in Fig. 3B. Tumor sizes (A) and survival rate (B) are shown. Data represent the means ± SEM of five mice. P values, two-tailed Student t test (anti–PD-L1 mAb vs. each combination therapy in tumor volume) are shown.
Combination Therapy with FCCP Augments T-bet Expression on CTLs.
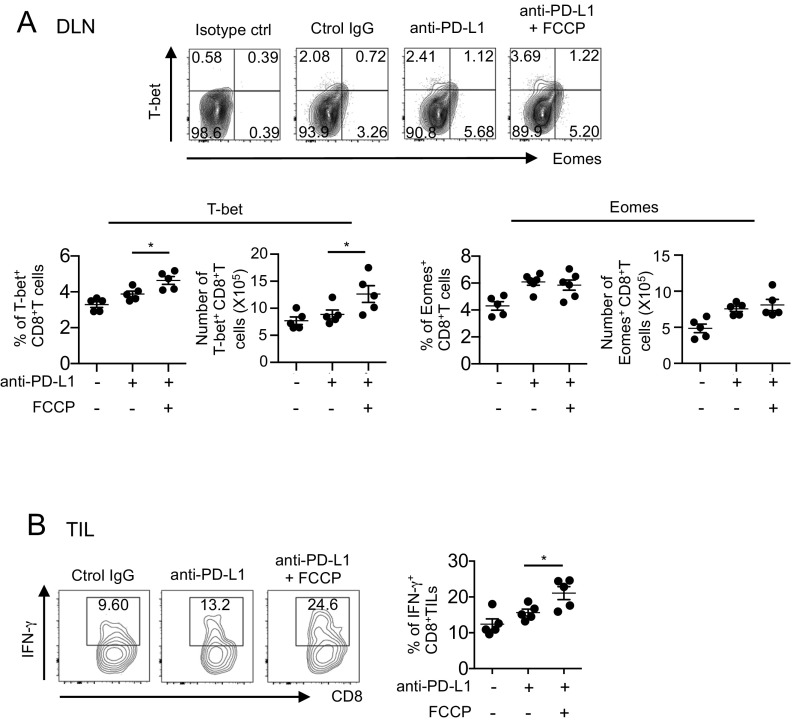
T-bet, a critical transcription factor involved in cytokine synthesis and antitumor CTL activity by PD-1 blockade, is known to be up-regulated by mTOR through FOXO1 inhibition (48). We thus examined whether FCCP affects T-bet and Eomes expression in combination therapy with anti–PD-L1. FCCP increased T-bet but not Eomes in CD8+ T cells, in agreement with the above finding that FCCP plus anti–PD-L1 activates mTOR (Fig. S7A). Finally, cytotoxic cytokine IFN-γ production is also augmented in CD8+ TIL by synergistic activity of FCCP (Fig. S7B). Taken together, the molecular mechanism of uncouplers’ synergistic effects with anti–PD-L1 involves activation of AMPK, mTOR, and their downstream transcription factors, including PGC-1α and its cofactors such as NRF2 and PPARs (Fig. S8).
Fig. S7.
T-bet and IFN-γ production was up-regulated in a combination of FCCP with PD-L1 mAb. (A) T-bet and Eomes expression was analyzed by flow cytometry in DLN CD8+ T cells from mice treated with PD-L1 mAb and FCCP. Representative FACS data are shown (Upper). The frequency and numbers of T-bet+ or Eomes+ T cells were calculated in DLN CD8+ T cells from mice treated with PD-L1 mAb and FCCP. *P < 0.05, one-way ANOVA. (B) Digested tumor tissues were incubated at 37 °C for 6 h, and IFN-γ was intracellularly stained in the CD8+ T cells from mice treated with FCCP. Representative FACS data (Left) and the frequency of IFN-γ+ T cells among CD8+ T cells are shown (Right). Data represent the means ± SEM of five mice. *P < 0.05, one-way ANOVA. Data are representative of two independent experiments.
Fig. S8.
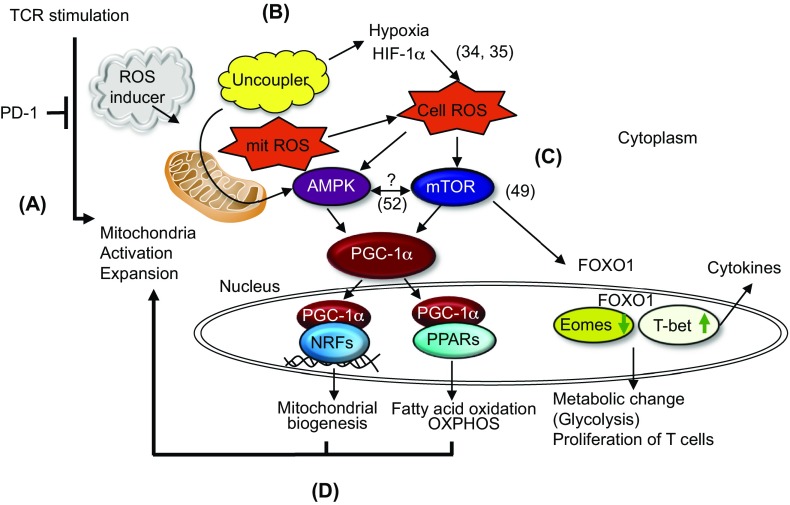
Hypothetical scheme for mitochondrial activation by PD-1 blockade and chemicals. (A) A PD-1 blockade activates mitochondria of tumor-reactive T cells. (B) ROS inducers or uncouplers increase cellular ROS. (C) Cellular ROS activate AMPK and mTOR, resulting in the activation of PGC-1α as well as the expression of T-bet. (D) Couplers of PGC-1α with NFRs and PPARs induce feed-forward activation on mitochondria. Numbers in parentheses correspond to references listed in the main text.
Discussion
Currently, the major issues for cancer therapy by PD-1 blockade arise from the fact that not all patients are responding to this therapy. To solve this problem, efforts have been concentrated on the identification of clinically applicable reagents or methods that would augment the antitumor efficacy of PD-1 blockade therapy. In addition, it is important to identify biomarkers that could help distinguish between responders and nonresponders to this therapy, which could be beneficial to patients and society. We demonstrated that TR CTLs boosted by PD-L1 mAb carry activated mitochondria with higher ROS production, and found that administration of ROS generators as well as uncouplers has synergistic effects with PD-1 blockade on tumor-growth inhibition. The uncouplers’ synergistic effect may be due to their ability to induce cellular ROS through hypoxia or feedback mitochondrial proliferation, as a ROS scavenger cancelled the synergistic effect of uncouplers and CTLs stimulated with uncouplers contained higher ROS (34, 35). We found that the administration of the uncouplers alone did not show a direct impact on the growth or gene expression of tumor cells.
Mitochondrial energy metabolism is closely linked with cellular metabolism via mTOR and AMPK (36, 49, 50). We found that uncouplers combined with PD-1 blockade activate not only the AMPK but also the mTOR pathway. This result was rather unexpected, because previous reports suggested that activation of mTOR actually competes with AMPK phosphorylation (36, 38–40, 51). However, our observations may not be entirely contradictory, considering that the ex vivo isolated CD8+ T cells consist of heterogeneous cells at different stages of activation and effector functions, and also given the dynamic nature of immune cells as well as complex regulatory reactions governing the two energy sensors (51). We speculate that mTOR activation leads to the expression of T-bet in DLN CTLs stimulated by FCCP together with PD-L1 blockade. T-bet is important for the antitumor function of CTLs as well as for the development of memory precursors, which potentially give rise to the sufficient numbers of terminally differentiated effector CTLs required for tumor regression (52, 53). On the other hand, terminally differentiated CTLs, which strongly express Eomes, were tolerized by chronic antigen recognition (53, 54). The results that the combination therapy with FCCP increases T-bet and IFN-γ expression but rather decreases Eomes expression support our conclusion that the combination therapy expands the effector-memory population (P3 population) with the activated mitochondria.
Activation of AMPK or mTOR phosphorylates or augments PGC-1α, which regulates a series of transcriptional factors involved in mitochondrial biogenesis and mitochondrial oxidative phosphorylation activation. We have shown that the PD-1 blockade combination therapy with uncouplers increases PGC-1α expression and that PGC-1α activators (bezafibrate and oltipraz) also synergize with the PD-L1 mAb treatment of tumors. The results clearly indicate that PGC-1α is a key molecule that triggers mitochondrial activation and expansion and induces the feed-forward signaling cycle of mTOR and AMPK activation. In addition, uncouplers, when combined with PD-L1 mAb, activate T-bet, a critical cytokine regulator located downstream of mTOR. Accordingly, the whole picture of the current hypothesis for mechanistic flow is summarized in Fig. S8: (i) PD-1 blockade activates mitochondrial expansion and proliferation in activated CD8+ T cells. (ii) Uncouplers and ROS generators further enhance mitochondrial mass, resulting in increased ROS, which probably activates AMPK and mTOR for unknown reasons (34). (iii) Activation of mTOR and AMPK induces and activates PGC-1α. (iv) Finally, PGC-1α and its cofactors, NRFs and PPARs, induce a series of transcription factors, which activate fatty acid oxidation and OXPHOS, and mitochondrial expansion, which promotes CTL activation and proliferation. Two papers very recently published, showing that PD-1 signal blocks mitochondrial activity and PGC-1α expression, strongly support our hypothesis (55, 56). Together, all chemicals used in this study—namely ROS, uncouplers, AMPK activators, mTOR activators, and PGC-1α activators—lead to CD8+ T-cell activation and differentiation through mitochondrial activation and expansion when combined with PD-1 blockade but not by the chemicals alone.
The current results provide a proof of concept for a novel combination therapy that could be applied to those cancer patients who do not respond efficiently to PD-1 blockade. Our findings also provide possible candidates for biomarkers of effectiveness in PD-1 blockade therapy, because mitochondrial activation did not occur in CTLs derived from mice bearing PD-1 blockade-insensitive tumors. It would be important to examine whether the mitochondrial metabolic changes detectable in sera, the OCR activity of CD8+ T cells, and/or RNA expression associated with mitochondrial activation signals could serve as biomarkers for responders using clinical samples before and after PD-1 mAb treatment. Synergistic enhancement of PD-1 blockade by chemicals will also save on the amount of expensive antibodies, which has been discussed as endangering the social security system.
Recent clinical observations have indicated that the efficacy of PD-1 blockade therapy for tumor regression depends largely on the preexisting CD8+ TILs (22, 24). However, in the current study, the DLN ablation completely cancelled the efficacy of the PD-1 blockade therapy, indicating that the numbers of preexisting CTLs in TILs are not enough for durable tumor-growth inhibition. We revealed that PD-1 blockade quickly triggers proliferation of TR CTLs in DLNs and that newly generated CTLs must be continuously supplied to tumor sites via a chemotactic pathway involving the CXCR3–MIG interaction. The results were also supported by experiments with FTY720, which inhibits the egression of T cells from LNs to the periphery. Although preexisting TILs were previously reported to be sufficient for B16 regression in a case of CTLA-4 and PD-1 double-blocking immunotherapy, the reported system differs from ours in the therapy mAb and timing and route of FTY720 administration (57). The most obvious effect of PD-L1 mAb is a prominent increase in the number of CD62L− CD44+ CXCR3+ CD8+ T cells in DLNs. This cellular subset, called “effector-memory,” contains heterogeneous activated T cells ready to execute their effector functions (58, 59). However, the surgical removal of tumors is often accompanied by the excision of DLNs, which could reduce the antitumor activity of the immune system. More careful studies are required to evaluate the impact of PD-1 blockade therapy in hosts with lymphadenectomy and to identify the best combinatorial treatment for such cases.
In conclusion, we discovered a series of chemicals that enhance the efficacy of PD-1 blockade therapy by reinvigorating mitochondrial energy metabolism. These findings open a new avenue for the study of PD-1–mediated T-cell regulation as well as a combinatorial treatment strategy for patients with cancers and possibly infectious diseases who are less sensitive to PD-1 blockade therapy alone. Notably, oltipraz and bezafibrate have already been used as clinical medicines, being applicable to clinical studies of combination therapy with PD-1 mAb (60, 61). The current study also suggests that mitochondrial activation parameters could be clinical biomarker candidates for distinction between responders and nonresponders to PD-1 blockade therapy.
Methods
Mice were maintained under specific pathogen-free conditions at the Institute of Laboratory Animals, Graduate School of Medicine, Kyoto University or RIKEN Center for Integrative Medical Sciences and used under protocols approved by the respective institutional review board (IRB).
SI Methods
Mice and Cells.
Mice were maintained under specific pathogen-free conditions at the Institute of Laboratory Animals, Graduate School of Medicine, Kyoto University or RIKEN Center for Integrative Medical Sciences and used under protocols approved by the respective institutional review board (IRB). C57BL/6 or BALB/c mice (5 to 6 wk old) were from Charles River Laboratories Japan. PD-1−/− mice were described before (62). The murine colon adenocarcinoma (MC38) cells were kindly provided by James P. Allison, Memorial Sloan Kettering Cancer Center, New York, NY. Lewis lung carcinoma (LLC) was obtained from American Type Culture Collection. Fibrosarcoma MethA was obtained from the Cell Resource Center for Biomedical Research. Cell lines were cultured in DMEM (Invitrogen) with 10% (wt/wt) heat-inactivated FBS and 1% antimycotic antibiotic (Invitrogen). These cell lines are not infected with mycobacteria.
Mouse Therapy Model.
Mouse colon cancer MC38 (5 × 10⁵), lung carcinoma LLC (1 × 10⁶), and fibrosarcoma MethA (5 × 10⁵) cells were intradermally injected on the right flank (day 0). MC38 and LLC were inoculated into C57BL/6 mice and MethA was inoculated into BALB/c mice. For monotherapy, mice were i.p. injected with 150 µg of PD-L1 mAb (clone 1-111A) or 100 µg of PD-1 mAb (4H2) 5 d after the tumor inoculation (day 5). Therapy was repeated three times every 5 d (shown in Fig. 1A). In the anti-CD8+ T cell-depletion experiment, 50 µg of anti-CD8 mAb (clone 53-6.7) (Bio X Cell) was i.v. injected on day 4. For the ablation of DLNs, axillary and inguinal LNs were surgically excised on day 4. In the CXCR3 blocking experiment, 50 µg of anti-CXCR3 mAb (clone CXCR3-173) (Bio X Cell) was i.p. injected at the same time as PD-L1 mAb administration. In the FTY720 experiment, FTY720 (2 mg/kg) (Sigma) was i.p. injected 1 d before the PD-L1 mAb injection (day 4) and every 2 d thereafter for 3 wk. For combination therapy, PD-L1 mAb and chemical agents were started at day 7 after tumor injection. In combination therapy, the starting point was delayed for 2 d compared with PD-L1 mAb monotherapy. For untreated mice, an isotype control for each functional mAb was injected. Chemical agents were injected at a regular interval of 2 d and PD-L1 mAb at a regular interval of 5 d (shown in Fig. 3B). Tumors were measured on every alternate day, and tumor volumes were calculated using the formula for typical ellipsoid π × (length × breadth × height)/6.
CD8−/− Mouse Model.
In the CD8−/− mouse model, CD8+ T cells were isolated from CD45.1 congenic mice using an autoMACS Pro Separator (Miltenyi Biotec). Isolated CD45.1+ CD8+ T cells were labeled with CellTrace Violet (Thermo Fisher Scientific) by incubating cells for 20 min with CellTrace diluted in phosphate-buffered saline (PBS). After washing, cells were (i.v.) injected into CD45.2 CD8−/− mice. After 5 d, MC38 (5 × 10⁵ cells) were intradermally injected and PD-L1 mAb was i.p. administered 8 d after tumor inoculation. Mice were killed 13 d after tumor inoculation.
Chemical Reagents.
The following chemical reagents were used at the indicated concentrations for combination therapy. AMPK activator: A769662, 6 mg/kg (Abcam); mTOR activator: MHY1485, 3 μg/kg (Sigma-Aldrich); uncoupler: FCCP, 1.2 mg/kg (Abcam); uncoupler: DNP, 1.7 mg/kg (Sigma-Aldrich); ROS scavenger: Mn (III) tetrakis (4-benzoic acid) porphyrin (MnTBAP), 1.25 mg/kg (Calbiochem); ROS generator: tert-butyl hydroperoxide solution, 200 μL/kg (Luperox TBH70X; Sigma-Aldrich); ROS generator: chaetocin, 250 μg/kg (Tocris); ROS generator: phytol, 1.15 mL/kg; ATP synthase inhibitor: oligomycin, 250 μg/kg (Sigma-Aldrich); oltipraz, 1.9 mg/kg (Sigma); bezafibrate, 1 mg/kg (ChemCruz). All reagents were freshly prepared just before use. Each reagent was dissolved in the solvent indicated in the instructions. Note that the AMPK activator, mTOR activator, and uncouplers were prepared from fresh unused vials in each series of experiments. Dissolved reagents were diluted in PBS and 200 μL was i.p. injected per mouse.
Measurement of Serum Metabolites.
For serum metabolomic analysis, metabolites were extracted with a mixture of methanol, chloroform, and water (2.5:1:1) and derivatized with methoxyamine followed by trimethylsilylation with N-methyl-N-trimethylsilyltrifluoroacetamide. The derivatized metabolites were separated on a DB-5 column (Agilent), and GC-MS measurement was performed in scan mode using a GCMS-QP2010 Ultra (Shimadzu). Metabolite peaks were identified by spectral library match and semiquantified using an internal standard.
RNA Sequencing.
Inguinal LNs were isolated from wild-type and PD-1−/− mice and stored in RNAlater Stabilization Solution (Thermo Fisher Scientific). Total RNA was isolated using TRIzol Reagent (Thermo Fisher Scientific). Subsequently, RNA quality and concentration were measured with an RNA 6000 Pico Kit (Agilent Technology), and the same amounts of RNA from seven individual mice were pooled. A library for RNA sequencing was prepared with a TruSeq RNA Library Preparation Kit v2 (Illumina) in accordance with the manufacturer’s protocol and sequenced using an Illumina HiSeq 2500 System [50 single base pair (sbp), single read]. Sequenced reads were mapped to the reference genome (mm10 assembly of the mouse genome) with TopHat (63). The abundance of transcripts was estimated as reads per kilobase of exon per million mapped reads.
Cytokine Bead Array Assay.
Concentrations of different cytokines in serum harvested from treated mice were quantitatively measured using beads coated with antibody against the different mouse cytokines IL-17A, IL-21, MIG, TNF-α, IFN-γ, IL-1β, IL-2, IL-4, IL-6, IL-10, and IL-12. Stained samples were run on a FACSCanto II flow cytometer (BD Biosciences) following the instructions. The data were analyzed using FACSArray software v3.0 (BD Biosciences).
ELISA.
MC38 was inoculated into mice and treated with PD-L1 mAb as described for monotherapy. MIG levels in the serum were measured quantitatively by a MIG ELISA Kit (Abcam) following the instructions in the kit’s manual.
Cell Preparation for Analysis.
For DLN analysis, cells from axillary, brachial, and inguinal LNs on the right side of tumor-bearing mice were harvested and mixed. Averaged cell numbers per one LN were used as absolute cell numbers. For TIL analysis, tumor tissue were minced into 2- to 3-mm pieces with scissors and digested with collagenase type IV (Thermo Fisher Scientific) using a gentleMACS Dissociator (Miltenyi Biotec). The numbers of TILs per mg were used as absolute numbers. Tumor cells were isolated from digested tumor tissues using a Tumor Cell Isolation Kit, mouse (Miltenyi Biotec), which can purify tumor cells by excluding lymphocytes, red blood cells, fibroblasts, endothelial cells, and tumor-associated stromal cells. We further isolated the tumor population by FACSAria (BD Biosciences) and used the purified tumor cells for flow cytometry and real-time RT-PCR analyses.
Flow Cytometry Analysis.
The following mAbs recognizing the indicated antigens were used: CD44 (1M7), CXCR3 (CXCR3-173), CD45.2 (104), CD45.1 (A20), CD8 (53-6.7), CD62L (MEL-14), MHC class I (AF6-88.5), CD155 (TX56), VISTA (MIH63), T-bet (4B10), and IFN-γ (XMG-1.2) from BioLegend; p-AMPK (EPR5683) from Abcam; PD-L1 (M1H5), p-mTOR (MRRBY), and Eomes (Danllmag) from eBioscience; and CD8 (KT15) from MBL Life Science. mLama4 tetramer (VGFNFRTL) and an unrelated tetramer (SIYRYYGL) were obtained from MBL Life Science. All flow cytometry experiments were performed on a FACSCanto II (BD Biosciences) and analyzed using FlowJo software. For assessment of intracellular phosphoproteins, cells were permeabilized with 0.5% Triton-X and fixed with 1.5% paraformaldehyde before staining. Determination of mitochondrial mass, membrane potential, mitochondrial superoxide, and cellular ROS was performed using MitoTracker Green, MitoTracker Deep Red, MitoSOX Red, and CellROX Green reagents, respectively (all from Life Technologies). These dyes were added to cells to a final concentration of 0.125, 0.125, 5.0, and 0.625 μM, respectively, and incubated at 37 °C in a 5% CO2 humidified incubator for 30 min, followed by surface staining.
Measurement of Oxygen Consumption Rates.
Oxygen consumption rates were measured using an XFe96 Extracellular Flux Analyzer (Seahorse Bioscience). Four hundred thousand cells per well were seeded in an XFe96 plate, determined by titration. The four pharmaceutical modulators of mitochondrial oxidative phosphorylation, which were equipped with an XFe Cell Mito Stress Test Kit (Seahorse Bioscience), were added sequentially. In brief, basal OCR measurement was followed by measurements taken after sequential addition of oligomycin, FCCP, and rotenone/antimycin A. ATP turnover was defined as (last rate measurement before oligomycin) − (minimum rate measurement after oligomycin injection) (27).
Real-Time RT-PCR.
We isolated RNA from purified CD8+ T cells or tumor cells with the RNeasy Mini Kit (Qiagen) and generated cDNA by reverse transcription (Invitrogen). Real-time PCR for PGC-1α was performed using the following primers: forward 5′-ACTCGGATTGCTCCGGCCCT-3′ and reverse 5′-ACTGACGGCCTAACTCCACCCA-3′. To examine the expression levels of genes associated with apoptosis and mitochondrial energy metabolism in tumor cells, we used RT2 Profiler PCR Array Gene Expression Kits PAMM-012Z and PAMM-008Z, respectively (Qiagen). The list of genes in the array plates can be found in www.sabiosciences.com/Apoptosis.php.
Western Blotting.
CD8+ T cells were isolated from DLNs using mouse CD8 MicroBeads (Miltenyi Biotec). After washing cells with PBS twice, 2 × 10⁶ cells were solubilized in a lysis buffer containing 30 mM Tris⋅HCl (pH.7.4), 150 mM Nacl, 10% glycerol, 0.1% SDS, 1% Triton-X 100, 0.05% Na-Doc, 5 mM EDTA (pH 8.0), protease inhibitor mixture (Roche Molecular Biochemicals), and phosphatase inhibitors (Nacalai Tesque). After measurement of protein concentration by DC protein assay (Bio-Rad), 4 μg of proteins was subjected to 4 to 20% gradient Mini-PROTEAN TGX Gels (Bio-Rad) and electroblotted onto nitrocellulose membranes, which were then incubated in a blocking buffer of 1% BSA in Tris-buffered saline. Primary antibody incubations were done overnight at 4 °C in blocking buffer. After washing, secondary antibody incubations were done at room temperature for 40 min in blocking buffer. Blots were developed with enhanced chemiluminescence (Amersham Pharmacia). Primary antibodies recognizing the following proteins were obtained from Cell Signaling Technology: phospho-mTOR (P-mTOR) (5536), phospho-AMPKα (P-AMPK) (2535), phospho-p70 S6 kinase (P-S6K) (9205), and 4E-BP1 (9644). An antibody recognizing PGC-1α (SC-13067) was obtained from Santa Cruz.
Statistical Analysis.
Statistical analysis was performed using Prism 6 (GraphPad). One-way ANOVA analysis followed by Sidak’s multiple comparison test was used to analyze three or more variables. For comparison of two groups, Student t test was used. All statistical tests were two-sided assuming parametric data, and a P value of <0.05 was considered significant. The variations of data were evaluated as the means ± SEM. Five or more samples are thought to be appropriate for the sample size estimate in this study. Samples and animals were randomly chosen from the pool and treated. No blinding test was used for the treatment of samples and animals.
Acknowledgments
We thank M. Al-Habs, M. Akrami, T. Oura, R. Hatae, Y. Nakajima, and K. Yurimoto for assistance with sample preparation; Y. Kitawaki for help with Western blotting; and Mikako Maruya, Michio Miyajima, and Takanobu Tsutsumi for help with RNA sequencing. This work was supported by Japan Agency for Medical Research and Development of Japan (AMED) Grants 145208 and 16770835 (to T.H.), Tang Prize Foundation (T.H.), the Cell Science Foundation and Grant-in-Aid for Young Scientists (A) Grant 16748159 (to K.C.), Tokyo Biochemical Research Foundation (P.S.C.), and AMED-CREST (AMED Grant 14532135; to S.F.).
Footnotes
The authors declare no conflict of interest.
This article contains supporting information online at www.pnas.org/lookup/suppl/doi:10.1073/pnas.1620433114/-/DCSupplemental.
References
- 1.Couzin-Frankel J. Breakthrough of the year 2013. Cancer immunotherapy. Science. 2013;342(6165):1432–1433. doi: 10.1126/science.342.6165.1432. [DOI] [PubMed] [Google Scholar]
- 2.Topalian SL, Drake CG, Pardoll DM. Immune checkpoint blockade: A common denominator approach to cancer therapy. Cancer Cell. 2015;27(4):450–461. doi: 10.1016/j.ccell.2015.03.001. [DOI] [PMC free article] [PubMed] [Google Scholar]
- 3.Okazaki T, Chikuma S, Iwai Y, Fagarasan S, Honjo T. A rheostat for immune responses: The unique properties of PD-1 and their advantages for clinical application. Nat Immunol. 2013;14(12):1212–1218. doi: 10.1038/ni.2762. [DOI] [PubMed] [Google Scholar]
- 4.Brahmer JR, et al. Phase I study of single-agent anti-programmed death-1 (MDX-1106) in refractory solid tumors: Safety, clinical activity, pharmacodynamics, and immunologic correlates. J Clin Oncol. 2010;28(19):3167–3175. doi: 10.1200/JCO.2009.26.7609. [DOI] [PMC free article] [PubMed] [Google Scholar]
- 5.Zou W, Wolchok JD, Chen L. PD-L1 (B7-H1) and PD-1 pathway blockade for cancer therapy: Mechanisms, response biomarkers, and combinations. Sci Transl Med. 2016;8(328):328rv4. doi: 10.1126/scitranslmed.aad7118. [DOI] [PMC free article] [PubMed] [Google Scholar]
- 6.Robert C, et al. Nivolumab in previously untreated melanoma without BRAF mutation. N Engl J Med. 2015;372(4):320–330. doi: 10.1056/NEJMoa1412082. [DOI] [PubMed] [Google Scholar]
- 7.Mahoney KM, Rennert PD, Freeman GJ. Combination cancer immunotherapy and new immunomodulatory targets. Nat Rev Drug Discov. 2015;14(8):561–584. doi: 10.1038/nrd4591. [DOI] [PubMed] [Google Scholar]
- 8.Okazaki T, Maeda A, Nishimura H, Kurosaki T, Honjo T. PD-1 immunoreceptor inhibits B cell receptor-mediated signaling by recruiting src homology 2-domain-containing tyrosine phosphatase 2 to phosphotyrosine. Proc Natl Acad Sci USA. 2001;98(24):13866–13871. doi: 10.1073/pnas.231486598. [DOI] [PMC free article] [PubMed] [Google Scholar]
- 9.Li J, et al. PD-1/SHP-2 inhibits Tc1/Th1 phenotypic responses and the activation of T cells in the tumor microenvironment. Cancer Res. 2015;75(3):508–518. doi: 10.1158/0008-5472.CAN-14-1215. [DOI] [PMC free article] [PubMed] [Google Scholar]
- 10.Nishimura H, Nose M, Hiai H, Minato N, Honjo T. Development of lupus-like autoimmune diseases by disruption of the PD-1 gene encoding an ITIM motif-carrying immunoreceptor. Immunity. 1999;11(2):141–151. doi: 10.1016/s1074-7613(00)80089-8. [DOI] [PubMed] [Google Scholar]
- 11.Nishimura H, et al. Autoimmune dilated cardiomyopathy in PD-1 receptor-deficient mice. Science. 2001;291(5502):319–322. doi: 10.1126/science.291.5502.319. [DOI] [PubMed] [Google Scholar]
- 12.Okazaki T, et al. Autoantibodies against cardiac troponin I are responsible for dilated cardiomyopathy in PD-1-deficient mice. Nat Med. 2003;9(12):1477–1483. doi: 10.1038/nm955. [DOI] [PubMed] [Google Scholar]
- 13.Iwai Y, et al. Involvement of PD-L1 on tumor cells in the escape from host immune system and tumor immunotherapy by PD-L1 blockade. Proc Natl Acad Sci USA. 2002;99(19):12293–12297. doi: 10.1073/pnas.192461099. [DOI] [PMC free article] [PubMed] [Google Scholar]
- 14.Iwai Y, Terawaki S, Ikegawa M, Okazaki T, Honjo T. PD-1 inhibits antiviral immunity at the effector phase in the liver. J Exp Med. 2003;198(1):39–50. doi: 10.1084/jem.20022235. [DOI] [PMC free article] [PubMed] [Google Scholar]
- 15.Topalian SL, et al. Safety, activity, and immune correlates of anti-PD-1 antibody in cancer. N Engl J Med. 2012;366(26):2443–2454. doi: 10.1056/NEJMoa1200690. [DOI] [PMC free article] [PubMed] [Google Scholar]
- 16.Brahmer JR, et al. Safety and activity of anti-PD-L1 antibody in patients with advanced cancer. N Engl J Med. 2012;366(26):2455–2465. doi: 10.1056/NEJMoa1200694. [DOI] [PMC free article] [PubMed] [Google Scholar]
- 17.van der Windt GJ, et al. CD8 memory T cells have a bioenergetic advantage that underlies their rapid recall ability. Proc Natl Acad Sci USA. 2013;110(35):14336–14341. doi: 10.1073/pnas.1221740110. [DOI] [PMC free article] [PubMed] [Google Scholar]
- 18.Sena LA, et al. Mitochondria are required for antigen-specific T cell activation through reactive oxygen species signaling. Immunity. 2013;38(2):225–236. doi: 10.1016/j.immuni.2012.10.020. [DOI] [PMC free article] [PubMed] [Google Scholar]
- 19.Uzhachenko R, Shanker A, Yarbrough WG, Ivanova AV. Mitochondria, calcium, and tumor suppressor Fus1: At the crossroad of cancer, inflammation, and autoimmunity. Oncotarget. 2015;6(25):20754–20772. doi: 10.18632/oncotarget.4537. [DOI] [PMC free article] [PubMed] [Google Scholar]
- 20.Turrens JF. Mitochondrial formation of reactive oxygen species. J Physiol. 2003;552(Pt 2):335–344. doi: 10.1113/jphysiol.2003.049478. [DOI] [PMC free article] [PubMed] [Google Scholar]
- 21.Weinberg SE, Sena LA, Chandel NS. Mitochondria in the regulation of innate and adaptive immunity. Immunity. 2015;42(3):406–417. doi: 10.1016/j.immuni.2015.02.002. [DOI] [PMC free article] [PubMed] [Google Scholar]
- 22.Tumeh PC, et al. PD-1 blockade induces responses by inhibiting adaptive immune resistance. Nature. 2014;515(7528):568–571. doi: 10.1038/nature13954. [DOI] [PMC free article] [PubMed] [Google Scholar]
- 23.McGranahan N, et al. Clonal neoantigens elicit T cell immunoreactivity and sensitivity to immune checkpoint blockade. Science. 2016;351(6280):1463–1469. doi: 10.1126/science.aaf1490. [DOI] [PMC free article] [PubMed] [Google Scholar]
- 24.Gubin MM, et al. Checkpoint blockade cancer immunotherapy targets tumour-specific mutant antigens. Nature. 2014;515(7528):577–581. doi: 10.1038/nature13988. [DOI] [PMC free article] [PubMed] [Google Scholar]
- 25.Jang KJ, et al. Mitochondrial function provides instructive signals for activation-induced B-cell fates. Nat Commun. 2015;6:6750. doi: 10.1038/ncomms7750. [DOI] [PMC free article] [PubMed] [Google Scholar]
- 26.van der Windt GJW, Chang C-H, Pearce EL. Measuring bioenergetics in T cells using a Seahorse Extracellular Flux Analyzer. Curr Protoc Immunol. 2016;113:16B.1–16B.14. doi: 10.1002/0471142735.im0316bs113. [DOI] [PMC free article] [PubMed] [Google Scholar]
- 27.Trachootham D, Alexandre J, Huang P. Targeting cancer cells by ROS-mediated mechanisms: A radical therapeutic approach? Nat Rev Drug Discov. 2009;8(7):579–591. doi: 10.1038/nrd2803. [DOI] [PubMed] [Google Scholar]
- 28.Dixit D, Ghildiyal R, Anto NP, Sen E. Chaetocin-induced ROS-mediated apoptosis involves ATM-YAP1 axis and JNK-dependent inhibition of glucose metabolism. Cell Death Dis. 2014;5:e1212. doi: 10.1038/cddis.2014.179. [DOI] [PMC free article] [PubMed] [Google Scholar]
- 29.Gloerich J, et al. A phytol-enriched diet induces changes in fatty acid metabolism in mice both via PPARalpha-dependent and -independent pathways. J Lipid Res. 2005;46(4):716–726. doi: 10.1194/jlr.M400337-JLR200. [DOI] [PubMed] [Google Scholar]
- 30.Krauss S, Zhang CY, Lowell BB. The mitochondrial uncoupling-protein homologues. Nat Rev Mol Cell Biol. 2005;6(3):248–261. doi: 10.1038/nrm1592. [DOI] [PubMed] [Google Scholar]
- 31.Brand MD. Uncoupling to survive? The role of mitochondrial inefficiency in ageing. Exp Gerontol. 2000;35(6–7):811–820. doi: 10.1016/s0531-5565(00)00135-2. [DOI] [PubMed] [Google Scholar]
- 32.Olsson M, Wilson M, Uller T, Isaksson C. Free radicals run in lizard families without (and perhaps with) mitochondrial uncoupling. Biol Lett. 2009;5(3):345–346. doi: 10.1098/rsbl.2009.0115. [DOI] [PMC free article] [PubMed] [Google Scholar]
- 33.Han YH, Kim SH, Kim SZ, Park WH. Carbonyl cyanide p-(trifluoromethoxy) phenylhydrazone (FCCP) as an O2(−) generator induces apoptosis via the depletion of intracellular GSH contents in Calu-6 cells. Lung Cancer. 2009;63(2):201–209. doi: 10.1016/j.lungcan.2008.05.005. [DOI] [PubMed] [Google Scholar]
- 34.Friederich-Persson M, et al. Kidney hypoxia, attributable to increased oxygen consumption, induces nephropathy independently of hyperglycemia and oxidative stress. Hypertension. 2013;62(5):914–919. doi: 10.1161/HYPERTENSIONAHA.113.01425. [DOI] [PMC free article] [PubMed] [Google Scholar]
- 35.Rohas LM, et al. A fundamental system of cellular energy homeostasis regulated by PGC-1alpha. Proc Natl Acad Sci USA. 2007;104(19):7933–7938. doi: 10.1073/pnas.0702683104. [DOI] [PMC free article] [PubMed] [Google Scholar]
- 36.Chi H. Regulation and function of mTOR signalling in T cell fate decisions. Nat Rev Immunol. 2012;12(5):325–338. doi: 10.1038/nri3198. [DOI] [PMC free article] [PubMed] [Google Scholar]
- 37.Araki K, Ahmed R. AMPK: A metabolic switch for CD8+ T-cell memory. Eur J Immunol. 2013;43(4):878–881. doi: 10.1002/eji.201343483. [DOI] [PubMed] [Google Scholar]
- 38.Buck MD, O’Sullivan D, Pearce EL. T cell metabolism drives immunity. J Exp Med. 2015;212(9):1345–1360. doi: 10.1084/jem.20151159. [DOI] [PMC free article] [PubMed] [Google Scholar]
- 39.Siska PJ, Rathmell JC. T cell metabolic fitness in antitumor immunity. Trends Immunol. 2015;36(4):257–264. doi: 10.1016/j.it.2015.02.007. [DOI] [PMC free article] [PubMed] [Google Scholar]
- 40.Finlay D, Cantrell DA. Metabolism, migration and memory in cytotoxic T cells. Nat Rev Immunol. 2011;11(2):109–117. doi: 10.1038/nri2888. [DOI] [PMC free article] [PubMed] [Google Scholar]
- 41.Blagih J, et al. The energy sensor AMPK regulates T cell metabolic adaptation and effector responses in vivo. Immunity. 2015;42(1):41–54. doi: 10.1016/j.immuni.2014.12.030. [DOI] [PubMed] [Google Scholar]
- 42.Kimball SR, Do AN, Kutzler L, Cavener DR, Jefferson LS. Rapid turnover of the mTOR complex 1 (mTORC1) repressor REDD1 and activation of mTORC1 signaling following inhibition of protein synthesis. J Biol Chem. 2008;283(6):3465–3475. doi: 10.1074/jbc.M706643200. [DOI] [PMC free article] [PubMed] [Google Scholar]
- 43.Morita M, et al. mTOR coordinates protein synthesis, mitochondrial activity and proliferation. Cell Cycle. 2015;14(4):473–480. doi: 10.4161/15384101.2014.991572. [DOI] [PMC free article] [PubMed] [Google Scholar]
- 44.Ventura-Clapier R, Garnier A, Veksler V. Transcriptional control of mitochondrial biogenesis: The central role of PGC-1alpha. Cardiovasc Res. 2008;79(2):208–217. doi: 10.1093/cvr/cvn098. [DOI] [PubMed] [Google Scholar]
- 45.Sano M, et al. Intramolecular control of protein stability, subnuclear compartmentalization, and coactivator function of peroxisome proliferator-activated receptor gamma coactivator 1alpha. J Biol Chem. 2007;282(35):25970–25980. doi: 10.1074/jbc.M703634200. [DOI] [PubMed] [Google Scholar]
- 46.Yu Z, et al. Oltipraz upregulates the nuclear factor (erythroid-derived 2)-like 2 [corrected](NRF2) antioxidant system and prevents insulin resistance and obesity induced by a high-fat diet in C57BL/6J mice. Diabetologia. 2011;54(4):922–934. doi: 10.1007/s00125-010-2001-8. [DOI] [PubMed] [Google Scholar]
- 47.Tenenbaum A, Fisman EZ. Balanced pan-PPAR activator bezafibrate in combination with statin: Comprehensive lipids control and diabetes prevention? Cardiovasc Diabetol. 2012;11:140. doi: 10.1186/1475-2840-11-140. [DOI] [PMC free article] [PubMed] [Google Scholar]
- 48.Rao RR, Li Q, Gubbels Bupp MR, Shrikant PA. Transcription factor Foxo1 represses T-bet-mediated effector functions and promotes memory CD8(+) T cell differentiation. Immunity. 2012;36(3):374–387. doi: 10.1016/j.immuni.2012.01.015. [DOI] [PMC free article] [PubMed] [Google Scholar]
- 49.Cunningham JT, et al. mTOR controls mitochondrial oxidative function through a YY1-PGC-1alpha transcriptional complex. Nature. 2007;450(7170):736–740. doi: 10.1038/nature06322. [DOI] [PubMed] [Google Scholar]
- 50.Toyama EQ, et al. AMP-activated protein kinase mediates mitochondrial fission in response to energy stress. Science. 2016;351(6270):275–281. doi: 10.1126/science.aab4138. [DOI] [PMC free article] [PubMed] [Google Scholar]
- 51.Inoki K, Kim J, Guan KL. AMPK and mTOR in cellular energy homeostasis and drug targets. Annu Rev Pharmacol Toxicol. 2012;52:381–400. doi: 10.1146/annurev-pharmtox-010611-134537. [DOI] [PubMed] [Google Scholar]
- 52.Berrien-Elliott MM, et al. Checkpoint blockade immunotherapy relies on T-bet but not Eomes to induce effector function in tumor-infiltrating CD8+ T cells. Cancer Immunol Res. 2015;3(2):116–124. doi: 10.1158/2326-6066.CIR-14-0159. [DOI] [PMC free article] [PubMed] [Google Scholar]
- 53.Paley MA, et al. Progenitor and terminal subsets of CD8+ T cells cooperate to contain chronic viral infection. Science. 2012;338(6111):1220–1225. doi: 10.1126/science.1229620. [DOI] [PMC free article] [PubMed] [Google Scholar]
- 54.Staron MM, et al. The transcription factor FoxO1 sustains expression of the inhibitory receptor PD-1 and survival of antiviral CD8(+) T cells during chronic infection. Immunity. 2014;41(5):802–814. doi: 10.1016/j.immuni.2014.10.013. [DOI] [PMC free article] [PubMed] [Google Scholar]
- 55.Bengsch B, et al. Bioenergetic insufficiencies due to metabolic alterations regulated by the inhibitory receptor PD-1 are an early driver of CD8(+) T cell exhaustion. Immunity. 2016;45(2):358–373. doi: 10.1016/j.immuni.2016.07.008. [DOI] [PMC free article] [PubMed] [Google Scholar]
- 56.Scharping NE, et al. The tumor microenvironment represses T cell mitochondrial biogenesis to drive intratumoral T cell metabolic insufficiency and dysfunction. Immunity. 2016;45(2):374–388. doi: 10.1016/j.immuni.2016.07.009. [DOI] [PMC free article] [PubMed] [Google Scholar]
- 57.Spranger S, et al. Mechanism of tumor rejection with doublets of CTLA-4, PD-1/PD-L1, or IDO blockade involves restored IL-2 production and proliferation of CD8(+) T cells directly within the tumor microenvironment. J Immunother Cancer. 2014;2:3. doi: 10.1186/2051-1426-2-3. [DOI] [PMC free article] [PubMed] [Google Scholar]
- 58.Kinjyo I, et al. Real-time tracking of cell cycle progression during CD8+ effector and memory T-cell differentiation. Nat Commun. 2015;6:6301. doi: 10.1038/ncomms7301. [DOI] [PMC free article] [PubMed] [Google Scholar]
- 59.Opferman JT, Ober BT, Ashton-Rickardt PG. Linear differentiation of cytotoxic effectors into memory T lymphocytes. Science. 1999;283(5408):1745–1748. doi: 10.1126/science.283.5408.1745. [DOI] [PubMed] [Google Scholar]
- 60.Bammler TK, Slone DH, Eaton DL. Effects of dietary oltipraz and ethoxyquin on aflatoxin B1 biotransformation in non-human primates. Toxicol Sci. 2000;54(1):30–41. doi: 10.1093/toxsci/54.1.30. [DOI] [PubMed] [Google Scholar]
- 61.Markt P, Schuster D, Kirchmair J, Laggner C, Langer T. Pharmacophore modeling and parallel screening for PPAR ligands. J Comput Aided Mol Des. 2007;21(10–11):575–590. doi: 10.1007/s10822-007-9140-0. [DOI] [PubMed] [Google Scholar]
- 62.Nishimura H, Minato N, Nakano T, Honjo T. Immunological studies on PD-1 deficient mice: Implication of PD-1 as a negative regulator for B cell responses. Int Immunol. 1998;10(10):1563–1572. doi: 10.1093/intimm/10.10.1563. [DOI] [PubMed] [Google Scholar]
- 63.Trapnell C, Pachter L, Salzberg SL. TopHat: Discovering splice junctions with RNA-seq. Bioinformatics. 2009;25(9):1105–1111. doi: 10.1093/bioinformatics/btp120. [DOI] [PMC free article] [PubMed] [Google Scholar]


