Significance
Experimental verifications of the theoretically predicted topological insulators (TIs) are essential steps toward the applications of the topological quantum phenomena. In the past, theoretically predicted TIs were mostly verified by the measurements of the topological surface states. However, as another key feature of the nontrivial topology in TIs, an inversion between the bulk bands has rarely been observed by experiments. Here, by studying the optical transitions between the bulk LLs of ZrTe5, we not only offer spectroscopic evidence for the bulk-band inversion—the crossing of the two zeroth LLs in a magnetic field, but also quantitatively demonstrate three-dimensional massive Dirac fermions with nearly linear band dispersions in ZrTe5. Our investigation provides a paradigm for identifying TI states in candidate materials.
Keywords: band inversion, Dirac fermions, topological insulators, Landau levels, Zeeman splitting
Abstract
Three-dimensional topological insulators (3D TIs) represent states of quantum matters in which surface states are protected by time-reversal symmetry and an inversion occurs between bulk conduction and valence bands. However, the bulk-band inversion, which is intimately tied to the topologically nontrivial nature of 3D Tis, has rarely been investigated by experiments. Besides, 3D massive Dirac fermions with nearly linear band dispersions were seldom observed in TIs. Recently, a van der Waals crystal, ZrTe5, was theoretically predicted to be a TI. Here, we report an infrared transmission study of a high-mobility [∼33,000 cm2/(V ⋅ s)] multilayer ZrTe5 flake at magnetic fields (B) up to 35 T. Our observation of a linear relationship between the zero-magnetic-field optical absorption and the photon energy, a bandgap of ∼10 meV and a dependence of the Landau level (LL) transition energies at low magnetic fields demonstrates 3D massive Dirac fermions with nearly linear band dispersions in this system. More importantly, the reemergence of the intra-LL transitions at magnetic fields higher than 17 T reveals the energy cross between the two zeroth LLs, which reflects the inversion between the bulk conduction and valence bands. Our results not only provide spectroscopic evidence for the TI state in ZrTe5 but also open up a new avenue for fundamental studies of Dirac fermions in van der Waals materials.
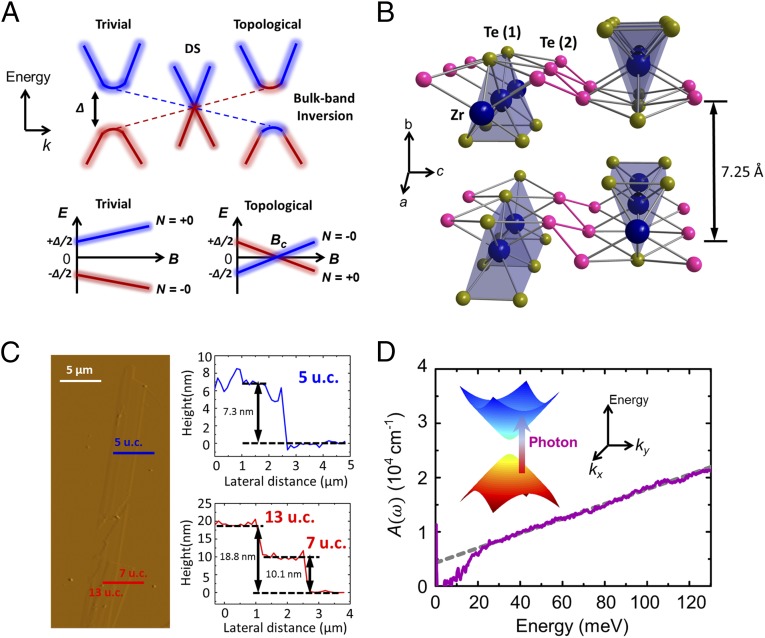
Topologically nontrivial quantum matters, such as topological insulators (1–8), Dirac semimetals (9–19), and Weyl semimetals (20–27), have sparked enormous interest owing both to their exotic electronic properties and potential applications in spintronic devices and quantum computing. Therein, intrinsic topological insulators have insulating bulk states with odd Z2 topological invariants and metallic surface or edge states protected by time-reversal symmetry (4–6, 28). Most of the experimental evidence to date for TIs is provided by the measurements of the spin texture of the metallic surface states. As a hallmark of the nontrivial Z2 topology of TIs (4–6, 28), an inversion between the characteristics of the bulk conduction and valence bands occurring at an odd number of time-reversal invariant momenta has seldom been probed by experiments. An effective approach for identifying the bulk-band inversion in TIs is to follow the evolution of two zeroth Landau levels (LLs) that arise from the bulk conduction and valence bands, respectively. As shown in Fig. 1A, for TIs, due to the bulk-band inversion and Zeeman effects, the two zeroth bulk Landau levels are expected to intersect in a critical magnetic field and then separate (3, 29); and for trivial insulators, the energy difference between their two zeroth Landau levels would become larger with increasing magnetic field. Therefore, an intersection between the two zeroth bulk LLs is a significant signature of the bulk-band inversion in TIs. However, a spectroscopic study of the intersection between the two zeroth bulk LLs in 3D TIs is still missing. In addition, many typical 3D TIs, such as Bi2Se3, show massive bulk Dirac fermions with parabolic band dispersions, which are effectively described by massive Dirac models (6, 28, 29). By contrast, 3D massive Dirac fermions with nearly linear bulk band dispersions (7), which are interesting topics following 2D massive Dirac fermions in gapped graphene (30, 31), were rarely observed in 3D TIs.
Fig. 1.
Bulk band and crystal structure of ZrTe5. (A, Top) Schematic of the topological phase transition from trivial to topological insulators. A 3D Dirac semimetal (DS) can be regarded as a quantum critical point with a gapless band structure. Due to the bulk-band inversion in TIs, the conduction and valence band exchange their extrema. Bottom row: energy spectrum for the Landau-index N = +0 and 0 LLs with a Zeeman splitting. (B) Atomic structure of ZrTe5. Each unit cell contains two ZrTe5 layers. (C, Left) AFM image of ZrTe5 flakes. (Right) thicknesses along the colored lines on the left. Thicknesses from 5 to 13 unit cells (u.c.) are shown. (D) Absorption coefficient A() of the ZrTe5 flake with thickness d ∼180 nm as a function of photon energy at B = 0 T. The linear energy dependence of A() is mainly associated with interband transitions of 3D Dirac electrons. A sudden drop in A() at low energies implies the modification of the band structures within an energy range, namely the bandgap. D, Inset depicts the interband absorption in gapped ZrTe5.
A transition-metal pentatelluride, ZrTe5, embodies both 1D chain and 2D layer features (32), shown in Fig. 1B. One Zr atom together with three Te (1) atoms forms a quasi-1D prismatic chain ZrTe3 along the a axis (x axis). These prismatic ZrTe3 chains are connected through zig-zag chains of Te (2) atoms along the c axis (y axis) and then construct quasi-2D ZrTe5 layers. The bonding between ZrTe5 layers is van der Waals type (33, 34). Thus, as displayed in Fig. 1C, bulk ZrTe5 crystals can be easily cleaved down to a few layers. Recently, the ab initio calculations indicate that monolayer ZrTe5 sheets are great contenders for quantum spin Hall insulators—2D TI and that 3D ZrTe5 crystals are quite close to the phase boundary between strong and weak TIs (33). Scanning tunneling microscopy measurements have shown that edge states exist at the step edges of the ZrTe5 surfaces (35, 36). Nonetheless, further investigations are needed to check whether the observed edge states in ZrTe5 are topologically nontrivial or not. Studying the bulk-band inversion or the intersection between the two zeroth bulk LLs can provide a crucial clue to clarifying the nature of the edge states in ZrTe5. Except the edge states within the energy gap of the bulk bands around the Brillouin zone center (i.e., Γ point) of ZrTe5 (36, 37), 3D massless Dirac fermions with the linearly dispersing conduction and valence band degenerate at the Γ point were suggested to exist in this material by previous angle-resolved photon emission spectroscopy, transport, and optical experiments (38–41). Considering that (i) our ZrTe5 thick crystals were experimentally shown to be Dirac semimetals hosting 3D massless Dirac fermions, (ii) ZrTe5 monolayers were theoretically predicted to be quantum spin Hall insulators, and (iii) the bulk state of ZrTe5 is very sensitive to its interlayer distance, which might be a discrepancy in different samples (33, 40); it is significant to quantitatively verify whether 3D massive Dirac fermions with a bandgap and nearly linear bulk-band dispersions can be realized in dramatically thinned flakes of our ZrTe5 crystals.
Infrared spectroscopy is a bulk-sensitive experimental technique for studying low-energy excitations of a material. Here, to investigate the bulk-band inversion and the nature of the bulk fermions in ZrTe5, we measured the infrared transmission spectra T(, B) of its multilayer flake with thickness d ∼180 nm at magnetic fields applied along the wave vector of the incident light (Materials and Methods and Supporting Information). A series of intra- and inter-LL transitions are present in the relative transmission spectra T(B)/T(B0 = 0 T) of the ZrTe5 flake. The linear dependence of the LL transition energies at B ≤ 4 T and the nonzero intercept of the LL transitions at B = 0 T, combined with the linear relationship between the zero-magnetic-field optical absorption and the photon energy, indicates 3D massive Dirac fermions with nearly linear band dispersions in the ZrTe5 flake. Moreover, a 3D massive Dirac model with a bandgap of ∼10 meV can quantitatively explain the magnetic-field dependence of the measured LL transition energies very well. At high magnetic fields, we observed fourfold splittings of the LL transitions. In addition, our analysis of the split LL transitions shows that the intra-LL transitions, which are associated to the two zeroth LLs and disappear at B ∼ 2.5 T, reemerge at B > 17 T. Considering that the zeroth LL crossing in a Zeeman field would make the two zeroth bulk LLs intersect with the chemical potential here and then alter the carrier occupation on the zeroth LLs, we attribute the reemergence of the intra-LL transitions in the ZrTe5 flake to the energy crossing of its two zeroth bulk LLs, which originates from the bulk-band inversion. These results strongly support the theoretically predicted 3D TI states in 3D ZrTe5 crystals.
Results
Three-Dimensional Massive Dirac Fermions.
At zero magnetic field, the measured absolute transmission T() corresponds to the absorption coefficient: A() = −[lnT()]/d, where d is the thickness of the sample and is the photon energy (see the methods section of ref. 42). In solids, the absorption coefficient is determined by the joint density of state D(): A() D()/. Three-dimensional electron systems with linear band dispersions along three momentum directions have the D() proportional to 2, and for 2D linear dispersions, D() . Thus, in stark contrast to the -independent absorption of 2D Dirac materials like graphene (43), the linear dependence of A() in Fig. 1D indicates 3D linear band dispersions in ZrTe5. Moreover, at low energies, the absorption coefficient apparently deviates from the linear relationship with implying the opening of a bandgap at the original Dirac point. The 3D linear band dispersions, together with the possible bandgap, suggest the presence of 3D massive Dirac fermions in the exfoliated ZrTe5 flake.
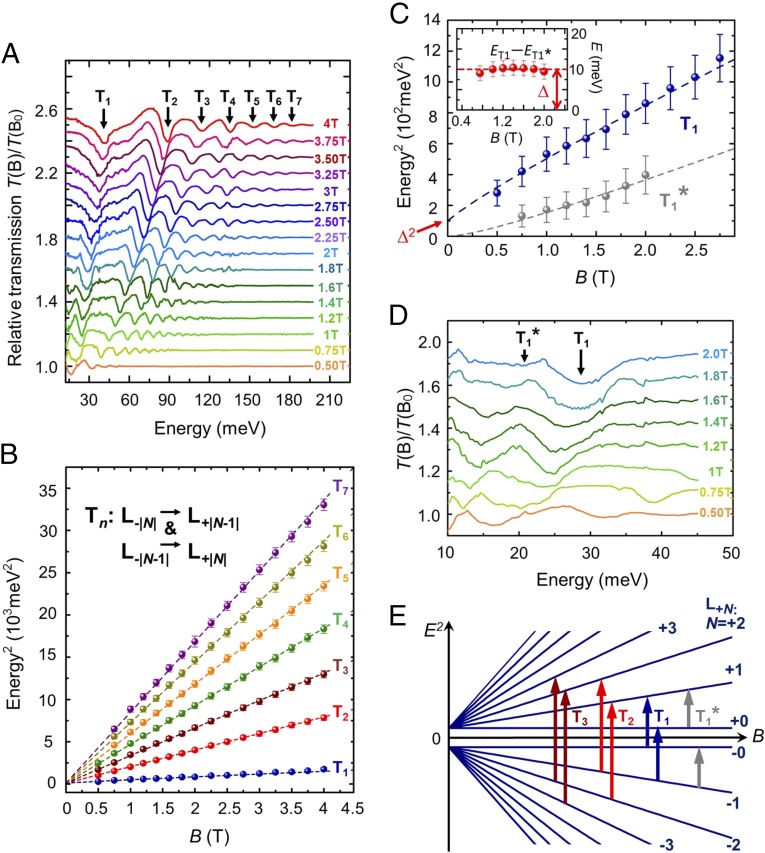
To confirm the 3D massive Dirac fermions in ZrTe5, we further performed infrared transmission experiments at magnetic fields applied perpendicular to the ac plane (xy plane) of the crystal (Faraday geometry). The low-field relative transmission T(B)/T(B0 = 0 T) spectra in Fig. 2A show seven dip features Tn (1 n 7) directly corresponding to the absorption peaks of LL transitions. All of these dip features systematically shift to higher energies, as the magnetic field increases. Here, we define the energy positions of the transmission minima in T(B)/T(B0) as the absorption energies, which is a usual definition in thin film systems, such as Bi2Se3 films and graphene. Then, we plotted the square of the Tn energies () as a function of magnetic field in Fig. 2B. The linear B dependence of (i.e., linear dependence of ) reveals the LL transitions of Dirac fermions (31, 44, 45). In Fig. 2C, the nonzero intercept of the linear fit to at zero magnetic field is an important signature of a nonzero Dirac mass or a bandgap (31). Therefore, the linear relationship between and B, together with the nonzero intercept, provides further evidence for 3D massive Dirac fermions in the ZrTe5 flake.
Fig. 2.
Low-magnetic-field Landau level transitions in ZrTe5. (A) Absorption features Tn (1 n 7) in T(B)/T(B0) spectra. The spectra are displaced from one another by 0.1 for clarity. (B, C) Squares of Tn and T1* energies plotted as a function of magnetic field (B 4 T). Tn correspond to the interband LL transitions: (or ). The nonzero at zero field reveals a bandgap ∆. C, Inset shows the energy difference between T1 and T1*, which equals to the bandgap. (D) Absorption features T1* in T(B)/T(B0) spectra. T1*, which is located at energies lower than T1, arises from the intraband LL transition (or ). (E) Schematic of the Landau level spectrum without a Zeeman splitting and the allowed optical transitions, shown in a − plot.
To quantitatively check the 3D massive Dirac fermions in the ZrTe5 flake, we use a 3D massive Dirac Hamiltonian, which was derived from the low-energy effective k ⋅ p Hamiltonian based on the spin–orbital coupling, the point group and time-reversal symmetries in ZrTe5, and includes the spin degree of freedom (40). According to the 3D massive Dirac Hamiltonian expanded to the linear order of momenta, we can obtained the nearly linear band dispersions of ZrTe5 at zero magnetic field: , where are the wave vectors in momentum space, are the Fermi velocities along three momentum directions, is the bandgap and describes the mass of Dirac fermions = and is Planck’s constant divided by 2π. In a magnetic field applied perpendicular to the ac plane, the LL spectrum of ZrTe5 without considering Zeeman effects has the form:
| [1] |
where is the effective Fermi velocity of LLs, the integer N is Landau index, is the Kronecker delta function, sgn(N) is the sign function, and e is the elementary charge. The dependence is a hallmark of Dirac fermions (31, 44, 45). According to Eq. 1, the magnetic field makes the 3D linear band dispersions evolve into a series of 1D non-equally-spaced Landau levels (or bands), which disperse with the momentum component along the field direction. Specifically, because the 3D massive Dirac Hamiltonian of ZrTe5 involves the spin degree of freedom of this system, two zeroth LLs indexed by and locate at the hole and electron band extrema, respectively, and have energy dispersions , which is different from the case that when the spin degree of freedom was not considered in materials with the hexagonal lattice, only one zeroth nondegenerate Landau level is present in each valley (46). The optical selection rule for ZrTe5 only allows the LL transitions from LLN to LLN’: ΔN = – = ±1 and with the -momentum difference Δ = 0 (40). Due to the singularities of the density of states (DOS) at , magneto-optical response here, which is determined by the joint DOS, should be mainly contributed by the LL transitions at (29, 40). Thus, the energies of the interband LL (inter-LL) transitions (or ) and the intraband LL (intra-LL) transitions (or ), and at , are given by:
| [2] |
| [3] |
From to , the slopes of the linear fits to in Fig. 2B scale as 1: 5.7: 9.3: 13.1: 16.7: 20.5: 24.1, respectively, which is close to the approximate ratio of the theoretical inter-LL transition energies based on Eq. 2, 1: ( + )2 (∼ 5.8): ( + )2 (∼ 9.9): ( + )2 (∼ 13.9): ( + )2 (∼ 17.9): ( + )2 (∼ 21.9): ( + )2 (∼ 25.9). Therefore, the absorption features Tn are assigned as the inter-LL transitions: (or ) (Fig. 2B) and we have n = , where 1 n 7. Fitting based on Eq. 2 from a least square fit yields a bandgap ∼ 10 ± 2 meV, the effective Fermi velocities (4.76 ± 0.04) 105 m/s and (5.04–4.95 ± 0.04) 105 m/s (Supporting Information).
As another signature of the bandgap or the nonzero Dirac mass, the absorption feature T1* is present at energies lower than the lowest-energy inter-LL transition T1 in Fig. 2D. The feature T1* is attributed to the intra-LL transition (or ), illustrated by the gray arrows in Fig. 2E (Supporting Information). According to Eqs. 2 and 3, the energy difference (ET1 ET1*) between the transitions T1 and T1* in the inset of Fig. 2C directly gives the bandgap value 10 ± 2 meV, which is consistent with the value obtained by the above fitting. Furthermore, the field dependence of the T1* energy in Fig. 2C can be well fitted by Eq. 3 with ∼ 10 ± 2 meV and (4.63 ± 0.04) 105 m/s.
The carrier-charge mobility in the ZrTe5 flake can be calculated using the general equation (47): e( m*), where is the transport scattering rate and m* is the carrier effective mass on the anisotropic Fermi surface (48, 49). Here, the transport scattering rate within the ac plane can be roughly estimated from the width of the T1 feature at low fields: ∼ 9 meV at B = 0.5 T. Moreover, considering the absence of Pauli blocking of the T1 transition at B = 0.5 T, we get the Fermi energy in ZrTe5, 15 meV (Supporting Information), which means the Fermi level in our sample is quite close to the band extrema. In this case, the average effective mass m* of the carriers within the ac plane can be described by (30): mac* [2()2] 3.54 10−33 kg 0.00389 m0, where m0 is the free electron mass and the average Fermi velocity within the ac plane is approximately equal to the effective Fermi velocity of the LLs, 4.76 105 m/s. Finally, we can estimate the mobility of the carriers within the ac plane of our ZrTe5 sample: 33,000 cm2/(V ⋅ s), which is comparable to those in graphene/h-BN heterostructures (50, 51).
Buk-Band Inversion.
As shown in Fig. 3A, applying a higher magnetic field enables us to observe the splitting of the T1 transition, which indicates a nonnegligible Zeeman effect in ZrTe5 (40). For TIs, due to the Zeeman field, each LL except the two zeroth LLs splits into two sublevels with opposite spin states, while the LL−0 and LL+0 are spin-polarized and have spin-up and -down state, respectively (3, 29). The energy of the sublevel has the form (40):
| [4] |
where is equal to +1 for spin-up and –1 for spin-down and is the effective Landé g factor of LLN. The spin-orbit coupling (SOC) in ZrTe5 mixes the spin states of the two sublevels, so two extra optical transitions between the sublevels with different spin indices become possible. The inter- and intra-LL transition energies including the Zeeman effect can be written as (40):
| [5] |
| [6] |
where and correspond to the spin states of the two sublevels, respectively.
Fig. 3.
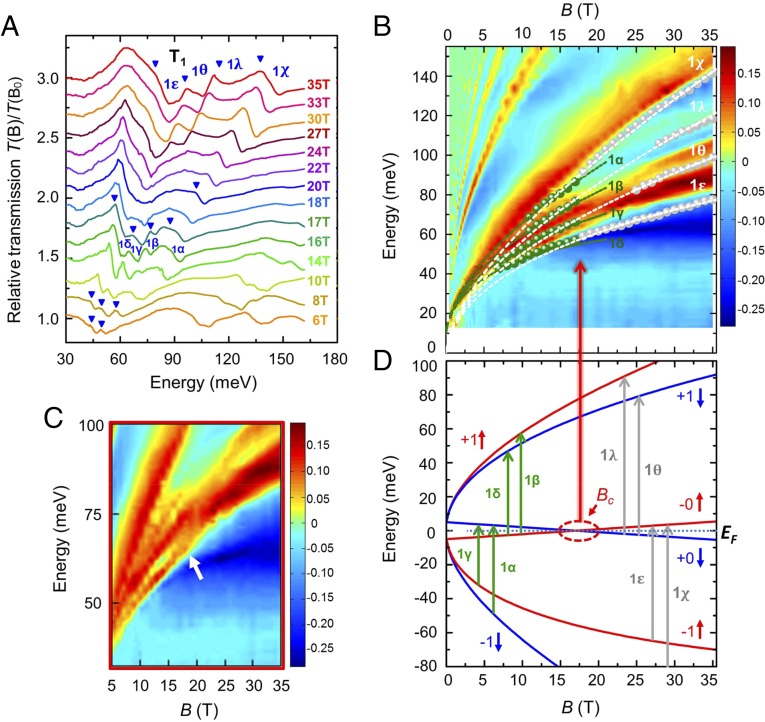
Crossing of the two zeroth LLs of ZrTe5. (A) Split T1 transitions in the T(B)/T(B0) spectra at B 6 T. The energies of the split T1 transitions are defined by the onsets of the dip features indicated by the blue triangles. Around 16 T, four modes are present. Four modes reemerge around 27 T. (B) Color scale map of the –ln[T(B)/T(B0)] spectra as a function of magnetic field and energy. (C) Magnified view of a region in B to better present the cusplike feature that is indicated by a white arrow around 18 T. The measured T1 (green dots) and T1* (gray dots) energies are plotted as a function of magnetic field in B. Here, the green and gray dots in B can be extracted from the lower-energy edges (i.e., the onsets) of the peak-feature traces in the color intensity plots (i.e., B and C) of the –ln[T(B)/T(B0)] spectra. These dots in B have the intensities of the color scale, respectively: 0.025 for 1, 1, 1, and 1, –0.025 for 1, 1, and 1 and –0.075 for 1. The theoretical T1 and T1* energies, based on Eqs. 5 and 6 with the g factors: geff(LL−1) = 31.1, geff(LL+1) = 9.7, and geff(LL+0) = geff(LL−0) = 11.1, the bandgap = 10 meV, the Fermi velocities 4.76 105 m/s, and 4.63 105 m/s, are shown by the green and gray dashed curves, respectively. (D) Schematic of the split T1 (green arrows) and T1* (gray arrows) transitions. The LL spectrum is produced with the above values of the g factors, the bandgap and the Fermi velocity . The two zeroth LLs cross at a critical magnetic field Bc ∼ 17 T. The chemical potential is roughly at zero energy when the magnetic field is high enough. At B > Bc, the interband LL transitions (1, 1, 1, and 1) are gradually replaced by the intraband LL transitions (1, 1, 1, and 1), which causes the cusplike feature shown in C.
Fig. 3B displays the false-color map of the –ln[T(B)/T(B0)] spectra of the ZrTe5 flake. Interestingly, a cusplike feature around 18 T, which is indicated by a white arrow, can be observed in Fig. 3C (i.e., the magnified image of a region in Fig. 3B). To quantitatively investigate the physical meaning of this cusplike feature, we plot the energies of the four split T1 transitions [i.e., 1, 1, 1, and 1 (green dots)] around 16 T in Fig. 3B, which are defined by the onsets of the absorption features due to the Zeeman splitting (see figure 3 of the Supplemental Material of ref. 40 and Supporting Information). As displayed by the green dashed lines in Fig. 3B, fitting the energy traces of the inter-LL transitions, 1, 1, 1, and 1, based on Eq. 5 with the obtained values of the Fermi velocity and the bandgap ∆ yields the g factors of the two zeroth LLs and LL±1: geff(LL+0) = geff(LL−0) ∼ 11.1, geff(LL−1) ∼ 31.1 and geff(LL+1) ∼ 9.7 [or geff(LL+1) ∼ 31.1 and geff(LL−1) ∼ 9.7] (Supporting Information).
It is known that as a hallmark of TIs, the band inversion causes the exchange of the characteristics between the valence- and conduction-band extrema (2, 6, 28), so as shown in Fig. 1A and 3D, the LL−0 and LL+0, which come from the inverted band extrema, have reversed spin states and cross at a critical magnetic field (3, 29). According to Eq. 4 with the above values of geff(LL±0) and ∆, we estimated the critical magnetic field Bc ∼ 17 T. In Fig. 2 A and D, the disappearance of the intra-LL transition T1* around B ∼ 2.5 T indicates that LL+0 (or LL−0) becomes fully depleted (or occupied) with increasing magnetic field and that at B > 2.5 T, the chemical potential of ZrTe5 can be considered to be located at zero energy. In this case, the two zeroth LLs intersect with the chemical potential at the same magnetic field Bc. More importantly, this intersection means at B > Bc ∼ 17 T, LL−0 and LL+0 becomes empty and occupied, respectively, which leads to the gradual replacement of the inter-LL transitions T1, 1, 1, 1, and 1, by the intra-LL transitions T1*, 1, 1, 1, and 1, explained in Fig. 3D. Furthermore, in Fig. 3B, the energy traces of the four split transitions (gray dots) observed at B > 17 T are shown to follow the white theoretical curves for the intra-LL transitions T1*, which are based on Eq. 6. Therefore, the four split transitions observed at B 17 T in Fig. 3B can be assigned as the intra-LL transitions T1*, 1, 1, 1, and 1. Because the energy traces of the split intra-LL transitions T1* deviate markedly from those of the inter-LL transitions T1, the reemergence of the T1* transitions at B 17 T causes the cusplike feature, which provides experimental evidence for the bulk-band inversion in the ZrTe5 flake.
In summary, using magnetoinfrared spectroscopy, we have investigated the Landau level spectrum of the multilayer ZrTe5 flake. The magnetic-field dependence of the LL transition energies here, together with the photon-energy dependence of the absorption coefficient at zero field, quantitatively demonstrates 3D massive Dirac fermions with nearly linear dispersions in the ZrTe5 flake. Due to the Zeeman splitting of the LLs, the energy splitting of the LL transitions was observed at B ≥ 6 T. Interestingly, the intra-LL transitions T1* reemerge at B > 17 T. We propose that the reemergence of the T1* transitions results from the band-inversion-induced crossing of the two zeroth LLs, LL+0 and LL−0. Our results make ZrTe5 flakes good contenders for 3D TIs. Moreover, due to the 3D massive Dirac-like dispersions and the high bulk-carrier mobility [∼ 33,000 cm2/(V ⋅ s)], the ZrTe5 flake can also be viewed as a 3D analog of gapped graphene, which enables us to deeply investigate exotic quantum phenomena.
Materials and Methods
Sample Preparation and Characterizations.
Bulk single crystals of ZrTe5 were grown by Te flux method. The elemental Zr and Te with high purity were sealed in an evacuated double-walled quartz ampule. The raw materials were heated at 900 °C and kept for 72 h. Then they were cooled slowly down to 445 °C and heated rapidly up to 505 °C. The thermal–cooling cycling between 445 and 505 °C lasts for 21 d to remelt the small size crystals. The multilayer ZrTe5 flake (ac plane) for magnetotransmission measurements were fabricated by mechanical exfoliation, and deposited onto double-side-polished SiO2/Si substrates with 300 nm SiO2. The flake thickness ∼180 nm and the chemical composition were characterized by atomic force microscopy (AFM) and energy dispersion spectroscopy (EDS), respectively (Supporting Information).
Infrared Transmission Measurements.
The transmission spectra were measured at about 4.5 K in a resistive magnet in the Faraday geometry with magnetic field applied in parallel to the wave vector of incident light and the crystal b axis. Nonpolarized IR light (provided and analyzed by a Fourier transform spectrometer) was delivered to the sample using a copper light pipe. A composite Si bolometer was placed directly below the sample to detect the transmitted light. The diameter of IR focus on the sample is 0.5–1 mm. Owing to the mismatch between the size of the IR focus and the ZrTe5 flake, an aluminum aperture was placed around the sample. The transmission spectra are shown at energies above 10 meV, corresponding to wavelengths shorter than 124 µm. The wavelength of infrared light here is smaller than the size of the measured sample, and thus the optical constants can be used for a macroscopic description of the data.
Basic Characteristics of the ZrTe5 Sample
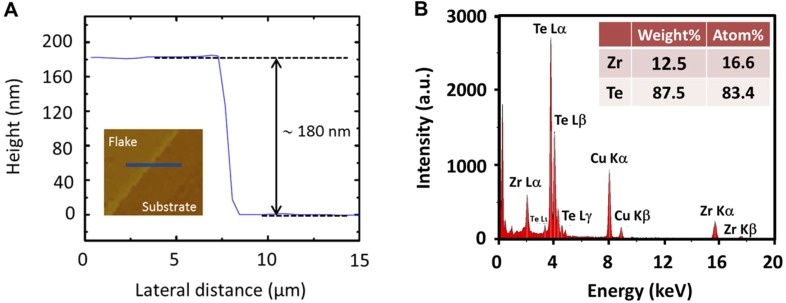
We show the thickness of the ZrTe5 flake characterized by atomic force microscopy and the energy dispersion X-ray spectra of the ZrTe5 flake in Fig. S1. The multilayer flake studied in the main text has the thickness d ∼ 180 nm. For our sample, the atom ratio, Zr: Te ∼ 1: 5.
Fig. S1.
Basic characteristics of the multilayer ZrTe5 flake. (A) Thickness of the ZrTe5 flake characterized by AFM. The multilayer flake studied in the main text has the thickness d ∼ 180 nm. (Inset) An AFM image of the investigated flake. The AFM scan was performed along the blue line in the image. (B) Energy dispersive X-ray spectra of the ZrTe5 flake. The atom ratio, Zr:Te ∼ 1:5.
Bandgap and Effective Fermi Velocity Obtained by Least Squares Fit
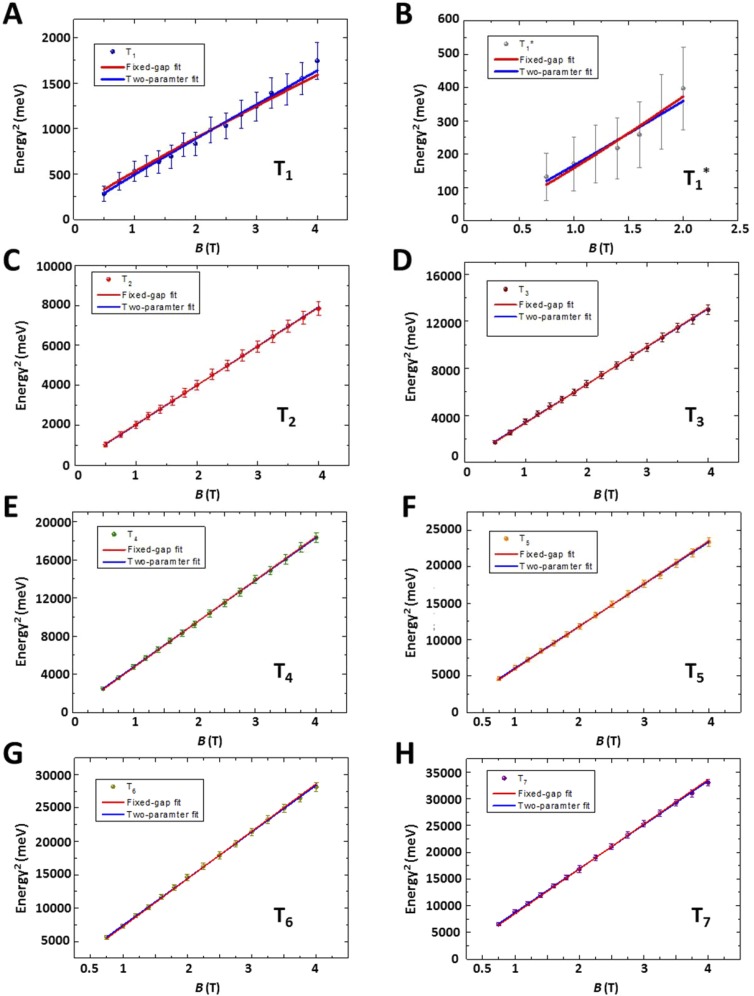
Using the method of least squares fit, we fit the measured Landau level transition energies of the ZrTe5 flake present in Fig. 2 B and C, based on Eqs. 2 and 3 in the main text. The two parameters, bandgap ∆ and the effective Fermi velocity , are assumed to be field independent. As shown in Fig. S2A, the fit to the T1 transition data with ∆ and as free parameters deduces a gap ∆ ∼ 10 ± 2 meV and an effective Fermi velocity ≈ (4.76 ± 0.01) × 105 m/s. For the other transitions, T2, T3, T4, T5, T6, and T7, we fit the data using two approaches (i): setting both ∆ and as free parameters, and (ii) fixing the gap value ∆ = 10 meV and allowing to be a free parameter. As shown in Fig. S2 C–H, for T2, T3, T4, T5, T6, and T7, these two approaches produce the similar fits within the error bars of the data and the similar values of the sum of square residuals , which are the value differences between the measured data and the fitting curve. Therefore, the fitting results, which were deduced from the above two methods, indicate that the T2, T3, T4, T5, T6, and T7 transition energies at low fields (B 4 T) have a consistent gap ∆ ∼ 10 ± 2 meV, which is similar to the gap value deduced from the T1 transition. From the gap value ∆ ∼ 10 ± 2 meV, we can obtain comparable Fermi velocities of the T2, T3, T4, T5, T6, and T7 transitions, ranging from (4.95 ± 0.04) × 105 m/s to (5.04 ± 0.04) × 105 m/s, as shown in Table S1.
Fig. S2.
Least squares fit for the inter- and intra-LL transitions (Tn and T1*). Squares of T1 (A), T1*(B) and Tn (C–H) energies are plotted as a function of magnetic field. Symbols: experimental data. Blue curve: best fit from the first approach. Red curve: best fit from the second approach. For Tn (7 n 2), ∼ ∼ 0.999. For T1, = 0.988 and ∼ 0.993. For T1*, ∼ ∼ 0.940.
Table S1.
Effective Fermi velocities of different LL transitions obtained by the two methods
| LL transition | Fermi velocity (method 1) (m/s) | Fermi velocity (method 2) (m/s) |
| T2 | 5.06 105 | 5.04 105 |
| T3 | 4.97 105 | 5.00 105 |
| T4 | 4.97 105 | 5.00 105 |
| T5 | 4.94 105 | 4.98 105 |
| T6 | 4.92 105 | 4.97 105 |
| T7 | 4.90 105 | 4.95 105 |
| T1* | 4.07 105 | 4.63 105 |
Method 1: both ∆ and are free parameters. Method 2: the gap value is fixed, ∆ ∼ 10 ± 2 meV and is a free parameter.
When and are field independent, the least squares fit for the T1 transition based on Eq. 2 in the main text yields , where and correspond to the sum of squared residuals in the approaches (i) and (ii), respectively. As displayed in Fig. S2A, the first approach can describe the T1 transition [with 7 ± 1 meV and (5.18 ± 0.01) × 105 m/s] better than the second approach with ∆ = 10 meV. Given that all of the bandgap extracted from the LL transitions correspond to the zero-field gap of the ZrTe5 flake, we assume the same gap value of 10 ± 2 meV for the T1 transition and attribute the deviations of the T1 transition from the behaviors described by Eq. 2 to an effective Fermi velocity . Therefore, from the second least squares fit approach, we obtained the effective Fermi velocity for the T1 transition, (4.76 ± 0.01) × 105 m/s, which is smaller than the fitted values of (7 n 2).
For T1*, the first approach for fitting deduces the bandgap 4 ± 1 meV and the Fermi velocity (4.07 ± 0.09) × 105 m/s, and the second approach with fixed ∆ =10 meV has the Fermi velocity (4.63 ± 0.09) × 105 m/s. A smaller gap value was obtained from the first method, which is consistent with the case in T1, but these two approaches have similar values of the sum of square residuals : ≈ . Because the bandgap extracted from T1* corresponds to the zero-field gap and should be the same as those from the other LL transitions, we also attribute the deviations of the T1* transition from the behaviors described by Eq. 3 to an effective Fermi velocity. Thus, we obtained the effective Fermi velocity for the T1* transition (4.63 ± 0.09) × 105 m/s.
Assigning T1* to the Intra-LL transition from LL+0 (or LL−1) to LL+1 (or LL−0)
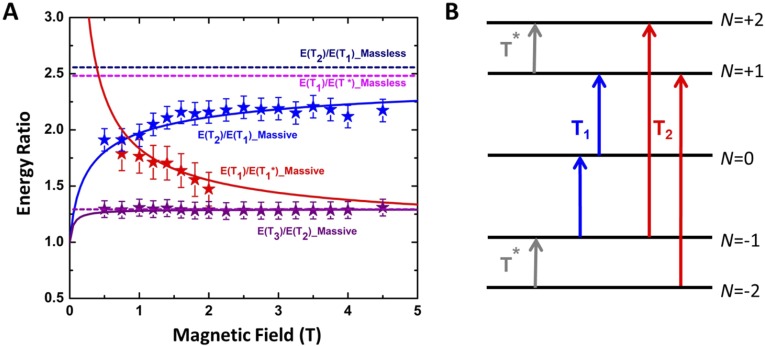
To identify the nature of the T1* feature, we plot the energy ratios between T1 and T1* for the ZrTe5 flake in Fig. S3A. If there is no bandgap here, the T1* feature, which locates at lower energies than the T1 feature, should correspond to the intra-LL transition T* from LL+1 (or LL−2) to LL+2 (or LL−1), as illustrated in Fig. S3B. In this case, according to Eqs. 2 and 3 in the main text without a bandgap (namely, massless Dirac fermions), the energy ratio between the inter-LL transitions from LL0 to LL+1 (or from LL−1 to LL0) and the intra-LL transition T* should be ∼2.415, as displayed by the magenta dashed line in Fig. S3A. However, the energy ratios between the measured T1 and T1* features, which are represented by the red stars, are much lower than 2.415. Instead, the red stars in Fig. S3A can be fitted by the red solid line corresponding to the energy ratio between the inter-LL transition from LL−0 to LL+1 (or from LL−1 to LL+0) and the intra-LL transition from LL+0 to LL+1 (or from LL−1 to LL−0), both of which are illustrated in Fig. 2E of the main text. Thus, the consistence between the red stars and the red solid line produced with a bandgap of 10 meV indicates that the observed T1* feature originates from the intra-LL transition from LL+0 to LL+1 (or from LL−1 to LL−0).
Fig. S3.
Energy ratios between different LL transitions for the ZrTe5 flake. (A) Blue stars: the energy ratio between the measured features T2 and T1. Blue solid line: theoretical result of ET2/ ET1 based on Eq. 2 of the main text with a bandgap of 10 meV. Red stars: the energy ratio between the measured features T1 and T1*. Red solid line: theoretical result of ET1/ ET1* based on Eqs. 2 and 3 of the main text with a bandgap of 10 meV. Purple star: the energy ratio between the measured features T3 and T2. Purple solid line: theoretical result of ET3/ ET2 based on Eq. 2 of the main text with a bandgap of 10 meV. Navy dashed line: theoretical result of ET2/ ET1 based on Eq. 2 of the main text without a bandgap. Magenta dashed line: theoretical energy ratio between the inter-LL transition from LL0 to LL+1 (or from LL−1 to LL0) and the intra-LL transition T* from LL+1 to LL+2 (or from LL−2 to LL−1) based on Eqs. 2 and 3 of the main text without a bandgap. Purple dashed line: theoretical result of ET3/ ET2 based on Eq. 2 of the main text without a bandgap. (B) Schematic of the assumed LL transitions without a bandgap.
For the T2 and T1 features, if there is no bandgap, their theoretical energy ratio should correspond to the navy dashed line in Fig. S3A, which is produced by Eq. 2 of the main text. Definitely, this theoretical dashed line is much higher than the energy ratio between the measured T2 and T1 features, as represented by the blue stars. Instead, the blue stars can be fitted by the blue solid line based on Eq. 2 of the main text with a bandgap of 10 meV. So, the above two energy ratios between the observed LL transitions again reveal the existence of a bandgap in the ZrTe5 flake.
Because the bandgap is comparable to the energies of T1* and T1 at magnetic fields B 4.5 T, the above two energy ratios between the observed LL transitions have distinctly smaller values than those obtained from the Eqs. 2 and 3 of the main text without a bandgap (namely, for massless Dirac fermions). However, if the bandgap is much smaller than the energies of the LL transitions, such as T2 and T3, it will be difficult to distinguish the difference in the energy ratios between the high-energy LL transitions for massive and massless Dirac fermions at high magnetic fields, which has been revealed by the purple stars, and the purple dashed and the solid lines for the energy ratio between T3 and T2.
Estimation of the Fermi Energy EF from the Landau Level Transition
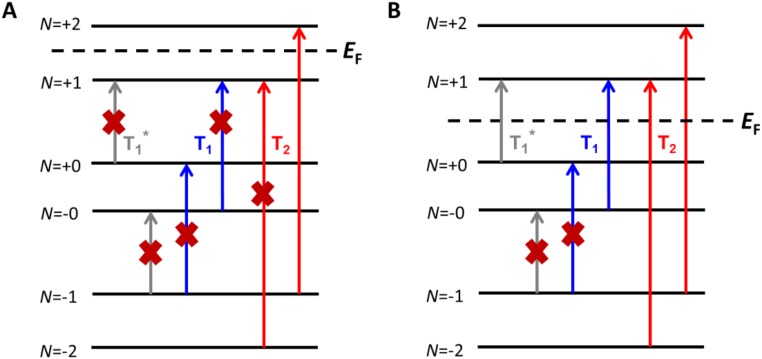
The Fermi energy in the ZrTe5 flake can be estimated from the magnetotransmission data. According to Pauli’s exclusion principle, the LL transitions T1 and T1*, LL−0 (or LL−1) LL+1 (or LL+0) and LL−0 (or LL+0) LL−1 (or LL+1), should be blocked if the LL+1 (or LL−1) is fully occupied (or depleted), as the magnetic field decreases below a critical value BT1 (shown in Fig. S4A). Fig. 2 of the main text shows T1 and T1* can still be observed at 0.5 T, indicating BT1 < 0.5 T. Thus, as displayed in Fig. S4B, the Fermi level is between LL+0 and LL+1 (or between LL−1 and LL+0) at B = 0.5 T and correspondingly, the Fermi energy EF is not higher than 15 meV.
Fig. S4.
Schematic of the Landau level transitions at low magnetic fields. (A) LL transitions with EF located between LL+1 and LL+2. Both T1 and T1* are blocked due to Pauli’s exclusion principle. (B) LL transitions with EF located between LL+0 and LL+1. The T1 transition from LL−0 to LL+1 and the T1* transition from LL+0 to LL+1 take place, and the LL transitions, LL−1 LL+0 and LL−1 LL−0, are forbidden.
Calculation of the g Factors of the Landau Levels
According to Eq. 5 of the main text (with = 10 meV and 4.76 105 m/s), we fit the energy traces of the split-T1 transitions (i.e., 1, 1, 1, and 1) and then obtain the following four equations about the g factors of LL±0 and LL±1:
| [S1] |
| [S2] |
| [S3] |
| [S4] |
Solving Eqs. S1–S4, we obtain geff(LL+0) = geff(LL−0) ∼ 11.1, geff(LL−1) ∼ 31.1 and geff(LL+1) ∼ 9.7. In another case with electron and hole LLs reversed, we have geff(LL−1) ∼ 9.7 and geff(LL+1) ∼ 31.1.
Definitions of the Absorption Energies of T1 at Low and High Magnetic Fields
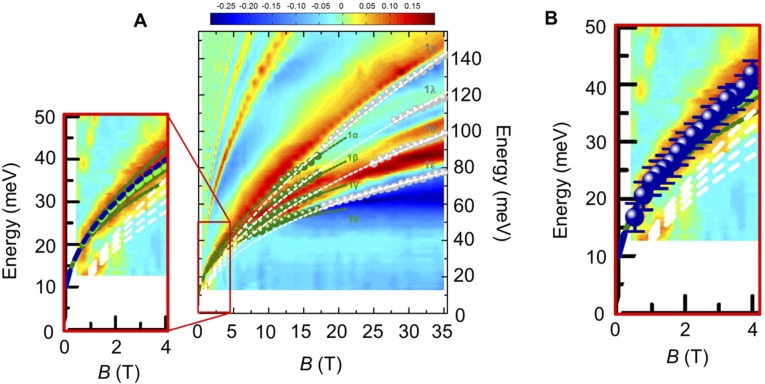
At high magnetic fields B 11 T, in Fig. 3B of the main text, the LL transition T1 is shown to split into four submodes due to the Zeeman splitting of LLs. According to the theoretical calculations displayed in figure 3 of the Supplemental Material of ref. 40, the energies of the split T1 submodes, are defined by the onsets of the absorption features. The definition of the submode energies in the ZrTe5 flake is consistent with that in the material with 3D massless fermions—HgCdTe (see figure 4 of ref. 42). However, when the magnetic field becomes low enough, the split submodes merge and cannot be well distinguished, so at B 4 T, only one absorption feature can be observed. At low magnetic fields B 4 T, the absorption energies of T1 of the ZrTe5 flake are defined by the minimal positions of the dip features, which is a standard method for film systems, such as graphene (44). In this supplementary section, we want to check whether the definition of the T1 energy at magnetic fields B 4 T is valid for the ZrTe5 flake.
The close-up image of Fig. S5A shows a royal blue dashed curve for fitting the low-field minimal positions of T1 in Fig. 2 of the main text (with the Fermi velocity and the bandgap ) and a green dashed curve that represents the average energy of the four olive dashed curves for fitting the energies of the four submodes at high magnetic fields. The energy difference between the royal blue and green dashed curves at B 4 T is at most 2 meV, which is not larger than the energy error bar of the obtained bandgap. We further plotted the minimal positions of T1 (royal blue dots) at B 4 T in Fig. S5B. At B 2 T, the royal blue dots of T1 are shown to match well with the four olive dashed curves for fitting the energies of the four submodes at high magnetic fields and the green dashed curve. Thus, although the Landé g factors in thin ZrTe5 flake are large and the splitting of T1 transition can be well distinguished at high magnetic fields, the consistence between the minimal position of the dip features at B 4 T and the fitting curves for the split T1 modes indicates that defining the minimal position as the absorption energy is a valid method for obtaining the T1 transition energies at low magnetic fields (B 4 T).
Fig. S5.
Comparison of the two ways for defining the T1 transition energy. (A) Split T1 mode energies as a function of B and four olive dashed curves for fitting the inter-LL transitions T1. The close-up image shows a royal blue dashed curve for fitting the low-field minimal position of T1 and a green dashed curve representing the average energy of the four olive dashed lines. (B) Minimal positions of the dip features T1 (royal blue dots) at B 4 T.
Acknowledgments
We thank X. C. Xie, F. Wang, Z. Fang, M. Orlita, M. Potemski, H. M. Weng, L. Wang, C. Fang, and X. Dai for very helpful discussions. We acknowledge support from the Hundred Talents Program of Chinese Academy of Sciences, the National Key Research and Development Program of China (Project 2016YFA0300600), the European Research Council (ERC ARG MOMB Grant 320590), the National Science Foundation of China (Grants 11120101003 and 11327806), and the 973 project of the Ministry of Science and Technology of China (Grant 2012CB821403). A portion of this work was performed in National High Magnetic Field Laboratory, which is supported by National Science Foundation Cooperative Agreement DMR-1157490 and the State of Florida. Work at Brookhaven was supported by the Office of Basic Energy Sciences, Division of Materials Sciences and Engineering, US Department of Energy, through Contract DE-SC00112704.
Footnotes
The authors declare no conflict of interest.
This article is a PNAS Direct Submission.
This article contains supporting information online at www.pnas.org/lookup/suppl/doi:10.1073/pnas.1613110114/-/DCSupplemental.
References
- 1.Kane CL, Mele EJ. Z2 topological order and the quantum spin Hall effect. Phys Rev Lett. 2005;95(14):146802. doi: 10.1103/PhysRevLett.95.146802. [DOI] [PubMed] [Google Scholar]
- 2.Bernevig BA, Hughes TL, Zhang SC. Quantum spin Hall effect and topological phase transition in HgTe quantum wells. Science. 2006;314(5806):1757–1761. doi: 10.1126/science.1133734. [DOI] [PubMed] [Google Scholar]
- 3.König M, et al. Quantum spin hall insulator state in HgTe quantum wells. Science. 2007;318(5851):766–770. doi: 10.1126/science.1148047. [DOI] [PubMed] [Google Scholar]
- 4.Fu L, Kane CL, Mele EJ. Topological insulators in three dimensions. Phys Rev Lett. 2007;98(10):106803. doi: 10.1103/PhysRevLett.98.106803. [DOI] [PubMed] [Google Scholar]
- 5.Moore JE, Balents L. Topological invariants of time-reversal-invariant band structures. Phys Rev B. 2007;75:121306. [Google Scholar]
- 6.Zhang H, et al. Topological insulators in Bi2Se3, Bi2Te3 and Sb2Te3 with a single Dirac cone on the surface. Nat Phys. 2009;5:438–442. [Google Scholar]
- 7.Hsieh D, et al. A topological Dirac insulator in a quantum spin Hall phase. Nature. 2008;452(7190):970–974. doi: 10.1038/nature06843. [DOI] [PubMed] [Google Scholar]
- 8.Chen YL, et al. Experimental realization of a three-dimensional topological insulator, Bi2Te3. Science. 2009;325(5937):178–181. doi: 10.1126/science.1173034. [DOI] [PubMed] [Google Scholar]
- 9.Wan XG, Turner AM, Vishwanath A, Savrasov SY. Topological semimetal and Fermi-arc surface states in the electronic structure of pyrochlore iridates. Phys Rev B. 2011;83:205101. [Google Scholar]
- 10.Young SM, et al. Dirac semimetal in three dimensions. Phys Rev Lett. 2012;108(14):140405. doi: 10.1103/PhysRevLett.108.140405. [DOI] [PubMed] [Google Scholar]
- 11.Wang ZJ, et al. Dirac semimetal and topological phase transitions in A3Bi (A = Na, K, Rb) Phys Rev B. 2012;85:195320. [Google Scholar]
- 12.Wang ZJ, et al. Three-dimensional Dirac semimetal and quantum transport in Cd3As2. Phys Rev B. 2013;88:125427. [Google Scholar]
- 13.Liu ZK, et al. Discovery of a three-dimensional topological Dirac semimetal, Na3Bi. Science. 2014;343(6173):864–867. doi: 10.1126/science.1245085. [DOI] [PubMed] [Google Scholar]
- 14.Neupane M, et al. Observation of a three-dimensional topological Dirac semimetal phase in high-mobility Cd3As2. Nat Commun. 2014;5:3786. doi: 10.1038/ncomms4786. [DOI] [PubMed] [Google Scholar]
- 15.Jeon S, et al. Landau quantization and quasiparticle interference in the three-dimensional Dirac semimetal Cd3As2. Nat Mater. 2014;13(9):851–856. doi: 10.1038/nmat4023. [DOI] [PubMed] [Google Scholar]
- 16.Liang T, et al. Ultrahigh mobility and giant magnetoresistance in the Dirac semimetal Cd3As2. Nat Mater. 2015;14(3):280–284. doi: 10.1038/nmat4143. [DOI] [PubMed] [Google Scholar]
- 17.He LP, et al. Quantum transport evidence for the three-dimensional Dirac semimetal phase in Cd3As2. Phys Rev Lett. 2014;113(24):246402. doi: 10.1103/PhysRevLett.113.246402. [DOI] [PubMed] [Google Scholar]
- 18.Borisenko S, et al. Experimental realization of a three-dimensional Dirac semimetal. Phys Rev Lett. 2014;113(2):027603. doi: 10.1103/PhysRevLett.113.027603. [DOI] [PubMed] [Google Scholar]
- 19.Liu ZK, et al. A stable three-dimensional topological Dirac semimetal Cd3As2. Nat Mater. 2014;13(7):677–681. doi: 10.1038/nmat3990. [DOI] [PubMed] [Google Scholar]
- 20.Burkov AA, Balents L. Weyl semimetal in a topological insulator multilayer. Phys Rev Lett. 2011;107(12):127205. doi: 10.1103/PhysRevLett.107.127205. [DOI] [PubMed] [Google Scholar]
- 21.Weng H, et al. Weyl semimetal phase in non-centrosymmetric transition metal monophosphides. Phys Rev X. 2015;5:011029. [Google Scholar]
- 22.Huang SM, et al. A Weyl Fermion semimetal with surface Fermi arcs in the transition metal monopnictide TaAs class. Nat Commun. 2015;6:7373. doi: 10.1038/ncomms8373. [DOI] [PMC free article] [PubMed] [Google Scholar]
- 23.Xu SY, et al. Discovery of a Weyl fermion semimetal and topological Fermi arcs. Science. 2015;349(6248):613–617. doi: 10.1126/science.aaa9297. [DOI] [PubMed] [Google Scholar]
- 24.Lv BQ, et al. Observation of Weyl nodes in TaAs. Nat Phys. 2015;11:724–727. [Google Scholar]
- 25.Yang LX, et al. Weyl semimetal phase in the non-centrosymmetric compound TaAs. Nat Phys. 2015;11:728–732. [Google Scholar]
- 26.Xu SY, et al. Discovery of a Weyl fermion state with Fermi arcs in niobium arsenide. Nat Phys. 2015;11:748–754. [Google Scholar]
- 27.Shekhar C, et al. Extremely large magnetoresistance and ultrahigh mobility in the topological Weyl semimetal candidate NbP. Nat Phys. 2015;11:645–649. [Google Scholar]
- 28.Liu CX, et al. Model Hamiltonian for topological insulators. Phys Rev B. 2010;82:045122. [Google Scholar]
- 29.Orlita M, et al. Magneto-optics of massive Dirac fermions in bulk Bi2Se3. Phys Rev Lett. 2015;114(18):186401. doi: 10.1103/PhysRevLett.114.186401. [DOI] [PubMed] [Google Scholar]
- 30.Hunt B, et al. Massive Dirac fermions and Hofstadter butterfly in a van der Waals heterostructure. Science. 2013;340(6139):1427–1430. doi: 10.1126/science.1237240. [DOI] [PubMed] [Google Scholar]
- 31.Chen Z-G, et al. Observation of an intrinsic bandgap and Landau level renormalization in graphene/boron-nitride heterostructures. Nat Commun. 2014;5:4461. doi: 10.1038/ncomms5461. [DOI] [PubMed] [Google Scholar]
- 32.Fjellvåg H, Kjekshus A. Structural properties of ZrTe5 and HfTe5 as seen by powder Diffraction. Solid State Commun. 1986;60:91–93. [Google Scholar]
- 33.Weng H, et al. Transition-metal pentatelluride ZrTe5 and HfTe5: A paradigm for large-gap quantum spin Hall insulators. Phys Rev X. 2014;4:011002. [Google Scholar]
- 34.Niu J, et al. 2015. Electrical transport in nano-thick ZrTe5 sheets: From three to two dimensions. arXiv:1511.09315.
- 35.Li X-B, et al. Experimental observation of topological edge states at the surface step edge of the topological insulator ZrTe5. Phys Rev Lett. 2016;116(17):176803. doi: 10.1103/PhysRevLett.116.176803. [DOI] [PubMed] [Google Scholar]
- 36.Wu R, et al. Experimental evidence of large-gap two-dimensional topological insulator on the surface of ZrTe5. Phys Rev X. 2016;6:021017. [Google Scholar]
- 37.Zhang Y, et al. 2016. Electronic evidence of temperature-induced Lifshitz transition and topological nature in ZrTe5. arXiv:1602.03576.
- 38.Li Q, et al. Chiral magnetic effect in ZrTe5. Nat Phys. 2016;12:550–554. [Google Scholar]
- 39.Chen RY, et al. Optical spectroscopy study of the three-dimensional Dirac semimetal ZrTe5. Phys Rev B. 2015;92:075107. [Google Scholar]
- 40.Chen RY, et al. Magnetoinfrared spectroscopy of Landau levels and Zeeman splitting of three-dimensional massless Dirac fermions in ZrTe5. Phys Rev Lett. 2015;115(17):176404. doi: 10.1103/PhysRevLett.115.176404. [DOI] [PubMed] [Google Scholar]
- 41.Zheng G, et al. Transport evidence for the three-dimensional Dirac semimetal phase in ZrTe5. Phys Rev B. 2016;93:115414. doi: 10.1103/PhysRevLett.113.246402. [DOI] [PubMed] [Google Scholar]
- 42.Orlita M, et al. Observation of three-dimensional massless Kane fermions in a zinc-blende crystal. Nat Phys. 2014;10:233–238. [Google Scholar]
- 43.Li ZQ, et al. Dirac charge dynamics in graphene by infrared spectroscopy. Nat Phys. 2008;4:532–535. [Google Scholar]
- 44.Sadowski ML, Martinez G, Potemski M, Berger C, de Heer WA. Landau level spectroscopy of ultrathin graphite layers. Phys Rev Lett. 2006;97(26):266405. doi: 10.1103/PhysRevLett.97.266405. [DOI] [PubMed] [Google Scholar]
- 45.Jiang Z, et al. Infrared spectroscopy of Landau levels of graphene. Phys Rev Lett. 2007;98(19):197403. doi: 10.1103/PhysRevLett.98.197403. [DOI] [PubMed] [Google Scholar]
- 46.Liang T, et al. Evidence for massive bulk Dirac fermions in Pb1-xSnxSe from Nernst and thermopower experiments. Nat Commun. 2013;4:2696. doi: 10.1038/ncomms3696. [DOI] [PubMed] [Google Scholar]
- 47.Issi J-P, et al. Electron and phonon transport in graphene in and out of the bulk. In: Aoki H, Dresselhaus MS, editors. Physics of Graphene. Springer; Switzerland: 2014. pp. 65–112. [Google Scholar]
- 48.Kamm GN, Gillespie DJ, Ehrlich AC, Wieting TJ, Levy F. Fermi surface, effective masses, and Dingle temperatures of ZrTe5 as derived from the Shubnikov-de Haas effect. Phys Rev B Condens Matter. 1985;31(12):7617–7623. doi: 10.1103/physrevb.31.7617. [DOI] [PubMed] [Google Scholar]
- 49.Yuan X, et al. 2016. Observation of quasi-two-dimensional Dirac fermions in ZrTe5. NPG Asia Materials 8:e325.
- 50.Ponomarenko LA, et al. Cloning of Dirac fermions in graphene superlattices. Nature. 2013;497(7451):594–597. doi: 10.1038/nature12187. [DOI] [PubMed] [Google Scholar]
- 51.Dean CR, et al. Hofstadter’s butterfly and the fractal quantum Hall effect in moiré superlattices. Nature. 2013;497(7451):598–602. doi: 10.1038/nature12186. [DOI] [PubMed] [Google Scholar]


