Significance
Cholesterol is important for normal brain function and it is believed that astrocytes produce most brain cholesterol. We have previously shown that diabetes results in decreased brain cholesterol synthesis by a reduction in the transcription factor sterol regulatory element-binding protein 2 (SREBP2). Using a mouse model in which SREBP2 has been knocked out in astrocytes, we show that astrocyte SREBP2 is required for normal brain development and behavior. Furthermore, this results in a shift in metabolism driven by increased brain glucose oxidation. Thus, SREBP2-mediated cholesterol synthesis in astrocytes plays an important role in brain development and function, and altered brain cholesterol synthesis may contribute to the interaction between diabetes and altered brain function.
Keywords: brain cholesterol metabolism, glial cells, SREBP2, metabolic regulation, glucose oxidation
Abstract
Cholesterol is important for normal brain function. The brain synthesizes its own cholesterol, presumably in astrocytes. We have previously shown that diabetes results in decreased brain cholesterol synthesis by a reduction in sterol regulatory element-binding protein 2 (SREBP2)-regulated transcription. Here we show that coculture of control astrocytes with neurons enhances neurite outgrowth, and this is reduced with SREBP2 knockdown astrocytes. In vivo, mice with knockout of SREBP2 in astrocytes have impaired brain development and behavioral and motor defects. These mice also have altered energy balance, altered body composition, and a shift in metabolism toward carbohydrate oxidation driven by increased glucose oxidation by the brain. Thus, SREBP2-mediated cholesterol synthesis in astrocytes plays an important role in brain and neuronal development and function, and altered brain cholesterol synthesis may contribute to the interaction between metabolic diseases, such as diabetes and altered brain function.
The brain is one of the most cholesterol-rich organs in the body, with cholesterol playing an important role in membrane fluidity, vesicle formation, and synaptogenesis (1). Cholesterol levels are tightly controlled by sterol regulatory element-binding protein 2 (SREBP2), the major transcription factor regulating cholesterol synthetic genes (2). In contrast to fatty acids, which are in equilibrium with the rest of the body, nearly all brain cholesterol is synthesized in the brain because cholesterol-carrying lipoproteins, with the exception of some very dense HDL, cannot readily cross the blood–brain barrier (3–5).
When cholesterol is abundant, SREBP2 precursor remains sequestered in the endoplasmic reticulum by SREBP cleavage activating protein (SCAP). As cholesterol is needed, SCAP shuttles SREBP2 to the Golgi for cleavage into a transcriptionally active form that translocates to the nucleus, binds to sterol regulatory elements in DNA, and activates transcription of enzymes of cholesterol synthesis (2). Insulin can regulate SREBP2 expression and activity, in part via two insulin-induced regulatory proteins, Insig1 and Insig2 (6, 7). Furthermore, in insulin-deficient diabetes, there is a decrease in SREBP2 and SCAP in the brain leading to decreased brain cholesterol synthesis (8). We have previously shown that both neurons and glial cells express SREBP2 and the enzymes of cholesterol synthesis, and in both cell types expression of the cholesterol synthesis pathway is stimulated by insulin (7).
Among the subtypes of glia, astrocytes serve the most diverse roles, providing both structural support to neurons and playing a major role in maintaining the blood–brain barrier. In addition, astrocytes provide a variety of metabolic functions, including storage of glycogen and uptake of ions and neurotransmitters from the synaptic cleft (9, 10).
Astrocytes/glial cells have also been suggested to play an important role in brain cholesterol metabolism. When neuronal-like retinal ganglion cells are grown in culture and exposed to glia-conditioned media, there is increased synapse formation (11). Cholesterol is a key mediator of this effect, suggesting that glial cells synthesize and transport cholesterol to neurons via lipoprotein particles. This finding may help explain the strong genetic link between the ε4 isoform of the cholesterol carrier ApoE and Alzheimer disease (AD). Indeed, deletion of LRP1, the major receptor for ApoE on neurons, results in impaired dendritic spine development and neurodegeneration with aging (12). Overactivity of this pathway may also produce adverse effects. Hyperlipidemia in humans has been associated with AD, and whole-body overexpression of SREBP2, which results in loading of cholesterol in brain, worsens pathology in a mouse model of AD (13, 14).
In the present study, we have defined the effects of SREBP2 and cholesterol synthesis in astrocytes using two astrocyte-specific SREBP2 knockout (KO) models. We find that loss of astrocyte-SREBP2 in vitro results in impaired dendrite outgrowth from neurons in coculture. In vivo, loss of SREBP2 in astrocytes alters brain development, resulting in abnormal social, memory, and motor behaviors, as well as multiple metabolic defects, including reduction in adiposity and an altered balance of carbohydrate and lipid oxidation, both at the whole-body level and in the brain.
Results
SREBP2 in Astrocytes Is Required for Normal Neurite Outgrowth.
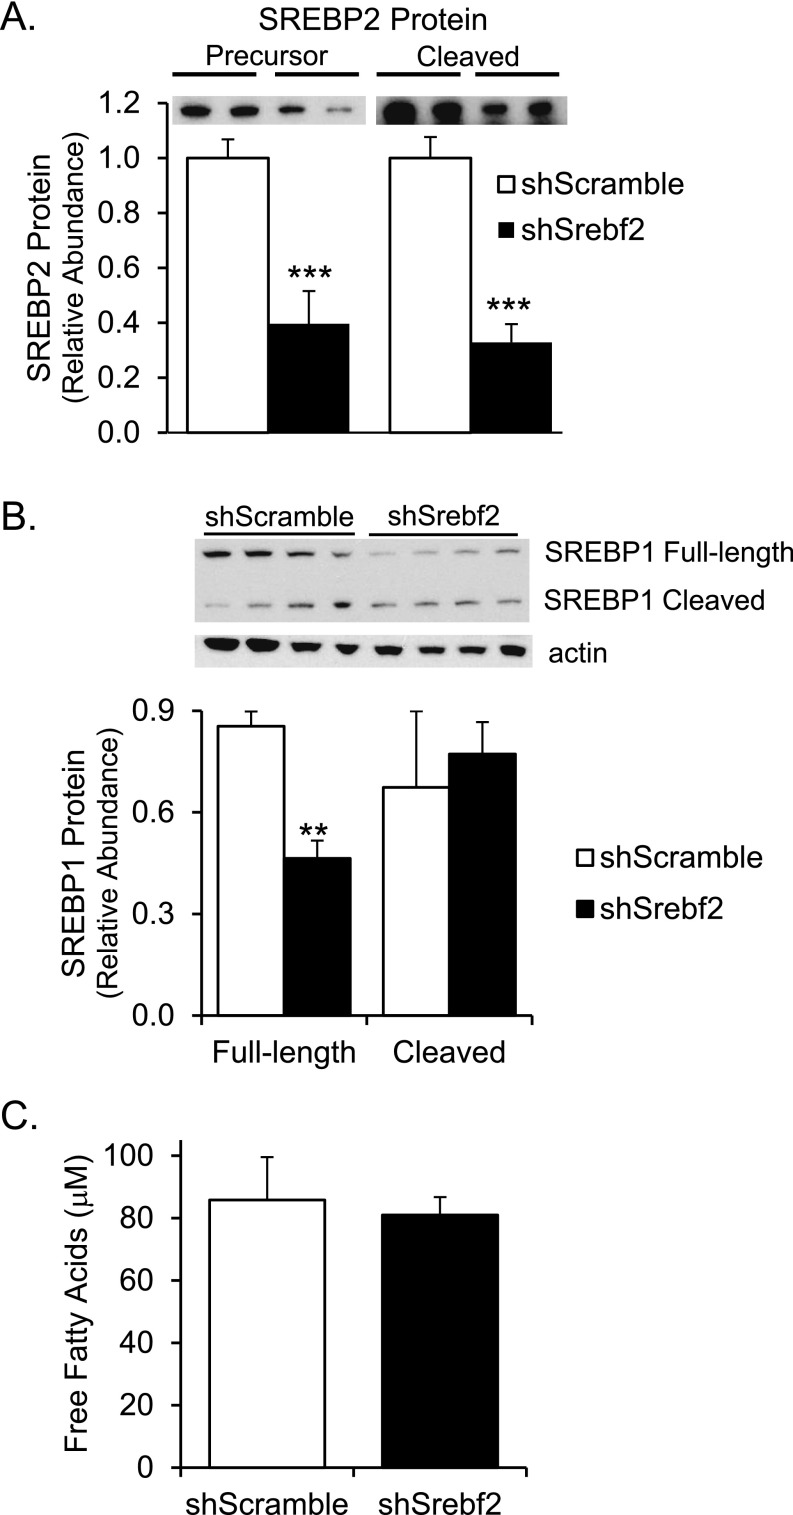
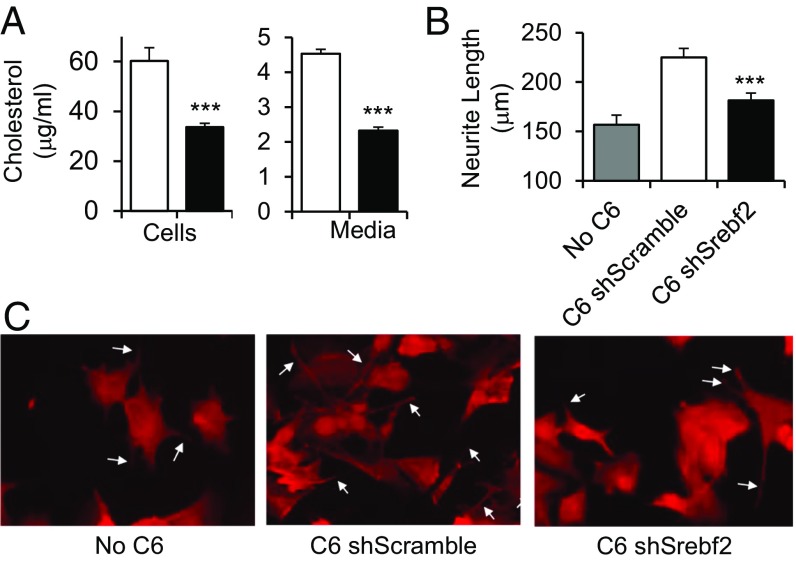
As a first step to determine if SREBP2-mediated astrocyte cholesterol synthesis has an effect on neurons, we cultured GT1-7 mouse hypothalamic cells with C6 rat glioma cells in transwell plates that allow the cells to share nutrients through the media without making physical contact. The glioma cells were stably transfected with lentivirus containing either a scrambled siRNA (shScramble) or siRNA against Srebf2 (shSrebf2), the gene that encodes SREBP2. Knockdown of Srebf2 decreased both the total and cleaved forms of SREBP2 protein by ∼60% (Fig. S1A) and caused an ∼50% reduction in cholesterol content in the C6 glioma cells, as well as in cholesterol secreted into the media (Fig. 1A). Although there was some decrease in full-length SREBP1, the active cleaved form of SREBP1 was unchanged (Fig. S1B), and there was no change in free-fatty acid content in the cells (Fig. S1C). Triglyceride levels were barely detectable, consistent with previous reports (15). When GT1-7 cells were grown in transwells with control C6 shScramble cells above them, there was a 46% increase in average neurite length compared with GT1-7 cells grown alone (Fig. 1 B and C), indicating that glial cells produce a factor that enhances neurite growth. In contrast, when GT1-7 cells were cocultured with Srebf2-knockdown glioma cells, there was only a 15% increase in neurite length, consistent with the important factor being cholesterol.
Fig. S1.
SREBP protein and free-fatty acid levels in Srebf2 knockdown cells. SREBP2 was knocked down in C6 rat glioma cells by stable transfection with a lentiviral delivered shRNA against Srebf2 or a control shScramble, and full-length and cleaved (A) SREBP2 and (B) SREBP1 proteins were measured by Western blot of cell lysates. In addition, free-fatty acids were measured from the cell lysates and conditioned media. Free-fatty acids in the cell lysates were similar between the two groups (C), whereas the media levels were below the lower limit of the assay. n = 3–4 per group. Student’s t test **P < 0.01, ***P < 0.001 compared with control.
Fig. 1.
Loss of SREBP2 from glia inhibits neurite outgrowth. SREBP2 was knocked down in C6 rat glioma cells by stable transfection with a lentiviral delivered shRNA against Srebf2 or a control shScramble. (A) Cholesterol content of cells and cholesterol secreted into serum-free media were measured using the Amplex red assay. n = 3 per group. (B and C) The GT1-7 hypothalamic mouse cell line was grown alone or in coculture using transwells with C6 shScramble or C6 shSrebf2, and neurite length was measured using ImageJ (n = 146, 244 and 246 neurites measured, respectively). Student’s t test ***P < 0.001 compared with C6 shScramble. White arrows indicate examples of neurites. (Magnification: 10×.)
SREBP2 Expression in Astrocytes Is Required for Normal Brain Development.
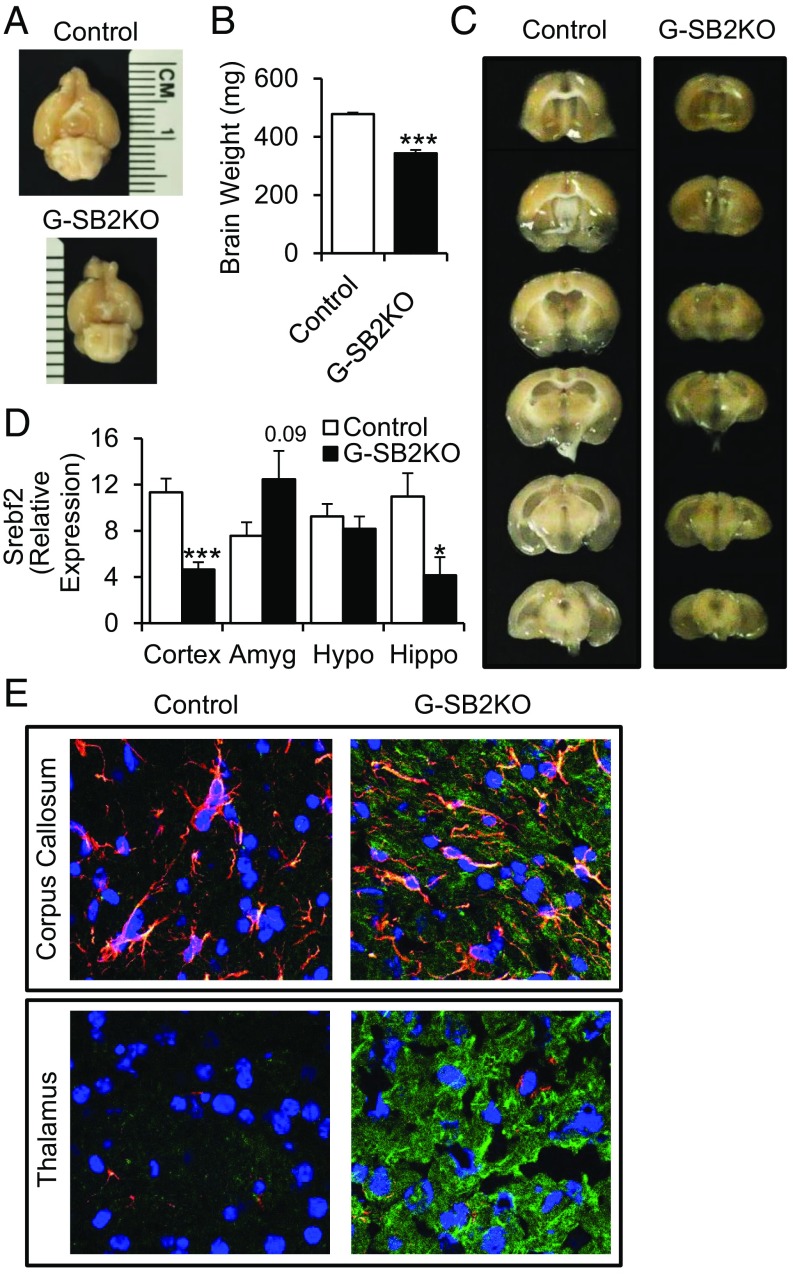
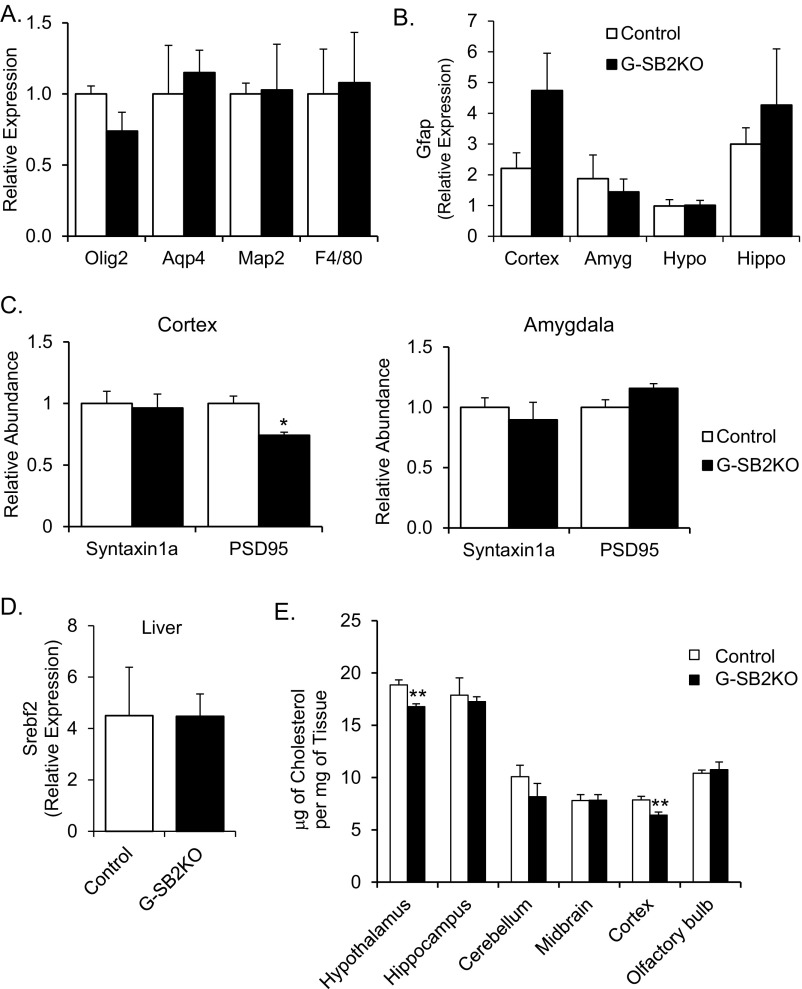
To determine the role of astrocyte cholesterol synthesis in vivo, we created an astrocyte-specific conditional knockout of SREBP2 by breeding mice expressing hGFAP-cre with mice in which the Srebf2 gene contained lox sites on either side of exon 1. Glial fibrillary acidic protein (GFAP) is highly expressed in astrocytes and hGFAP-cre induces recombination beginning at embryonic day (E) 14.5 (16). Homozygous SREBP2 KO pups (hGFAP-cre;Srebf2lox/lox, designated G-SB2KO) were born at normal Mendelian ratios and, in contrast to mice with KO of SCAP from astrocytes or whole brain (8, 17), were healthy and viable for the length of the study (10 mo). Gross examination and dissection revealed microcephaly with a 28% reduction in brain weight (3-mo-old males, 343 ± 11 mg vs. 478 ± 5 mg in controls, P < 0.001) (Fig. 2 A and B), with no change in markers of specific cell types (Fig. S2A). Serial sections through the brain showed that volume loss was most dramatic in the cortex, hippocampus, and white-matter tracks, such as the corpus callosum (Fig. 2C), and in the motor cortex and hippocampus there was a >50% reduction in Srebf2 transcript levels (Fig. 2D), indicating the high efficacy of gene recombination in these areas. This result was accompanied by a trend toward increased activation of astrocytes as measured by Gfap expression in these areas (Fig. S2B). The cortex also showed a small decrease in expression of PSD95, a postsynaptic marker (Fig. S2C). In contrast, the amygdala and hypothalamus, which are comparatively poor in astrocytes, did not have clear reductions in mass and showed no decrease in Srebf2 mRNA or synaptic markers (Fig. 2D and Fig. S2C). There was also no evidence of recombination in the liver, the other major site of Srebf2 expression (Fig. S2D).
Fig. 2.
Homozygous KO of SREBP2 from astrocytes impairs brain development. hGFAP-cre;Srebf2lox/lox mice (designated throughout as G-SB2KO) were compared with littermate controls. (A and B) Brains of G-SB2KO mice weighed less than controls. n = 6 per group. (C) Consecutive 1-mm slices through fresh brain. (D) Expression of Srebf2 measured by quantitative PCR (qPCR) from dissected brain regions, cortex, amygdala (Amyg), hypothalamus (Hypo), and hippocampus (Hippo). n = 5 control, 4 G-SB2KO. (E) Immunostaining for GFAP (red), SREBP2 (green), DAPI (blue), and colocalization (yellow) in corpus callosum and thalamus. Representative 40× confocal images of n = 3 control, 2 G-SB2KO. Student’s t test *P < 0.05, ***P < 0.001 compared with control.
Fig. S2.
G-SB2KO mice show little change in brain cell types, expression of Gfap, liver Srebf2, brain cholesterol content, or synaptic proteins. (A) cDNA from whole brains of control and G-SB2KO mice were assessed for relative expression of cell-type–specific markers, Olig2 (oligodendrocytes), Aqp4 (astrocytes), Map2 (neurons), and F4/80 (microglia). n = 5 per group. (B) Expression of Gfap was determined by qPCR in isolated brain regions: cortex, amygdala (Amyg), hypothalamus (Hypo), and hippocampus (Hippo). n = 6 control, 5 G-SB2KO. (C) The presynaptic marker Syntaxin1a and the postsynaptic marker PSD95 were measured by Western blot of proteins from isolated synaptosomes from the cortex and amygdala. n = 3 animals per group, performed in triplicate. (D) Expression of Srebf2 was measured by qPCR in livers from 3-mo-old male mice. n = 3 per group. (E) Mice were perfused with saline then brains were dissected for the brain regions indicated on the graph. Lipids were extracted from the tissue before measurement. n = 6 animals per group. Student’s t test *P < 0.05, **P < 0.01 compared with control.
Histological sections through the corpus callosum, an astrocyte-rich area, revealed plentiful immunofluorescence staining for GFAP in both control and G-SB2KO mice (Fig. 2E, Upper). In the control mice, staining for SREBP2 showed the highest levels of colocalization with GFAP-stained astrocytes. In G-SB2KO mice there was a decrease in SREBP2 staining in astrocytes, but a large increase in neurons, suggesting that neurons were compensating for the loss of cholesterol synthesis by astrocytes. Even in the thalamus, where GFAP staining of astrocytes was low, there was a massive increase in SREBP2 in the G-SB2KO compared with controls (Fig. 2E, Lower). Total cholesterol content per milligram of tissue was decreased 10–15% in the hypothalamus and cortex, and to a lesser extent in other regions of the brain (Fig. S2E). Serum cholesterol and triglycerides were unaffected (Table S1). These data suggest that in G-SB2KO mice there is a loss in SREBP2/cholesterol synthesis in astrocytes, which is partially compensated for by an increase in cholesterol production by neurons leading to an overall decrease in brain mass with abnormal development, particularly in areas with high astrocyte content.
Table S1.
G-SB2KO mice have reduced serum free fatty acids after refeeding
| Serum, urine, and physical parameters | Control (n) | G-SB2KO (n) | P value |
| Serum | |||
| Insulin (ng/mL) | 0.54 ± 0.16 (3) | 0.55 ± 0.17 (5) | 0.97 |
| Leptin (ng/mL) | 5.9 ± 2.2 (3) | 3.7 ± 0.7 (5) | 0.28 |
| Cholesterol (mg/dL) | 122 ± 4 (3) | 112 ± 6 (5) | 0.29 |
| Triglycerides (mg/dL) | 45 ± 10 (3) | 46 ± 7 (5) | 0.96 |
| Free-fatty acids (mEq/L) | |||
| Fasting | 1.73 ± 0.10 (6) | 1.54 ± 0.08 (6) | 0.16 |
| Refed | 0.83 ± 0.08 (6) | 0.57 ± 0.06 (6) | 0.02 |
| Total T3 (ng/dL) | 57.7 ± 6.6 (6) | 52.9 ± 1.8 (6) | 0.50 |
| Total T4 (μg/dL) | 2.4 ± 0.4 (6) | 2.3 ± 0.1 (6) | 0.80 |
| Corticosterone (ng/mL) | 13.7 ± 1.9 (6) | 13.3 ± 2.0 (6) | 0.88 |
| Urine | |||
| Metanephrines (ng/mL) | 68.2 ± 10.2 (5) | 59.5 ± 5.8 (6) | 0.46 |
| Normetanephrines (ng/mL) | 1680 ± 220 (5) | 1630 ± 200 (6) | 0.87 |
| Physical | |||
| Body temperature (°C) | 36.5 ± 0.3 (8) | 36.4 ± 0.3 (10) | 0.94 |
| Fecal calorie content (calories/gram feces) | 4034 ± 24 (5) | 4043 ± 8 (6) | 0.72 |
| Blood pressure (mmHg) | |||
| Systolic | 107 ± 4 (5) | 106 ± 6 (6) | 1.00 |
| Diastolic | 93 ± 3 (5) | 84 ± 7 (6) | 0.31 |
| Pulse (beats per minute) | 602 ± 15 (5) | 652 ± 32 (6) | 0.22 |
Average ± SEM, n = the number of animals in each group. Insulin, leptin, cholesterol and triglycerides were measured from serum of fasting 3-mo-old male mice. Free-fatty acids were measured from the serum of 10-mo-old female mice after an overnight fast and then again after the same mice were refed. T3, T4, and corticosterone were measured on the same refed mice. Male mice were also used for fecal calorie content, urine metanephrines, and normetanephrines.
Loss of Astrocyte SREBP2 Is Associated with Behavioral Abnormalities.
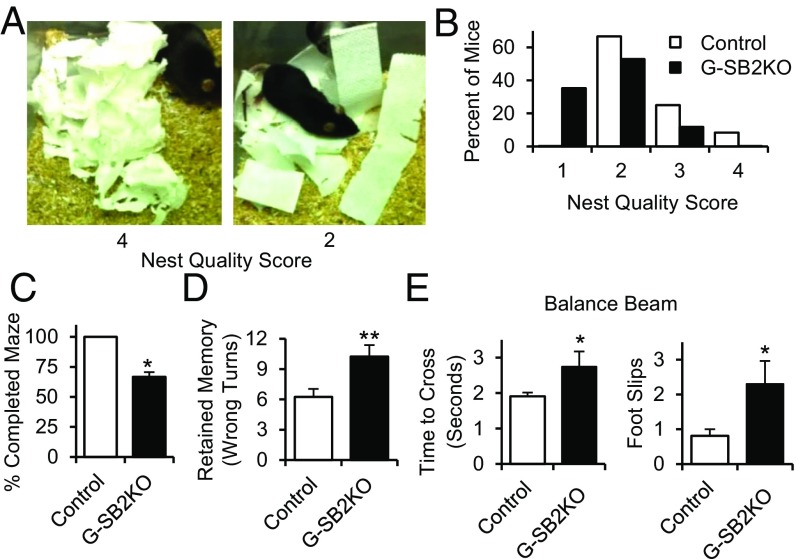
Brain function was assessed using a battery of behavioral tests. Social behavior was assessed by measuring nest-building ability. In this test, individually housed mice were given eight strips of paper towel, and the next day the quality of the paper nest created by the mouse was scored on a scale of 1–4, with 4 being best (Fig. 3A) (18). As shown in Fig. 3B, G-SB2KO mice showed a significant impairment in nest-building quality (P < 0.05).
Fig. 3.
G-SB2KO mice have multiple neurologic defects. (A) Examples of nests, scored on a scale from 1 to 4, showing a nest scoring 4 (Left) and 2 (Right). (B) Distribution of nesting scores, n = 12 control, 17 G-SB2KO, P < 0.05 by Wilcoxon Rank Sum. Eleven control and 12 G-SB2KO mice were trained in a Stone T-maze. (C) Four of the 12 G-SB2KO mice could not be trained to complete the maze. All 11 controls were trainable. P < 0.05 by two-proportion test. (D) One week after completing maze training, mice were retested and the average of three runs is shown. n = 11 control, 8 G-SB2KO. Mice were trained to cross a 12-mm-wide balance beam, then recorded crossing the balance beam two times and the average (E) time to cross and number of foot slips were reported. n = 8 control, 5 G-SB2KO, 9-wk-old females. Student’s t test *P < 0.05, **P < 0.01.
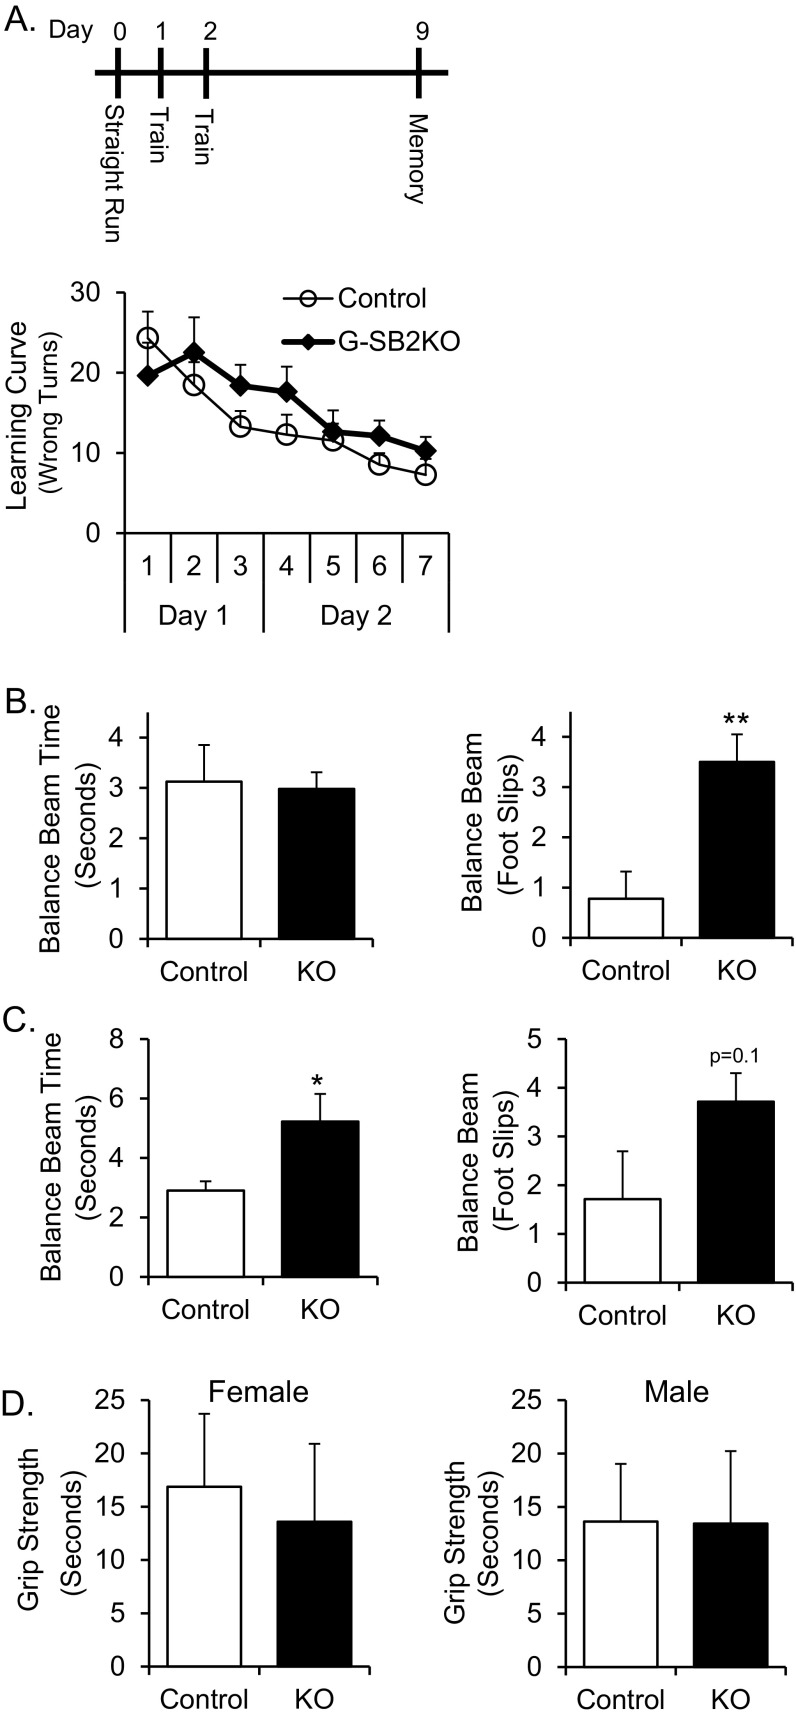
Learning and memory were assessed using a Stone T-maze (19). Mice were placed in the maze that was submerged in 2 cm of water to encourage the mice to complete the maze. Although all of the control mice were able to be trained, one-third of KO mice could not be trained to complete the maze (P < 0.05) (Fig. 3C). Of the mice able to complete the maze, the number of wrong turns for each run of the maze was counted as the mice ran the maze a total of seven times over 2 d. Both groups improved with each training run, with the control mice trending toward better performance than the KOs over the course of the experiment (Fig. S3A). More importantly, when retested 1 wk after the learning trials, the G-SB2KO mice made significantly more mistakes than the controls, indicating a defect in memory retention (10.2 ± 1.1 vs. 6.2 ± 0.8 wrong turns for controls, P < 0.01) (Fig. 3D). A similar trend was seen 1 mo after the original learning trials (13.0 ± 1.8 vs. 8.1 ± 1.6 wrong turns for controls, P = 0.06). Because rotating the maze 180° increased significantly the number of wrong turns made by the control mice from 4.2 ± 1.0–11.2 ± 2.9 (P < 0.05), it was clear that the mice used spatial cues to navigate the maze, implying that this is primarily a test of hippocampal memory.
Fig. S3.
Stone T-maze, balance beam, and grip strength testing. (A) Schematic of testing of mice in Stone T-maze. On day 0, mice are trained to go through a straight run to an elevated home box. On days 2 and 3 the mice are trained to traverse the Stone T-maze to get to an elevated home box. On day 9, mice are retested in the maze to determine ability to remember the maze. Learning curves show the number of wrong turns made by the mice on each run of the maze over the course of training. n = 11 control, 8 G-SB2KO. (B) Mice were trained to cross a 12-mm-wide balance beam. On day 3 mice were recorded crossing the balance beam two times and the average time to cross and number of foot slips per crossing were determined for 9-wk-old male mice (n = 9 control, 8 G-SB2KO) and (C) 35-wk-old female mice (n = 7 per group). (D) Grip strength was measured for the young female and male mice; average of the best two of three trials was reported. Student’s t test *P < 0.05, **P < 0.01.
Motor coordination—that is, the time to cross a 12-mm by 50-cm balance beam—was also significantly increased (2.7 ± 0.4 vs. 1.9 ± 0.1 s, P < 0.05), and KO mice had significantly more foot slips than the controls (2.3 ± 0.7 vs. 0.8 ± 0.2 foot slips, P < 0.05) (Fig. 3E). This result was true for both genders (Fig. S3B) and at multiple ages (Fig. S3C). The impairment in G-SB2KO mice was not because of muscle weakness, as there was no difference between groups in grip strength (Fig. S3D). Taken together, these data demonstrate the requirement for intact SREBP2 in astrocytes for normal social behavior, memory, and coordinated movement.
G-SB2KO Mice Have Altered Body Composition.
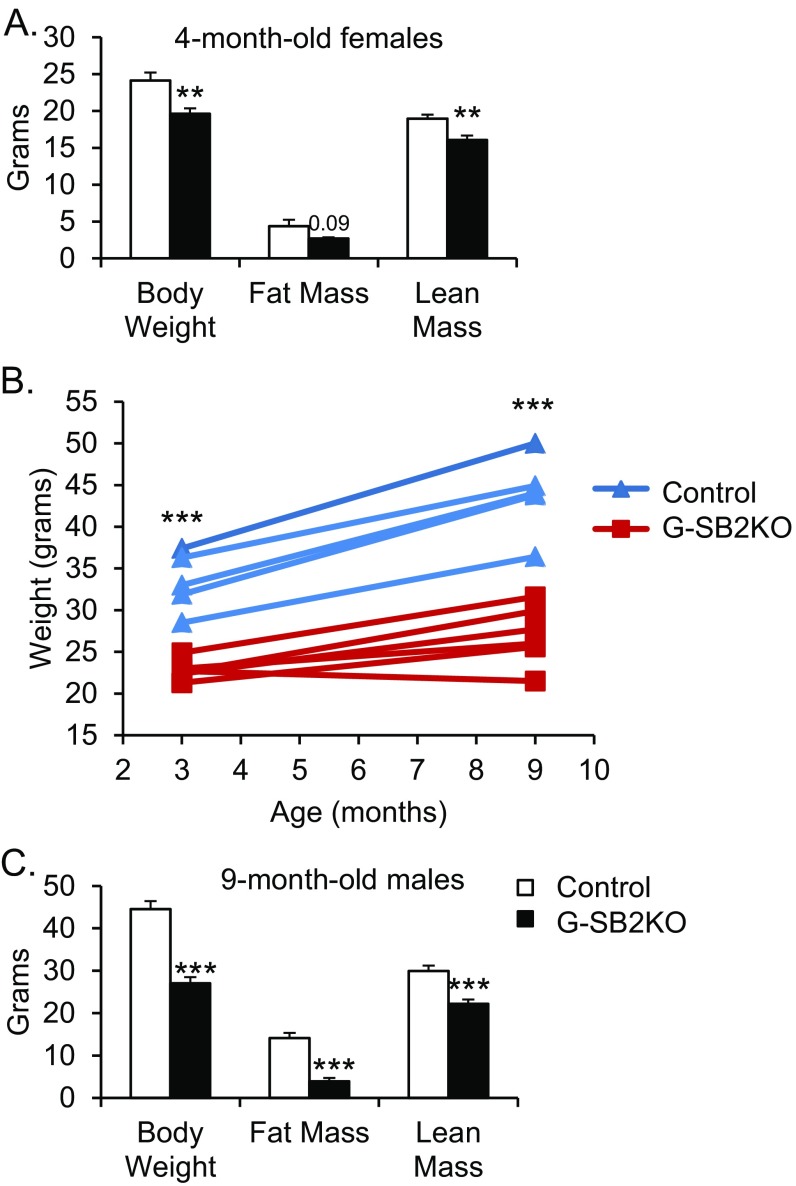
As early as 5 wk of age, male G-SB2KO mice showed lower body weights compared with control littermates (20.0 ± 0.7 vs. 23.7 ± 0.4 g, P = 0.001). The weight difference was also present in females and increased with time, such that by 4 mo of age, female G-SB2KO mice weighed 20% less than controls (19.6 ± 0.7 vs. 24.1 ± 1.1 g, P < 0.01) (Fig. S4A). Dual-energy X-ray absorptiometry (DXA) demonstrated that the difference in weight in the G-SB2KO mice was because of a reduction in both lean mass (16.1 ± 0.6 vs. 19 ± 0.5 g, P < 0.01) and fat mass (2.7 ± 0.2 vs. 4.4 ± 0.9 g, P = 0.09), although the latter did not reach significance (Fig. S4A). Femur length was the same between groups, demonstrating that the mice were not dwarfed (1.36 ± 0.02 vs. 1.35 ± 0.02 cm for controls, P = 0.53).
Fig. S4.
G-SB2KO mice are protected from age-associated weight gain. Mice maintained on a regular chow diet. (A) Body composition of 4-mo-old female mice was determined by DXA scanning (n = 6 per group). (B) A group of male mice were weighed at 3 mo and 9 mo of age. Each line indicates the weight gain for an individual mouse. (C) DXA was then performed on the same mice. n = 5 control, 6 G-SB2KO. Student’s t test **P < 0.01, ***P < 0.001.
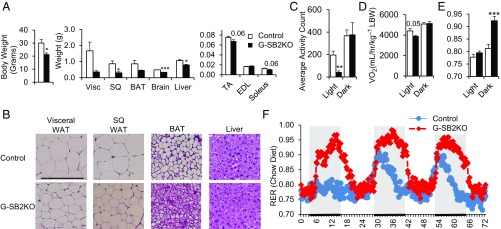
G-SB2KO mice were also protected from weight gain associated with aging. Between 3 and 9 mo of age, male control mice gained 10.4 ± 0.9 g of weight, whereas G-SB2KO mice only gained 4.3 ± 1.3 g (Fig. S4B) (P < 0.01). At 9 mo of age, DXA assessment of the male mice demonstrated a significant 25% reduction in lean mass (22.2 ± 1.0 vs. 29.9 ± 1.3 g in controls, P < 0.001) and an impressive 72% reduction in fat mass (3.9 ± 0.8 vs. 14.1 ± 1.2 g, P < 0.001) (Fig. S4C). This result was again associated with no difference in femur length (1.32 ± 0.04 vs. 1.38 ± 0.02 cm in controls, P = 0.19). Necropsy revealed differences in all fat depots, with a 79% decrease in visceral fat pad weight (0.36 ± 0.09 vs. 1.68 ± 0.54 g, P < 0.05) (Fig. 4A), a 66% decrease in subcutaneous (SQ) fat pad weight (0.30 ± 0.06 vs. 0.87 ± 0.18 g, P = 0.01), and a 48% reduction in interscapular brown fat weight (0.45 ± 0.02 vs. 0.86 ± 0.20 g, P = 0.07). Histological examination revealed that this result was because of smaller size of adipocytes in the white and brown fat pads of G-SB2KO mice. This occurred without any evidence of fat accumulation in the liver (Fig. 4B). Indeed, G-SB2KO mice had significantly lower liver weight than controls (0.79 ± 0.04 vs. 1.07 ± 0.08 g, P = 0.01) (Fig. 4A), as well as a trend toward decreased muscle weight.
Fig. 4.
G-SB2KO mice have altered body composition and metabolism. (A) Ten-month-old females were dissected and tissue weights reported. n = 6 per group. (B) H&E staining of fat pads and livers from 3- to 4-mo-old males. (Scale bar, 200 μm.) BAT, brown adipose tissue; EDL, extensor digitorum longus; TA, tibialis anterior; WAT, white adipose tissue. Four-month-old female mice on chow diet were placed in metabolic cages for 72 h and (C) activity counts (beam breaks per 15-min interval, averaged over the light or dark cycle), (D) VO2, and (E and F) RER were determined. n = 6 per group. Student’s t test *P < 0.05, **P < 0.01, ***P < 0.001.
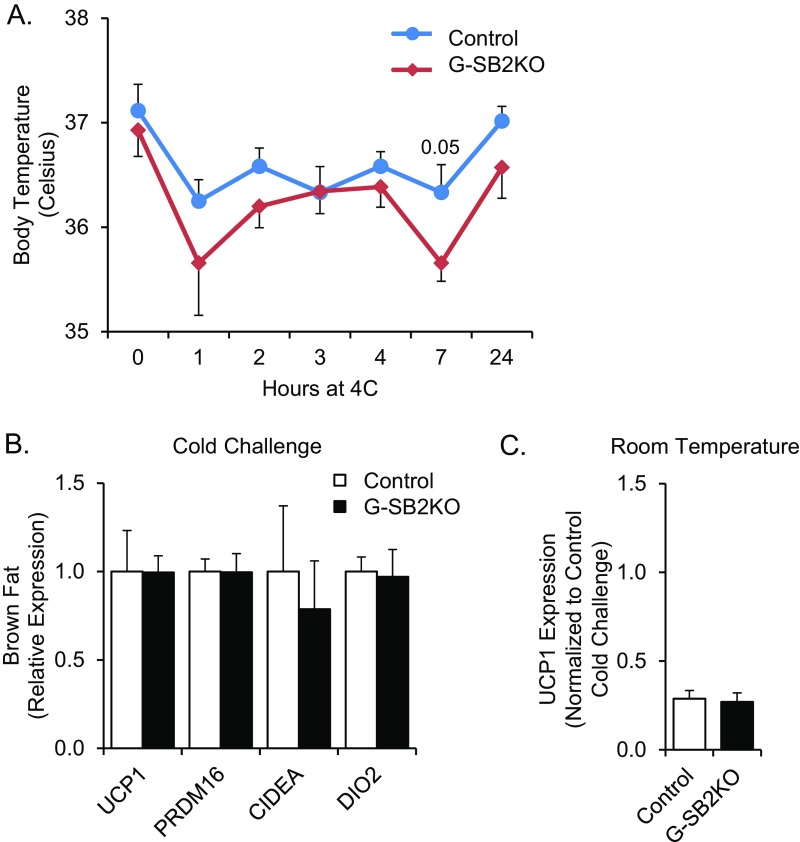
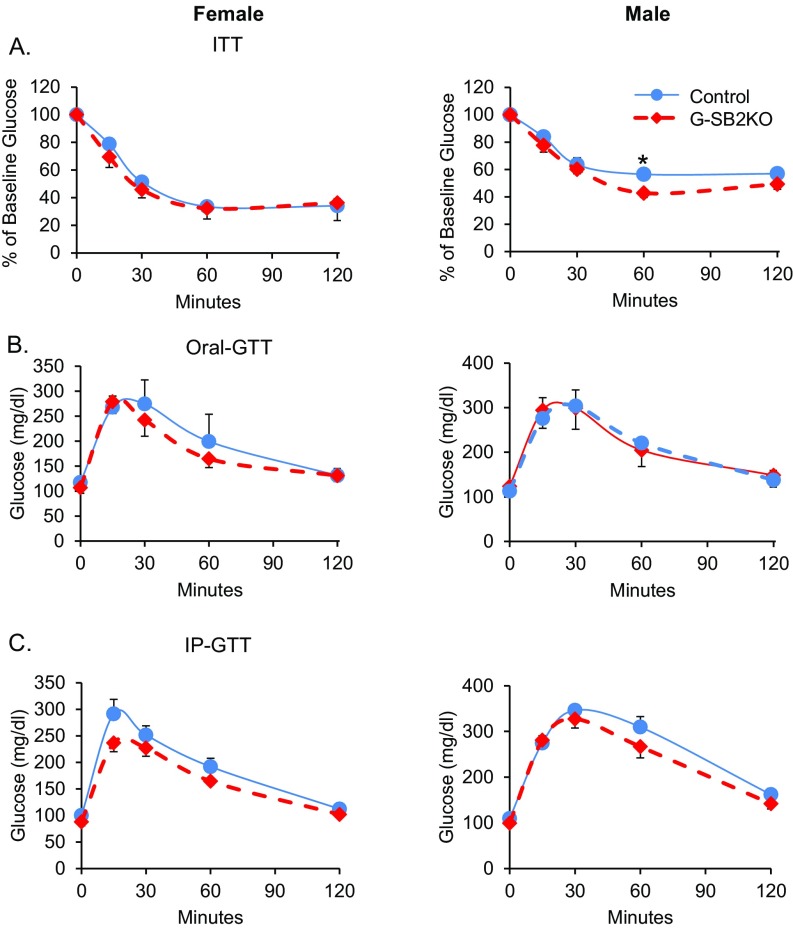
Increased activation of the sympathetic nervous system can result in weight loss. However, there were no differences is blood pressure or pulse rate between the groups and no differences in urine metanephrine or normetanephrines (Table S1). Activation of the sympathetic nervous system also controls thermogenesis from brown fat, which can result in energy expenditure (20). However, when mice were challenged with 4 °C cold exposure for 24 h to activate brown fat, G-SB2KO mice were able to maintain body temperature similar to controls (Fig. S5A). Expression of mRNA for markers of brown fat activation, such as uncoupling protein 1 (Ucp1), PR domain zinc finger protein 16 (Prdm16), cell death-inducing DFFA-like effector A (Cidea), and deiodinase iodothyronine type II (Dio2) were also similar in the interscapular brown fat pads of G-SB2KO and control mice (Fig. S5B), and in both controls and G-SB2KO mice Ucp1 expression in brown fat showed a clear induction with cold challenge (Fig. S5C). In addition, SQ and visceral fat depots from mice housed at room temperature showed no difference in mRNA expression for Ucp1, Prdm16, or Cidea between control and G-SB2KO mice (Table S2). Thus, the smaller fat pads in G-SB2KO mice could not be attributed to brown fat activation or browning of the white fat pads. Serum hormones frequently associated with weight change, including triiodothyronine (T3), thyroxine (T4), leptin, corticosterone, and fasting insulin, and insulin tolerance testing were also equivalent between control and G-SB2KO mice (Fig. S6A and Table S1).
Fig. S5.
Response to cold challenge is similar in control and G-SB2KO mice. Mice were placed in individual cages at 4 °C for 24 h. (A) Rectal body temperature was taken every hour for the first 7 h and then again at 24 h. Mice were removed from the cold just before dissection and interscapular brown fat pads were isolated for mRNA. (B) qPCR was performed on brown fat samples for markers of brown fat activation. Each marker was normalized to control. n = 6 control, 7 G-SB2KO. (C) A separate cohort of mice kept at room temperature was dissected and Ucp1 mRNA from brown fat was measured by qPCR. The samples in C were run on the same qPCR plate as B and Ucp1 expression was normalized to expression in the cold-challenged control mice from B. n = 3 controls, 6 G-SB2KO.
Table S2.
No difference in markers of browning in SQ or visceral fat
| Gene | Tissue | Control (n) | G-SB2KO (n) | P value |
| Ucp1 | SQ | 1.00 ± 0.81 (3) | 1.11 ± 0.34 (6) | 0.88 |
| Visceral | 0.87 ± 0.86 (3) | 0.47 ± 0.20 (5) | 0.58 | |
| Prdm16 | SQ | 1.00 ± 0.24 (3) | 0.81 ± 0.11 (6) | 0.41 |
| Visceral | 0.78 ± 0.56 (3) | 0.20 ± 0.04 (5) | 0.21 | |
| Cidea | SQ | 1.00 ± 0.74 (3) | 0.98 ± 0.27 (6) | 0.97 |
| Visceral | 1.24 ± 0.62 (3) | 0.44 ± 0.19 (5) | 0.17 |
SQ and visceral fat were taken from mice housed at room temperature. Expression of Ucp1, Prdm16, and Cidea were measured by qPCR. For each gene, expression was normalized to control SQ samples.
Fig. S6.
G-SB2KO mice have normal insulin and glucose tolerance. (Left) Female and (Right) male for all experiments. (A) Insulin tolerance tests (ITT) were performed on 3-mo-old mice. (B) Oral-glucose tolerance tests (GTT) were performed on 8-mo-old mice and (C) intraperitoneal (IP)-GTT on 3-mo-old mice. n = 6–8 mice per group. Student’s t test *P < 0.05.
The enteric glia of the gastrointestinal tract have a different cell lineage than brain astrocytes; however, they do express Gfap (21), thus it was important to determine if the G-SB2KO mice had an absorption defect in the gut causing a reduction in body weight. Glucose absorption as determined by oral glucose tolerance tests was the same between control and G-SB2KO mice (Fig. S6B), as were intraperitoneal glucose tolerance tests (Fig. S6C). Fecal calorie content, assessed by bomb calorimetry, also showed no evidence of malabsorption in KO mice (Table S1), and there was no evidence of glucose in the urine of any of the mice.
Respiratory Exchange Ratio Is Dramatically Increased in G-SB2KO Mice.
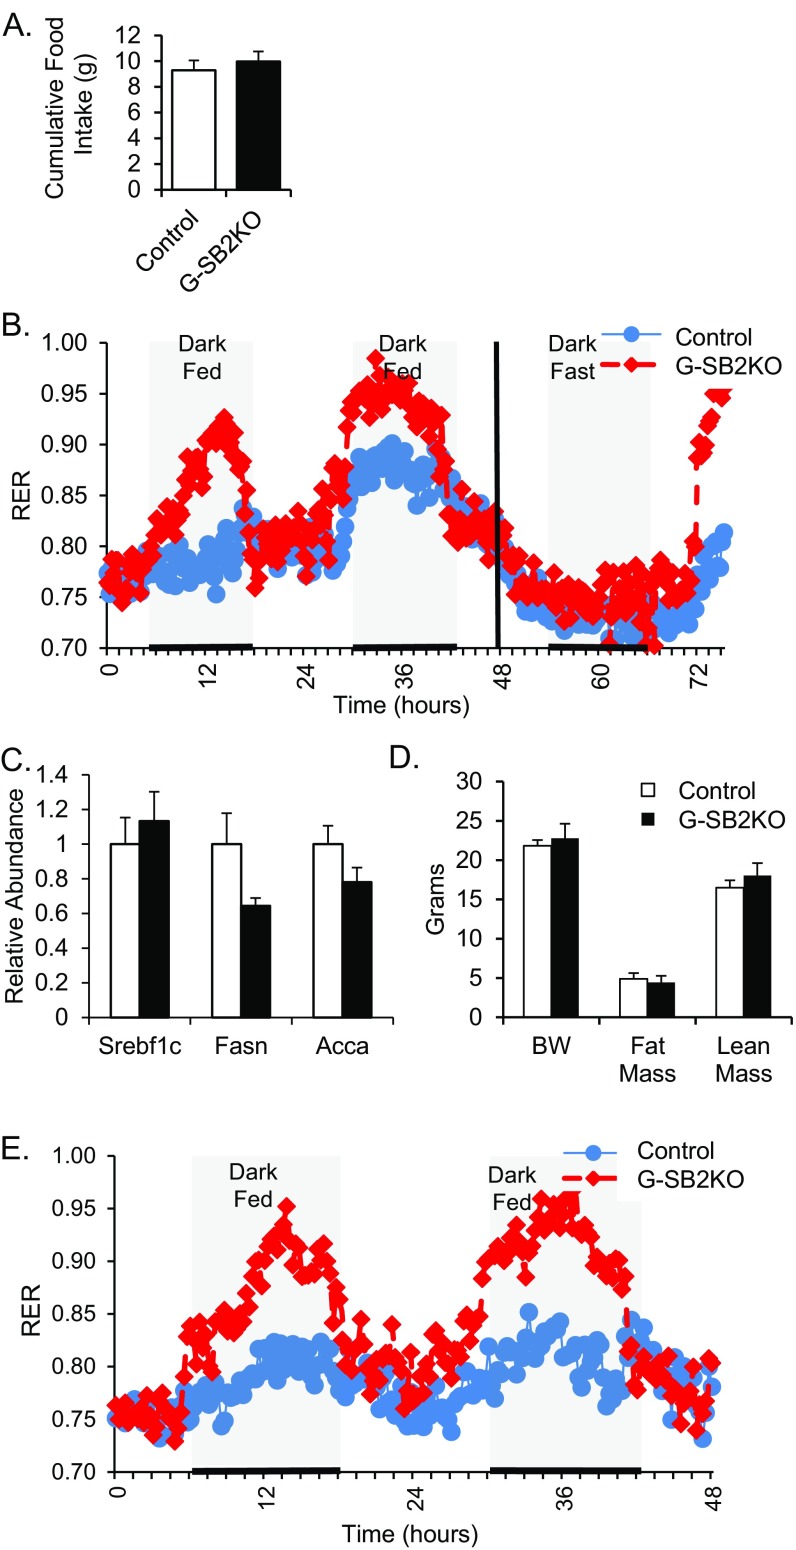
To further assess metabolic differences created by the loss of SREBP2 in astrocytes, 4-mo-old female G-SB2KO mice were subjected to metabolic cage assessment. Although food intake over 72 h was equivalent in G-SB2KO and controls (9.98 ± 0.78 vs. 9.30 ± 0.76 g, P = 0.56) (Fig. S7A), the G-SB2KO mice were less active during the light phase (40 ± 13 vs. 196 ± 35 beam breaks per 15 min, P < 0.01) (Fig. 4C). This resulted in a decrease in VO2 during the same period (3,874 ± 88 vs. 4,406 ± 224 mL⋅h⋅kg−1 lean body weight, P = 0.05) (Fig. 4D). There was no difference in activity or VO2 during the dark phase. The most striking difference in the metabolic cage assessment, however, was a dramatic increase in the respiratory exchange ratio (RER) in the G-SB2KO mice during the dark (feeding) phase of the study, (0.92 ± 0.02 vs. 0.81 ± 0.02, P < 0.001) (Fig. 4 E and F). This occurred with no difference in RER between groups in the light phase, when mice are generally sleeping (0.79 ± 0.01 vs. 0.78 ± 0.01, P = 0.21). This shift in substrate oxidation toward carbohydrates in fed G-SB2KO mice was observed in younger female mice and was confirmed in 9-mo-old male mice as well (Fig. S7B). These results were mirrored by serum-free fatty acids, which were similar in the fasted state between groups, but significantly lower in KO mice after refeeding (Table S1). Of note, refeeding did not increase markers of liver lipogenesis, a potential cause of increased RER (Fig. S7C). The lower free-fatty acids were consistent with the reduced size of the fat pads and liver of G-SB2KO mice. The differences in RER were weight-independent, as evidenced by a similar difference in RER between weight-matched control and G-SB2KO mice (Fig. S7 D and E).
Fig. S7.
Increased RER is independent of weight, gender, and age. (A) Cumulative food intake over 72 h for 4-mo-old females. (B) Nine-month-old males were evaluated in metabolic cages for 48 h with access to chow diet and for 24 h while fasting, followed by a brief period of refeeding, and RER was measured. n = 6 per group. (C) Ten-month-old females were fasted overnight, then refed for 4 h before being killed. Liver mRNA was assessed for expression of Srebp1c, fatty-acid synthase (Fasn), and acetyl-CoA carboxylase α (Acca). A weight matched group of 4-mo-old female mice were evaluated by (D) DXA and then (E) for RER over 48 h in metabolic cages. n = 4 controls, 5 G-SB2KO.
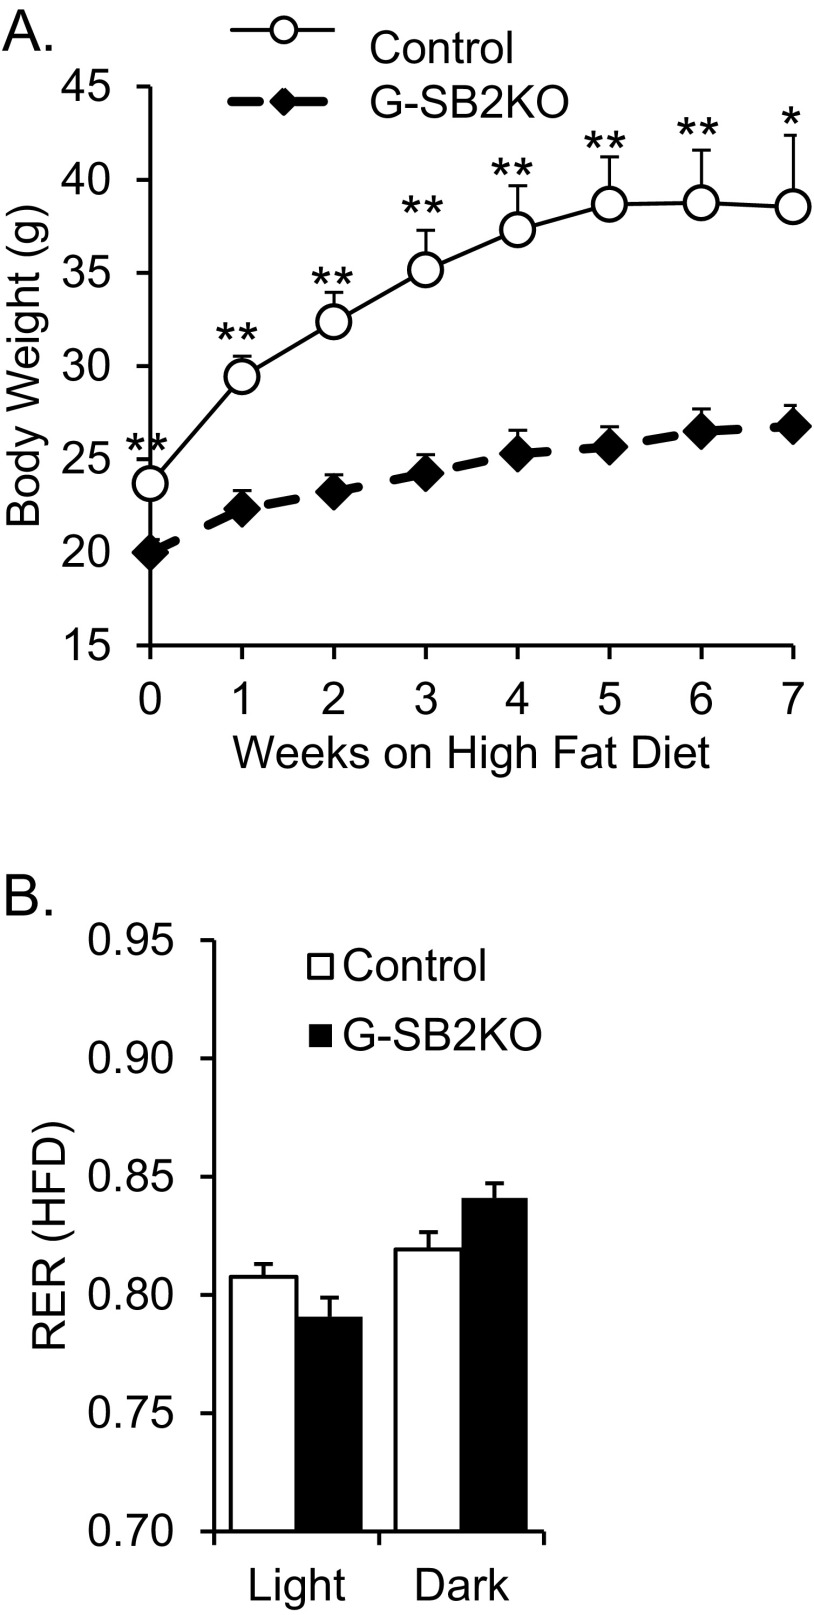
To determine if G-SB2KO mice could properly use a lipid-rich diet, 6-wk-old male G-SB2KO and controls were placed on a high-fat diet. After 7 wk, the G-SB2KO mice only gained 7 g of weight compared with nearly 15 g in the controls (Fig. S8A) (P < 0.01 for weeks 0–6, P = 0.02 for week 7). Metabolic cage assessment of high-fat–fed G-SB2KO mice again showed an increase in RER in the dark phase compared with controls (Fig. S8B), although there was less of a difference on normal chow. Thus, despite their preference to use carbohydrate, G-SB2KO mice retain enough metabolic flexibility to metabolize a primarily fat-based diet.
Fig. S8.
G-SB2KO are protected from high-fat diet. (A) Six-week-old male mice were placed on a high-fat diet for 7 wk and weighed weekly, then were placed in metabolic cages, with access to high fat diet, for 48 h and (B) RER was determined during the light and dark cycles. n = 5 per group. Student’s t test *P < 0.05, **P < 0.01.
Glucose Oxidation in G-SB2KO Tissues.
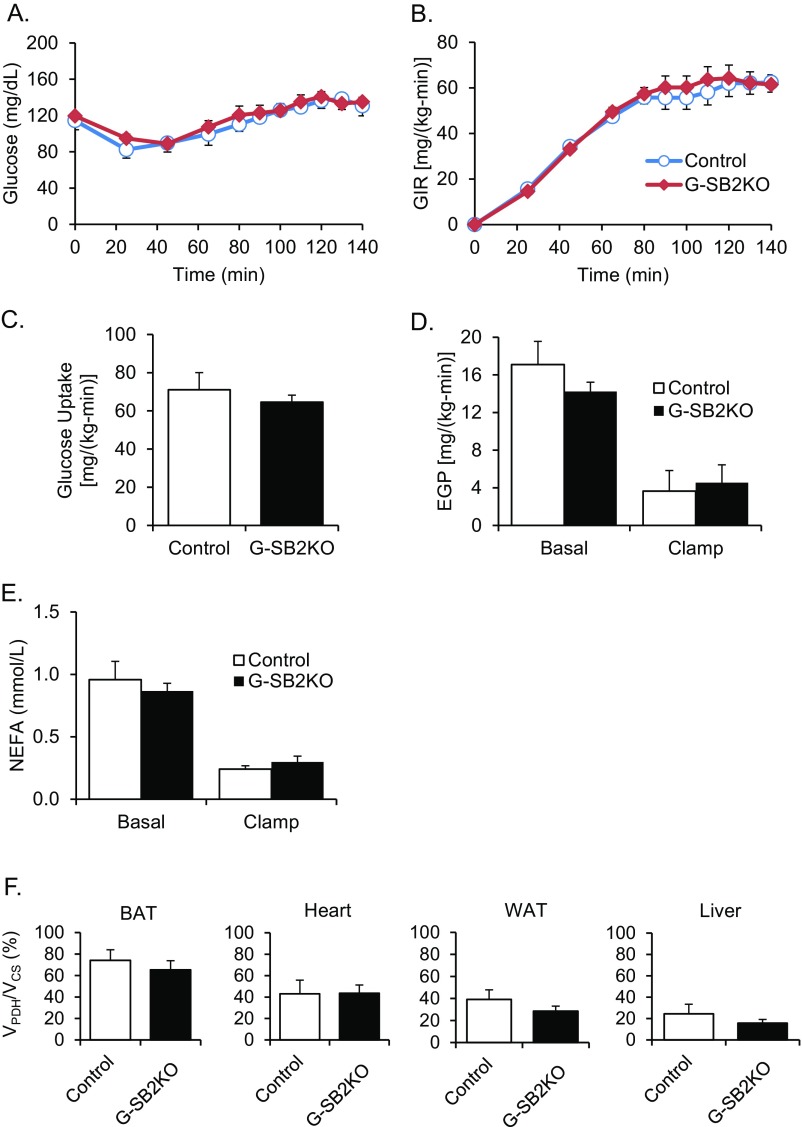
To more fully define glucose metabolism, G-SB2KO mice and their controls were subjected to hyperinsulinemic clamp studies with [U-13C]–labeled glucose infusion. To better mimic the postprandial state, the clamp was performed at very mild hyperglycemia with blood glucoses of ∼135 mg/dL (Fig. S9A). These glucose levels were obtained with similar glucose infusion rates [60.1 ± 4.8 for G-SB2KO vs. 67.4 ± 9.4 mg/(kg-min) for controls, P = 0.45] (Fig. S9B). Under these conditions there was also similar whole-body glucose uptake [64.6 ± 3.6 vs. 71.0 ± 9.0 mg/(kg-min), P = 0.44] (Fig. S9C), suppression of endogenous glucose production (72.6 ± 14.5 vs. 76.6 ± 16.9%, P = 0.87) (Fig. S9D), and suppression of nonesterified fatty acids (63.0 ± 7.1 vs. 69.7 ± 9.0%, P = 0.60) (Fig. S9E) in the G-SB2KO and control mice.
Fig. S9.
Hyperinsulinemic-glucose clamp and glucose flux. (A) Time course of serum glucose levels and (B) glucose infusion rate, (C) glucose uptake, (D) endogenous glucose production (EGP), and (E) nonesterified fatty acids (NEFA) during a hyperinsulinemic-glucose clamp. (F) VPDH/VCS for BAT, heart, WAT, and liver. n = 5 control, 11 G-SB2KO.
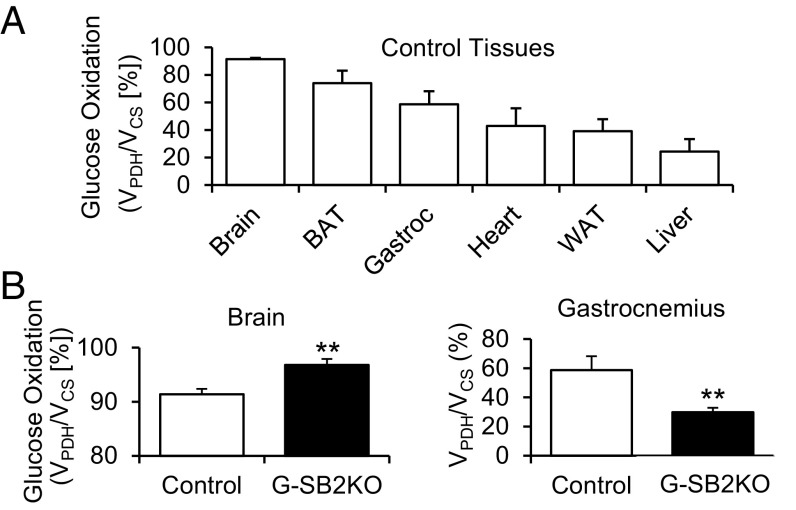
To identify the key tissues involved in the differential flux of carbohydrates, at the end of the clamp individual tissues were dissected, and the ratio of 13C2 acetyl CoA to 13C3 alanine determined. Under these conditions, the ratio of 13C2 acetyl CoA to 13C3 alanine provides an assessment of the ratio of flux through pyruvate dehydrogenase (PDH) relative to flux through citrate synthase (CS). These ratios were converted to percentages, with 100% indicating that only oxidized glucose was used in the tricarboxylic acid cycle, and reductions from 100% indicating the relative contribution from fat oxidation and amino acid deamination. As expected, in controls the highest carbohydrate flux was in the brain, with 91.4 ± 1.0% of the labeled glucose in 13C2 acetyl CoA, and other tissues showing lower rates (Fig. 5A). In the G-SB2KO mice, brain glucose oxidation increased even further to 96.8 ± 1.1% (P < 0.01), whereas this ratio decreased in gastrocnemius muscle from 58.6 ± 9.5% in controls to 29.8 ± 3.1 in G-SB2KO mice (P < 0.01), with no significant changes in ratio in heart, liver, white or brown fat (Fig. 5B and Fig. S9F). These data, together with the RER data, suggest that the increased whole-body carbohydrate metabolism in G-SB2KO mice is being driven by brain glucose oxidation at the expense of the muscle.
Fig. 5.
Glucose oxidation is increased in G-SB2KO brain. A hyperinsulinemic-glucose clamp was performed on 3-mo-old mice, with blood glucose clamped between 120 and 140 mg/dL. Blood glucose was maintained with variable infusion of [U-13C]glucose for 140 min. At the end of the clamp mice were killed and glucose oxidation, expressed as a ratio of flux through PDH to CS (VPDH/VCS %), was determined as described in Methods for (A) control tissues. (B) Differences in VPDH/VCS % for brain and gastrocnemius between control (n = 5) and G-SB2KO (n = 11). Student’s t test **P < 0.01.
Discussion
Cholesterol is an integral part of all cell membranes, including neurons and astrocytes. In agreement with studies using retinal ganglion cells (11), we show that in culture glial-conditioned media can support neurite outgrowth and that this is lost by knockdown of SREBP2 in the glia cells, indicating glial cholesterol production as an important contributor to this phenomenon.
To specifically reduce cholesterol synthesis in astroglial cells in vivo, we used Cre-lox technology to inactivate the master transcriptional regulator of the cholesterol synthetic genes, SREBP2, in astrocytes (G-SB2KO). Although the mice are fully viable, the brains of homozygous G-SB2KO mice, which still contain abundant astrocytes, are reduced in size by about 30%, with the greatest reductions in regions rich in astrocytes. Cholesterol content per gram tissue, however, shows only a modest reduction because of increased SREBP2 expression in neurons compensating for the loss in astrocytes.
Despite the partial rescue, G-SB2KO mice exhibit a broad array of behavioral changes. These mice also have a surprising reduction of body mass and are protected from age- and high-fat diet-induced obesity. SREBP2 KO in astrocytes also results in a major increase in RER in the fed state, indicating a shift toward carbohydrate metabolism driven by an increase in brain glucose oxidation.
Although some astrocytes do not express Gfap unless activated by an insult, and some adult neural progenitor cells also express Gfap (22), this transgene has been shown to be highly expressed in most astrocytes and active as early as E14.5 of gestation (16). It is possible that this results in some elements of progression, because Gfap− astrocytes could become Gfap+ with aging, or late neurogenesis could produce neurons with a Srebp2 KO. Nonetheless, most defects were already present by 3 mo of age and were stable until at least 10 mo of age.
The impact of SREBP2 loss from astrocytes on brain function is evident by multiple measures, including social behavior, learning and memory, and motor coordination. This broad set of behavioral defects is in line with the idea that loss of cholesterol production by astrocytes results in a generalized reduction in the quality and quantity of neuronal synapses. As a result, areas of the brain that have a lower density of astrocytes may be less vulnerable to the disruption in astrocyte cholesterol synthesis.
The alterations in metabolism because of loss of SREBP2 in astrocytes, especially the increase in RER in the fed state, are quite profound. This finding cannot be attributed to an increase in activity or increased sympathetic nervous system activity. Instead, it appears to be because of increased carbohydrate use by the brain, which is already a near obligate user of carbohydrates for fuel. This result became clear when we assessed the relative 13C labeling of 13C2 acetyl CoA vs. 13C3 alanine as measures of PDH flux relative to CS flux in brain and other tissues. A similar increase in RER during the first half of the dark cycle is observed in mice in which brain cholesterol synthesis was disrupted by heterozygous KO of SCAP (8). In the latter, in which regulation of cholesterol synthesis is disrupted in both neurons and glia, there is also an increase in VO2 and activity, suggesting additional mechanisms may be involved.
G-SB2KO mice also show an inability to accumulate fat on either a normal diet or high-fat diet. The difference in body weight and fat accumulation between control and G-SB2KO mice is not accounted for by an increase in energy expenditure or by caloric loss in urine or stool. Rather, the reduction in carbohydrate oxidation in muscle, and trends toward reductions in fat and liver, suggest that calories that might normally go to protein synthesis or lipogenesis are being diverted away to the brain, resulting in the smaller tissue weights of these other organs. The reason for the increased requirement for glucose by the brain is not clear; however, it may be that, in the absence of astrocyte-derived cholesterol, neurons become more active, consuming additional energy, or synthesize cholesterol less efficiently than astrocytes. Additionally, astrocytes are able to use a wider range of fuels than neurons, such as acetate (23). If neurons are forced to produce additional cholesterol, it would be expected that this might result in additional glucose consumption.
There is a strong link between diabetes, insulin resistance in the brain, and AD (24–27). Loss of insulin action in the brain also causes increased phosphorylation of tau protein, an early marker of AD (26). Amyloid-β, another marker of AD pathology, is cleared from the brain by insulin degrading enzyme, and it has been proposed that increased insulin in the brain, particularly in type 2 diabetes, results in competition for this enzyme, allowing for an increased build-up of amyloid-β around neurons (reviewed in ref. 28). Although these may be contributors to the link between diabetes and AD, it is clear that tau phosphorylation itself is not enough to trigger AD and that plaque quantity is not a perfect predictor of disease severity (29, 30). Preliminary clinical trials using intranasal insulin in patients with AD, but not diabetes, have shown some effectiveness on dementia symptoms (31), arguing that lack of insulin or insulin activity, rather than surplus insulin, may be a contributor to diabetes-associated AD. Subgroup analysis suggests that ApoE ε4 carrier status increases the response to intranasal insulin, implying an insulin–cholesterol relationship in this patient population (32). Furthermore, we and others have shown that knockdown or inhibition of cholesterol synthesis from neurons creates insulin resistance in those cells (33, 34), suggesting a feed-forward connection between diabetes and AD.
There is epidemiological evidence that increased serum cholesterol is associated with AD (14); however, cholesterol does not significantly cross the blood–brain barrier, and large randomized controlled clinical trials using cholesterol-lowering statin drugs showed little impact on AD progression (14). Although there are many possibilities for the failure of these trials, including low penetration of the drugs into the brain, our data suggest that lowering brain cholesterol levels could actually have a detrimental effect on brain function. In fact, sporadic reports of short-term memory loss associated with statin therapy have prompted the Food and Drug Administration to put a warning on the drug class (35). Furthermore, hyperlipidemia is often associated with insulin resistance as part of the metabolic syndrome. It may be that systemic insulin resistance is either causing reduced insulin transport into the brain (36) or impaired insulin signaling within the brain (25), which in turn could be causing a reduction in cholesterol synthesis. Further studies need to be directed at measuring brain insulin resistance and brain cholesterol levels in humans to help understand the roles of these pathways in the interaction between diabetes and altered brain function.
Methods
Lentiviral Silencing of SREBP2 in Glioma Cells.
C6 rat glioma cells were stably infected with lentiviral vector plasmids for Srebf2 shRNA or control scrambled shRNA.
Neurite Outgrowth.
GT1-7 cells were grown in 15.6-mm wells with transwells containing C6 shSrebf2 or C6 shScramble cells. Neurite length was measured using the NeuronJ plugin for ImageJ.
Animals.
Srebf2lox/lox mice were created using a targeting construct with lox sites flanking exon 1 and a neomycin selection cassette. These mice were crossed to GFAP-Cre mice expressing a 2.2-kb fragment of the human GFAP promoter (16). All animal studies followed the National Institutes of Health guidelines and were approved by the Institutional Animal Care and Use Committees at the Joslin Diabetes Center or the Yale University School of Medicine.
Histology.
Frozen sections of brain were stained using antibodies against GFAP (MAB360, EMD Millipore) and SREBP2 (LS-B1609, Lifespan Biosciences).
Behavioral Testing.
Nest building, Stone T-maze, and balance beam were performed to assess social, learning and memory, and motor function, respectively, as described in detail in SI Methods.
Body Composition and Metabolic Testing.
Metabolic cage testing was performed using a Comprehensive Laboratory Animal Monitoring System (CLAMS; Columbus Instruments).
VPDH/VCS Measurement.
Hyperinsulinemic-glucose clamps were performed in awake mice as previously described (37). At the end of the clamp, relative flux through PDH (VPDH) and CS (VCS) pathways in individual tissues was assessed as the ratio of 13C2 acetyl CoA to 13C3 alanine (i.e., the precursor and product of PDH flux). To measure tissue acetyl CoA content, ∼50 mg of tissue was homogenized in 1 mL of 10% (vol/vol) trichloroacetic acid. The extraction and LC/MS/MS were performed with atom percent enrichments calculated as described previously (38). Total alanine enrichment was measured by GC/MS.
SI Methods
Lentiviral Silencing of SREBP2 in Rat Glioma Cells.
C6 rat glioma cells were obtained from ATCC and grown in F12K media supplemented with 15% horse serum and 2.5% FBS. Cells were negative for mycoplasma contamination. Lentiviral vector plasmids for Srebf2 shRNA and control scrambled shRNA (GIPZ Lentiviral shRNA-mir, Open Biosystems) were packaged by cotransfection with packaging plasmids in HEK293T cells (Trans-Lentiviral Packaging System, Open Biosystems). Viral particles were concentrated by ultracentrifugation. Glioma cells were infected with lentivirus vectors 1 d after passaging. Puromycin (2.5 μg/mL) selection was started 48-h later. Knockdown cell lines were maintained in growth medium containing the same concentration of puromycin. Knockdown was confirmed by Western blotting for total and cleaved SREBP2 (kindly provided by Guosheng Liang, University of Texas Southwestern Medical Center, Dallas, TX) (39). Cholesterol secreted into the media was measured by collecting the media from dishes after 6 h of serum starvation and then quantified with the Amplex Red Cholesterol Assay kit (Invitrogen).
Neurite Outgrowth.
GT1-7 cells (kindly provided by Pamela Mellon, University of California, San Diego, CA) were grown in DMEM containing 10% FBS. On the day of the experiment, cells were passaged and 5 × 10⁴ cells were plated per 15.6-mm well. The next day the media was changed to C6 growth media and transwells were added, which were either empty or contained 4 × 10⁴ freshly plated C6 shSrebf2 or C6 shScramble cells. The next day the transwells were removed, and the GT1-7 cells were fixed and stained using an antibody against the vesicular transport protein VAMP2 (70222, Abcam), which effectively highlighted both the cell bodies and the neurites of the cells. Neurite length was measured using the NeuronJ plugin for ImageJ.
Animals.
Mice were housed in standard 12-h light/dark cycle. Mice were fed a chow diet (22% fat; Mouse Diet 9F, LabDiet) or high-fat diet (60% fat; D12492, Open Source Diets). Both male and female mice were used, as indicated in the figure legends. For tissue analysis, animals were anesthetized using a 2.5% (vol/vol) solution of a 2:1 mixture of 2,2,2-tribromoethanol and tertiary amyl alcohol (15 μL/g body weight, intraperitoneally). Animals were then perfused with 0.9% sodium chloride solution and tissues were quickly removed and the brain was dissected on ice using a brain matrix (ASI Instruments).
Srebf2lox/lox mice were created using a targeting construct with lox sites flanking exon 1 and a neomycin selection cassette. Mice were maintained on a C57B6/J background. The GFAP-Cre mice expressing a 2.2-kb fragment of the human GFAP promoter (16) were obtained from the National Cancer Institute Mouse Repository. Mice used in Figs. 2E and 5 and Fig. S9 were additionally crossed to mice carrying a transgene for GFP under the control of the human GFAP promoter; however, mice used in Fig. 2E were GFP− (40) (Jackson Laboratory). Littermate controls were used for all experiments.
Histology.
Frozen sections of brain were stained using antibodies against GFAP (MAB360, EMD Millipore) and SREBP2 (LS-B1609, Lifespan Biosciences). Nuclei were stained with DAPI (Thermo Fisher Scientific). Fat and liver samples were fixed and embedded in paraffin, then stained with H&E.
Behavioral Testing.
The nest-building test was performed with individually housed mice. At the end of the light cycle, mice were given eight strips of paper towel at the front of the cage. Before the end of the next light cycle, each cage was photographed and the nest construction was scored on a 1–4 scale: 1 = no biting or tearing with random dispersion of paper; 2 = no biting or tearing but gathering in a corner or side of cage; 3 = moderate biting or tearing and gathering in a corner or side of cage; 4 = extensive biting or tearing and gathering in a corner or side of cage (18).
Learning and memory were assessed by training mice in a Stone T-maze (Plastic-Craft), as previously described (19). The maze contained room-temperature water at a depth of 2 cm to encourage the mice to seek the dry, elevated finish box. Mice were returned to the home cage warmed by a heating pad between each run. On day 0, mice were trained in a straight run between the start box and the finish box. Training was complete when a mouse was able to complete 10 of the previous 11 runs in fewer than 15 s. On days 1 and 2 the mice were placed at the start of the maze and were allowed a maximum of 6 min to complete the maze. If a mouse was unable to complete the maze in 6 min, it was removed from the maze. Those mice that failed the maze twice were excluded from further testing. All successful mice completed a total of seven trials over the 2 d, at which point approximately half of the mice had mastered the maze. One week following the learning protocol, mice were again run through the maze for a total of three trials to assess memory. The average of these three runs is reported. Long-term memory was assessed by a final three runs, 1 mo after the original learning runs. Each trial was filmed and the number of wrong turns was counted manually. The assessor was blinded to the genotype of the mice.
The balance beam test consisted of a 12-mm-square wooden beam 70 cm in length with a landing platform and hut at one end (41). On days 1 and 2 the mice were each given two training runs, with at least 10 min between runs. On day 3, the mice were filmed completing two additional runs. Time-to-cross and number of foot slips were determined by review of the video. Grip strength was compared by measurement of the number of seconds a mouse was able to hang from an inverted cage lid, up to a maximum of 60 s (42). The best two of three trials were used for each mouse.
Body Composition and Metabolic Testing.
Body composition was measured using DXA scanning (Lunar PIXImus2 densitometer; GE Medical Systems). Metabolic cage testing was performed using CLAMS (Columbus Instruments). Mice were individually housed in the CLAMS units for a 48-h acclimation period followed by a 48- to 72-h testing period, during which indirect calorimetry, activity, and food intake were determined.
For glucose-tolerance testing, mice were fasted for 18 h then given glucose either intraperitoneally or by oral gavage (2 g/kg of body weight). Insulin-tolerance testing was performed following a 4-h fast using 1 unit of insulin per kilogram of body weight intraperitoneally. Blood pressure and pulse were measured with a Visitech tail-cuff (Apex). Measurements were taken over 4 d to acclimatize the mice to the device. The final day of measurements were reported. A RET-3 temperature probe (Physitemp Instruments) was used to measure body temperature per rectum. Feces were collected from individually housed mice for 3 d. Samples were then placed at 52 °C for 3 d until desiccated. Bomb calorimetry was performed on the samples at the Center for Excellence in Poultry Science, Central Analytical Laboratory (University of Arkansas). T3 and T4 were measured by RIA (Siemens). Commercial kits were used to measure the following serum hormones: corticosterone (Immunodiagnostic Systems), insulin and leptin (Crystal Chem), cholesterol and triglycerides (Stanbio), and free-fatty acids (WAKO). Tissue cholesterol was measured by colorimetric assay (WAKO) following lipid extraction, as described previously (8). Urine metanephrines and normetanephrines were measured using assays from Rocky Mountain Diagnostics.
VPDH/VCS Measurement.
Hyperinsulinemic-glucose clamps were performed in awake mice as previously described (37). Polyethylene catheters were placed in the jugular vein 6–7 d before each mouse clamp. Mice were fasted overnight (∼14 h) before the clamp studies. To assess basal whole-body glucose turnover, HPLC-purified [3-3H]-glucose (Perkin-Elmer) was infused at a rate of 0.05 μCi/min for 120 min into the venous catheter. Then hyperinsulinemic clamps were performed for 140 min with a 3-min primed infusion of human insulin [Novolin, Novo Nordisk; 7.14 mU/(kg-min)], followed by a continuous [3 mU/(kg-min)] infusion of insulin, and a variable infusion of 20% (wt/vol) [U-13C] dextrose (99% atom percent enrichment) to maintain mild hyperglycemia (120–140 mg/dL). To calculate whole-body glucose turnover during the clamps, [3-3H]-glucose was added to the 20% dextrose. The dilution was determined by predicting the glucose infusion rate, then targeting a [3-3H]-glucose infusion rate of 0.1 μCi/min. Plasma samples were obtained by tail massage at 0, 25, 45, 65, 80, 90, 100, 110, 120, 130, and 140 min. At the end of the clamps, mice were anesthetized with pentobarbital sodium injection (150 mg/kg); tissues were rapidly excised and snap-frozen in liquid nitrogen, and stored at −80 °C for subsequent analysis.
At the end of the clamp, relative flux through PDH (VPDH) and CS (VCS) pathways in individual tissues was assessed as the ratio of 13C2 acetyl CoA to 13C3 alanine (i.e., the precursor and product of PDH flux). To measure tissue acetyl CoA content, ∼50 mg of tissue was homogenized in 1 mL of 10% (vol/vol) trichloroacetic acid. The extraction and LC/MS/MS were performed with atom percent enrichments, calculated as described previously (38). Total alanine enrichment was measured by GC/MS. Approximately 50 mg of tissue was homogenized in water. The sample was dried in a Speed Vac, and 75 μL of l-butanol 4N HCl were added. The samples were then heated for 30 min at 60 °C and dried overnight in a 60 °C vacuum oven. The following day, the samples were reacted with 100 μL of trifluoroacetic acid in methylene chloride [1:7 (vol/vol)] and alanine enrichment was determined by GC/MS (CI mode, m/z 242 and 245) (43).
Statistics.
Comparisons were made using a two-sided Student’s t test unless otherwise noted in the figure legends. P < 0.05 was considered statistically significant. All bar graphs are presented as the mean ± SEM, except Fig. 3C, which uses SE of variance of proportion.
Study Approval.
All animal studies followed the National Institutes of Health guidelines and were approved by the Institutional Animal Care and Use Committees at the Joslin Diabetes Center or the Yale University School of Medicine.
Acknowledgments
We thank Megan Krumpoch and Noelle Castilla-Ojo for animal care. These studies were funded by National Institute of Diabetes, Digestive and Kidney Diseases Grants 5K08DK097293 (to H.A.F.), R01 DK-40936 and MMPC DK059635 (to G.I.S.), and R37DK031036 (to C.R.K.); and Diabetes Research Center Grants P30DK036836 (to the Joslin Diabetes Center) and P30CA06516 (to the Rodent Histopathology Core at Dana-Farber/Harvard Cancer Center).
Footnotes
The authors declare no conflict of interest.
This article contains supporting information online at www.pnas.org/lookup/suppl/doi:10.1073/pnas.1620506114/-/DCSupplemental.
References
- 1.Pfrieger FW, Ungerer N. Cholesterol metabolism in neurons and astrocytes. Prog Lipid Res. 2011;50(4):357–371. doi: 10.1016/j.plipres.2011.06.002. [DOI] [PubMed] [Google Scholar]
- 2.Brown MS, Goldstein JL. Cholesterol feedback: From Schoenheimer’s bottle to Scap’s MELADL. J Lipid Res. 2009;50(Suppl):S15–S27. doi: 10.1194/jlr.R800054-JLR200. [DOI] [PMC free article] [PubMed] [Google Scholar]
- 3.Dietschy JM, Turley SD. Thematic review series: Brain ipids. cholesterol metabolism in the central nervous system during early development and in the mature animal. J Lipid Res. 2004;45(8):1375–1397. doi: 10.1194/jlr.R400004-JLR200. [DOI] [PubMed] [Google Scholar]
- 4.Balazs Z, et al. Uptake and transport of high-density lipoprotein (HDL) and HDL-associated alpha-tocopherol by an in vitro blood-brain barrier model. J Neurochem. 2004;89(4):939–950. doi: 10.1111/j.1471-4159.2004.02373.x. [DOI] [PubMed] [Google Scholar]
- 5.Schönfeld P, Reiser G. Why does brain metabolism not favor burning of fatty acids to provide energy? Reflections on disadvantages of the use of free fatty acids as fuel for brain. J Cereb Blood Flow Metab. 2013;33(10):1493–1499. doi: 10.1038/jcbfm.2013.128. [DOI] [PMC free article] [PubMed] [Google Scholar]
- 6.Miao J, et al. Hepatic insulin receptor deficiency impairs the SREBP-2 response to feeding and statins. J Lipid Res. 2014;55(4):659–667. doi: 10.1194/jlr.M043711. [DOI] [PMC free article] [PubMed] [Google Scholar]
- 7.Suzuki R, et al. Diabetes and insulin in regulation of brain cholesterol metabolism. Cell Metab. 2010;12(6):567–579. doi: 10.1016/j.cmet.2010.11.006. [DOI] [PMC free article] [PubMed] [Google Scholar]
- 8.Suzuki R, Ferris HA, Chee MJ, Maratos-Flier E, Kahn CR. Reduction of the cholesterol sensor SCAP in the brains of mice causes impaired synaptic transmission and altered cognitive function. PLoS Biol. 2013;11(4):e1001532. doi: 10.1371/journal.pbio.1001532. [DOI] [PMC free article] [PubMed] [Google Scholar]
- 9.Fields RD, Woo DH, Basser PJ. Glial regulation of the neuronal connectome through local and long-distant communication. Neuron. 2015;86(2):374–386. doi: 10.1016/j.neuron.2015.01.014. [DOI] [PMC free article] [PubMed] [Google Scholar]
- 10.Volterra A, Liaudet N, Savtchouk I. Astrocyte Ca2+ signalling: An unexpected complexity. Nat Rev Neurosci. 2014;15(5):327–335. doi: 10.1038/nrn3725. [DOI] [PubMed] [Google Scholar]
- 11.Mauch DH, et al. CNS synaptogenesis promoted by glia-derived cholesterol. Science. 2001;294(5545):1354–1357. doi: 10.1126/science.294.5545.1354. [DOI] [PubMed] [Google Scholar]
- 12.Liu Q, et al. Neuronal LRP1 knockout in adult mice leads to impaired brain lipid metabolism and progressive, age-dependent synapse loss and neurodegeneration. J Neurosci. 2010;30(50):17068–17078. doi: 10.1523/JNEUROSCI.4067-10.2010. [DOI] [PMC free article] [PubMed] [Google Scholar]
- 13.Barbero-Camps E, Fernández A, Martínez L, Fernández-Checa JC, Colell A. APP/PS1 mice overexpressing SREBP-2 exhibit combined Aβ accumulation and tau pathology underlying Alzheimer’s disease. Hum Mol Genet. 2013;22(17):3460–3476. doi: 10.1093/hmg/ddt201. [DOI] [PMC free article] [PubMed] [Google Scholar]
- 14.McGuinness B, et al. Statins for the treatment of dementia. Cochrane Database Syst Rev. 2010;(8):CD007514. doi: 10.1002/14651858.CD007514.pub2. [DOI] [PubMed] [Google Scholar]
- 15.LaDu MJ, et al. Nascent astrocyte particles differ from lipoproteins in CSF. J Neurochem. 1998;70(5):2070–2081. doi: 10.1046/j.1471-4159.1998.70052070.x. [DOI] [PubMed] [Google Scholar]
- 16.Bajenaru ML, et al. Astrocyte-specific inactivation of the neurofibromatosis 1 gene (NF1) is insufficient for astrocytoma formation. Mol Cell Biol. 2002;22(14):5100–5113. doi: 10.1128/MCB.22.14.5100-5113.2002. [DOI] [PMC free article] [PubMed] [Google Scholar]
- 17.Camargo N, et al. High-fat diet ameliorates neurological deficits caused by defective astrocyte lipid metabolism. FASEB J. 2012;26(10):4302–4315. doi: 10.1096/fj.12-205807. [DOI] [PubMed] [Google Scholar]
- 18.Morales-Corraliza J, et al. Immunization targeting a minor plaque constituent clears β-amyloid and rescues behavioral deficits in an Alzheimer’s disease mouse model. Neurobiol Aging. 2013;34(1):137–145. doi: 10.1016/j.neurobiolaging.2012.04.007. [DOI] [PMC free article] [PubMed] [Google Scholar]
- 19.Pistell PJ, Ingram DK. Development of a water-escape motivated version of the Stone T-maze for mice. Neuroscience. 2010;166(1):61–72. doi: 10.1016/j.neuroscience.2009.12.029. [DOI] [PMC free article] [PubMed] [Google Scholar]
- 20.Morrison SF, Madden CJ. Central nervous system regulation of brown adipose tissue. Compr Physiol. 2014;4(4):1677–1713. doi: 10.1002/cphy.c140013. [DOI] [PMC free article] [PubMed] [Google Scholar]
- 21.Coelho-Aguiar JdeM, et al. The enteric glia: Identity and functions. Glia. 2015;63(6):921–935. doi: 10.1002/glia.22795. [DOI] [PubMed] [Google Scholar]
- 22.Sofroniew MV. Transgenic techniques for cell ablation or molecular deletion to investigate functions of astrocytes and other GFAP-expressing cell types. Methods Mol Biol. 2012;814:531–544. doi: 10.1007/978-1-61779-452-0_35. [DOI] [PubMed] [Google Scholar]
- 23.Waniewski RA, Martin DL. Preferential utilization of acetate by astrocytes is attributable to transport. J Neurosci. 1998;18(14):5225–5233. doi: 10.1523/JNEUROSCI.18-14-05225.1998. [DOI] [PMC free article] [PubMed] [Google Scholar]
- 24.Kleinridders A, Ferris HA, Cai W, Kahn CR. Insulin action in brain regulates systemic metabolism and brain function. Diabetes. 2014;63(7):2232–2243. doi: 10.2337/db14-0568. [DOI] [PMC free article] [PubMed] [Google Scholar]
- 25.Talbot K, et al. Demonstrated brain insulin resistance in Alzheimer’s disease patients is associated with IGF-1 resistance, IRS-1 dysregulation, and cognitive decline. J Clin Invest. 2012;122(4):1316–1338. doi: 10.1172/JCI59903. [DOI] [PMC free article] [PubMed] [Google Scholar]
- 26.Schubert M, et al. Role for neuronal insulin resistance in neurodegenerative diseases. Proc Natl Acad Sci USA. 2004;101(9):3100–3105. doi: 10.1073/pnas.0308724101. [DOI] [PMC free article] [PubMed] [Google Scholar]
- 27.Bomfim TR, et al. An anti-diabetes agent protects the mouse brain from defective insulin signaling caused by Alzheimer’s disease- associated Aβ oligomers. J Clin Invest. 2012;122(4):1339–1353. doi: 10.1172/JCI57256. [DOI] [PMC free article] [PubMed] [Google Scholar]
- 28.Yang Y, Song W. Molecular links between Alzheimer’s disease and diabetes mellitus. Neuroscience. 2013;250:140–150. doi: 10.1016/j.neuroscience.2013.07.009. [DOI] [PubMed] [Google Scholar]
- 29.Bennett DA, Schneider JA, Arvanitakis Z, Wilson RS. Overview and findings from the religious orders study. Curr Alzheimer Res. 2012;9(6):628–645. doi: 10.2174/156720512801322573. [DOI] [PMC free article] [PubMed] [Google Scholar]
- 30.Bennett DA, et al. Overview and findings from the rush Memory and Aging Project. Curr Alzheimer Res. 2012;9(6):646–663. doi: 10.2174/156720512801322663. [DOI] [PMC free article] [PubMed] [Google Scholar]
- 31.Craft S, et al. Intranasal insulin therapy for Alzheimer disease and amnestic mild cognitive impairment: A pilot clinical trial. Arch Neurol. 2012;69(1):29–38. doi: 10.1001/archneurol.2011.233. [DOI] [PMC free article] [PubMed] [Google Scholar]
- 32.Claxton A, et al. Sex and ApoE genotype differences in treatment response to two doses of intranasal insulin in adults with mild cognitive impairment or Alzheimer’s disease. J Alzheimers Dis. 2013;35(4):789–797. doi: 10.3233/JAD-122308. [DOI] [PMC free article] [PubMed] [Google Scholar]
- 33.Fukui K, Ferris HA, Kahn CR. Effect of cholesterol reduction on receptor signaling in neurons. J Biol Chem. 2015;290(44):26383–26392. doi: 10.1074/jbc.M115.664367. [DOI] [PMC free article] [PubMed] [Google Scholar]
- 34.Fox TE, et al. Insulin signaling in retinal neurons is regulated within cholesterol-enriched membrane microdomains. Am J Physiol Endocrinol Metab. 2011;300(3):E600–E609. doi: 10.1152/ajpendo.00641.2010. [DOI] [PMC free article] [PubMed] [Google Scholar]
- 35.FDA 2012 FDA Drug Safety Commision: Important safety label changes to cholesterol-lowering statin drugs. Available at www.fda.gov/drugs/drugsafety/ucm293101.htm. Accessed August 1, 2016.
- 36.Craft S, et al. Cerebrospinal fluid and plasma insulin levels in Alzheimer’s disease: Relationship to severity of dementia and apolipoprotein E genotype. Neurology. 1998;50(1):164–168. doi: 10.1212/wnl.50.1.164. [DOI] [PubMed] [Google Scholar]
- 37.Camporez JP, et al. Cellular mechanism by which estradiol protects female ovariectomized mice from high-fat diet-induced hepatic and muscle insulin resistance. Endocrinology. 2013;154(3):1021–1028. doi: 10.1210/en.2012-1989. [DOI] [PMC free article] [PubMed] [Google Scholar]
- 38.Perry RJ, et al. Hepatic acetyl CoA links adipose tissue inflammation to hepatic insulin resistance and type 2 diabetes. Cell. 2015;160(4):745–758. doi: 10.1016/j.cell.2015.01.012. [DOI] [PMC free article] [PubMed] [Google Scholar]
- 39.Shimano H, et al. Overproduction of cholesterol and fatty acids causes massive liver enlargement in transgenic mice expressing truncated SREBP-1a. J Clin Invest. 1996;98(7):1575–1584. doi: 10.1172/JCI118951. [DOI] [PMC free article] [PubMed] [Google Scholar]
- 40.Zhuo L, et al. Live astrocytes visualized by green fluorescent protein in transgenic mice. Dev Biol. 1997;187(1):36–42. doi: 10.1006/dbio.1997.8601. [DOI] [PubMed] [Google Scholar]
- 41.Carter RJ, Morton J, Dunnett SB. Motor coordination and balance in rodents. Current Protocols in Neuroscience. 2001;8:8.12. doi: 10.1002/0471142301.ns0812s15. [DOI] [PubMed] [Google Scholar]
- 42.Brooks SP, Dunnett SB. Test to assess motor phenotype in mice: A user's guide. Nat Rev Neurosci. 2009;10(7):519–529. doi: 10.1038/nrn2652. [DOI] [PubMed] [Google Scholar]
- 43.Petersen KF, et al. Effect of aging on muscle mitochondrial substrate utilization in humans. Proc Natl Acad Sci USA. 2015;112(36):11330–11334. doi: 10.1073/pnas.1514844112. [DOI] [PMC free article] [PubMed] [Google Scholar]


