Significance
Nanotunnels are long, thin mitochondrial extensions that have been implied in direct long-distance (1 to >5 µm) communication between mitochondria of cardiac myocytes. The engineered RyR2A4860G+/− mutation, resulting in loss of function of the sarcoplasmic reticulum calcium release channel and arrhythmia, induces a striking increase in the frequency of long-distance intermitochondrial communication via nanotunnels without involvement of obvious mitochondrial migration. We use this model for exploring the significance of mitochondrial nanotunneling in myocardium and the contribution of microtubules to the formation of these unusual organelle extensions using EM tomography and live confocal imaging. This study constitutes an approach to arrhythmia investigations that focuses on a new target: the mitochondria.
Keywords: mitochondria, nanotunnels, CPVT, RyR2, mitochondrial dynamics
Abstract
Exchanges of matrix contents are essential to the maintenance of mitochondria. Cardiac mitochondrial exchange matrix content in two ways: by direct contact with neighboring mitochondria and over longer distances. The latter mode is supported by thin tubular protrusions, called nanotunnels, that contact other mitochondria at relatively long distances. Here, we report that cardiac myocytes of heterozygous mice carrying a catecholaminergic polymorphic ventricular tachycardia-linked RyR2 mutation (A4860G) show a unique and unusual mitochondrial response: a significantly increased frequency of nanotunnel extensions. The mutation induces Ca2+ imbalance by depressing RyR2 channel activity during excitation–contraction coupling, resulting in random bursts of Ca2+ release probably due to Ca2+ overload in the sarcoplasmic reticulum. We took advantage of the increased nanotunnel frequency in RyR2A4860G+/− cardiomyocytes to investigate and accurately define the ultrastructure of these mitochondrial extensions and to reconstruct the overall 3D distribution of nanotunnels using electron tomography. Additionally, to define the effects of communication via nanotunnels, we evaluated the intermitochondrial exchanges of matrix-targeted soluble fluorescent proteins, mtDsRed and photoactivable mtPA-GFP, in isolated cardiomyocytes by confocal microscopy. A direct comparison between exchanges occurring at short and long distances directly demonstrates that communication via nanotunnels is slower.
Recent concepts of mitochondrial structure and function oscillate between two divergent views. One view emphasizes the totally dynamic concept of a mitochondrial system, as seen in bacteria and cultured cells, represented by individual elements that enjoy extensive mobility combining large migrations between different areas of the cells with dynamic tubulation, fusion, and fission processes (1–3). At the opposite end of the spectrum is a restricted static view of mitochondria, as seen in mouse skeletal muscle, in which mitochondria constitute a semipermanent extensive network that allows intracellular energy distribution (4). Obviously, neither extreme view applies perfectly to all cells, tissues, and functional conditions. In differentiated skeletal and cardiac muscle, mitochondria are stabilized in a stereotyped positioning relative to myofibrils mostly because their movements are restricted by the narrow spaces between the myofibrils and also because they are specifically tethered, perhaps via mitofusin-2 to the membrane systems, mostly to the sarcoplasmic reticulum (SR) (5–8). Exchange of matrix content, DNA, and proteins and segregation of damaged mitochondrial components are needed for maintaining mitochondrial and cell functions (9, 10). Striated muscles have developed a unique system of intermitochondrial communication either directly at short distances or via long nanotunnel extensions (11, 12). Neither type of communication apparently requires a migration of the organelles from their tethered sites. Unique intimate contacts, “kissing junctions,” coordinate structural associations between mitochondria (13).
Ca2+ plays two major roles in mitochondrial functions. One is to regulate oxidative energy production, permeability transition, and other processes in the mitochondrial matrix (14). The other role is to control mitochondrial dynamics via fission by targeting of Drp1 (15, 16) and via motility by targeting of Miro proteins (17–19) in the cytoplasm. In some striated muscles, including mammalian myocardium, mitochondria are strategically located for uptake and sensing of small amount of Ca2+ during its release from the adjoining SR (6, 20, 21). This makes mitochondria particularly responsive to changes in Ca2+ homeostasis. The cardiac ryanodine receptor (RyR2) is the SR Ca2+ release channel involved in normal excitation–contraction (E–C) coupling in cardiac muscle. Mutations in skeletal ryanodine receptor (RyR1) resulting in unbalanced Ca2+ homeostasis can affect mitochondrial morphology and distribution (22, 23). Defects in mitochondrial dynamics and mitochondrial morphology have also been reported in various cardiomyopathies and heart failure but have not been linked to Ca2+ homeostasis.
In this communication we demonstrate an unusual cardiac mitochondrial response to an engineered RyR2 mutation (A4860G). The mutation depresses RyR2 channel activity during E–C coupling, but also results in random bursts of Ca2+ release during systole. Therefore, the myocytes are affected by a specific Ca2+ metabolism imbalance, resulting in a form of catecholaminergic polymorphic ventricular tachycardia (24). The unique mitochondrial response is a striking increase in long-distance intermitochondrial communications by widespread nanotunnel extensions (12). The study of RyR2A4860G+/− cardiomyoctytes allows us to define and differentiate between two modes of intermitochondrial communications (close proximity kissing and long-distance nanotunneling), neither of which requires physical migration of the organelles.
Results
Ultrastructure of WT and RyR2A4860G+/− Cardiomyocytes: Variability in Mitochondrial Shapes/Disposition.
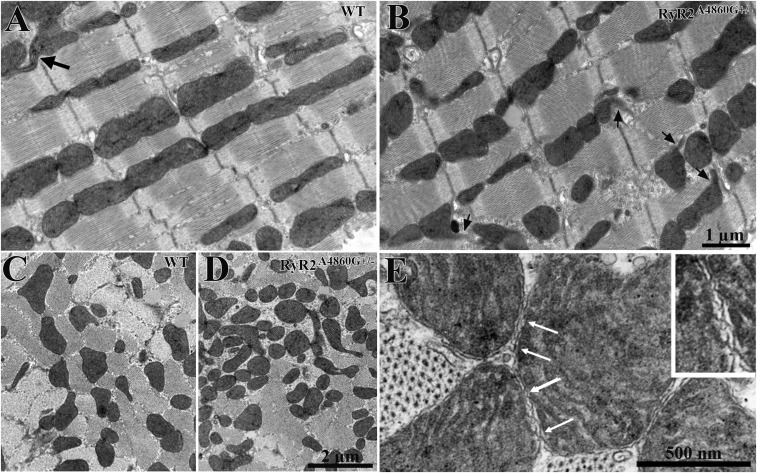
The RyR2A4860G+/− mutation induces an unexpected, unique mitochondrial response in the myocardium, but does not affect any other structural components (Fig. 1 A and B). Cardiac mitochondria in WT mice are discrete organelles aligned in either single or multiple longitudinal rows between myofibrils (Fig. 1A). They are approximately cylindrical with rounded edges and occasional short tubular extensions, or nanotunnels (Fig. 1A) (12), and they are longitudinally oriented. The overall appearance and disposition of sectioned mitochondrial profiles in myocytes from the heterozygotes are essentially the same as in WT but with two exceptions. First, the frequency of nanotunnel extensions is notably increased and that results in overall distortions of the mitochondrial profiles (Figs. 1B and 2 A and D). Second, this is accompanied by a visibly higher occurrence of small mitochondrial profiles in mutant (Fig. 1D) vs. WT (Fig. 1C) detected in cross-sections.
Fig. 1.
Mitochondria in WT and RyR2A4860G+/− cardiomyocytes. (A and B) Thin longitudinal sections of WT and RyR2A4860G+/− myocytes. Mitochondria are longitudinally arranged in the spaces between the myofibrils, often in single file, constituting ∼40% of the cell volume. The majority of mitochondria are cylindrical in shape with a variable diameter and length. Larger mitochondria infrequently extend protrusions, or nanotunnels (arrows), which are less frequent in WT (A) than in RyR2A4860G+/− (B). (C and D) In cross-sections, the intersections of mitochondria and nanotunnels with the plane of section constitute separate profiles, with variable diameter and distribution. Small profiles are less frequent in WT (C) than in RyR2A4860G+/− (D). (E) Contiguous mitochondria form kissing junctions (arrows) at their sites of close proximity. In these specialized contact areas, the outer membrane protrudes into periodic contacts, and occasionally the inner membrane participates in the junction. The Inset is enlarged by threefold. The frequency of kissing junctions relative to the closely apposed sets of mitochondria does not significantly differ in the two sets of myocytes: 82 ± 19% in WT (mean ± SD, 293 mitochondrial couples, 30 cardiomyocytes, three hearts) and 89 ± 12% in mutants (385 mitochondrial couples, 32 cardiomyocytes, three hearts).
Fig. 2.
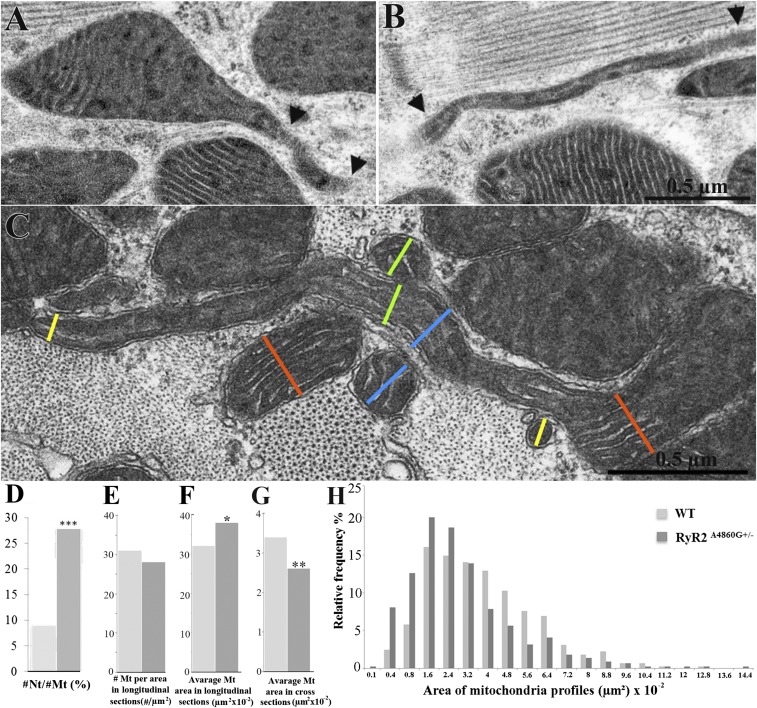
Images and quantitation of mitochondria and nanotunnels. (A–C) Mitochondria and nanotunnels in RyR2A4860G+/− myocytes. (A) Mitochondrial outlines are distorted into a conical protrusion at the site of nanotunnel origin. A short segment of the nanotunnel (between arrowheads) is contained within the section. (B) A very thin longitudinally oriented nanotunnel (between arrowheads) is followed for over 2 µm. (C) A nanotunnel extends transversely across the fiber from the mitochondrion at the right to the one at the far left, overpassing and possibly kissing other mitochondria. The cristae are present and aligned parallel to the long axis of the tunnel. Colored lines indicate correspondence between the diameter of a mitochondrion/nanotunnel and the nearby sectioned profiles. (D) The ratio of nanotunnel extensions (#Nt) to sectioned mitochondrial profile numbers (#Mt) is higher in RyR2A4860G+/− vs. WT myocytes: 28 ± 9% (mean and SD, n = 588 mitochondria, 51 micrographs) vs. 9 ± 5% (n = 724 mitochondria, 54 micrographs), three hearts each; ***P < 0.0001 (Student’s t test). (E) The number of mitochondria (#Mt) per area of EM images in longitudinal sections is not different in WT and RyR2A4860G+/−: 31 ± 9 (n = 32 areas, 980 mitochondria, 17 cells) vs. 28 ± 11 (n = 31 areas, 854 mitochondria, 16 cells), three hearts each; P > 0.05. (F) The average of mitochondrial area (µm2) in longitudinal section is slightly smaller in the WT than in RyR2A4860G+/−: 32 ± 9 × 10⁻² vs. 38 ± 11 × 10−2; *P < 0.05. (G) Average of mitochondrial area (µm2) in cross-section is significantly higher in the WT than in RyR2A4860G+/−: 3.4 ± 0.5 × 10⁻² (n = 15 areas, 448 mitochondria) vs. 2.6 ± 0.5 × 10⁻² (n = 15 areas, 485 mitochondria), two hearts; **P < 0.001. (H) Relative frequency of mitochondrial profile areas in cross-sections of WT and RyR2A4860G+/− as percentage of total. In mutant cells, there is a clear shift toward small profiles.
Neighboring mitochondria may join each other either at their ends or laterally at kissing junctions, which are very intimate contacts involving a specific narrow proximity of the outer membranes over small spots at short intervals (Fig. 1E) (12, 13). The frequency of kissing junctions, or sites of possible communication between large mitochondria, is essentially unaltered in the mutant vs. WT. On average, 82% in WT and 89% in mutants of the mitochondrial proximity sites have kissing junctions (Fig. 1E).
Analysis of Nanotunnel Structure, Disposition, and Frequency.
The higher frequency of nanotunnels associated with RyR2A4860G+/− mitochondria offers the opportunity for an in-depth analysis of nanotunnel microanatomy. Nanotunnels are funnel-shaped extensions at their origin, and their diameters decrease in proximity of the mitochondria and then remain fairly constant within a range of 0.04–0.20 µm (Fig. 2 A–C). All nanotunnels, even the narrowest ones, clearly have outer and inner membranes; they contain matrix proteins and show a continuation of the cristae, mostly aligned parallel to the long axis of the tunnel (Fig. 2 B and C). This establishes a preferential pathway within the matrix for diffusion along the nanotunnel’s long axis. Mitochondrial extensions constituted only of the outer membrane as described in dividing bacteria were never encountered, indicating that nanotunnels are not simply stretched-out bridging connections between dividing mitochondria that are in the process of moving apart.
The length of nanotunnels profiles varies between 0.7 µm and 3.6 µm in thin sections. This is likely an underestimate of the real length because the nanotunnels frequently escape from the plane of the thin sections. For the same reason, connections between two mitochondria via nanotunnels are seldom observed, but one is seen in Fig. 2C. The frequency of nanotunnel extensions relative to the number of mitochondria is approximately threefold higher in the mutant compared with the WT (28 vs. 9) (Fig. 2D).
The Case for a Nanotunnels-to-Small Profiles Connection.
An immediate question to be considered is whether there is a direct relationship between small mitochondrial profiles seen in thin sections and the presence of nanotunnels.
The overall number of mitochondria per area of thin longitudinal section is not different in RyR2A4860G+/− and WT (Fig. 2E). The average areas of sectioned mitochondrial profiles measured in longitudinal sections is also not very different (0.36 µm2 vs. 0.31 µm2) (Fig. 2F). On the contrary, cross-sections give data apparently conflicting with the data above. First, the average areas of profiles measured in cross-sections is smaller by two orders of magnitude than those in longitudinal sections (Fig. 2G). The reason for this apparent discrepancy is that the orientation of both mitochondria and nanotunnels are strongly anisotropic: both are oriented in a longitudinal direction, parallel to the myofibrils’ long axis, and the length of the mitochondrion contributes significantly to the measured area (Fig. 1 A and B). Second, the mitochondrial areas in cross-sections are significantly smaller in RyR2A4860G+/− vs. WT (0.025 µm2 vs. 0.034 µm2) (Fig. 2G). The reason for this result is that profiles of mitochondrial bodies and of their nanotunnels extensions appear as separate entities in cross-sections, and each nanotunnel can give rise to small mitochondrial profiles at several points along its length (Fig. 2C). Indeed, the histogram in Fig. 2H, from cross-sectional data, shows a large spike in the frequency of mitochondrial profiles with areas of 0.016–0.024 µm2 consistent with that expected from sections cutting at right angles to nanotunnels with the diameter mentioned above (Fig. 2C), and their presence contributes to the apparent decrease in average mitochondrial dimensions in mutants (Fig. 2G).
The Complex Distribution of Nanotunnels and Its Relationship to Microtubules Is Evidenced by EM Tomography and 3D Imaging.
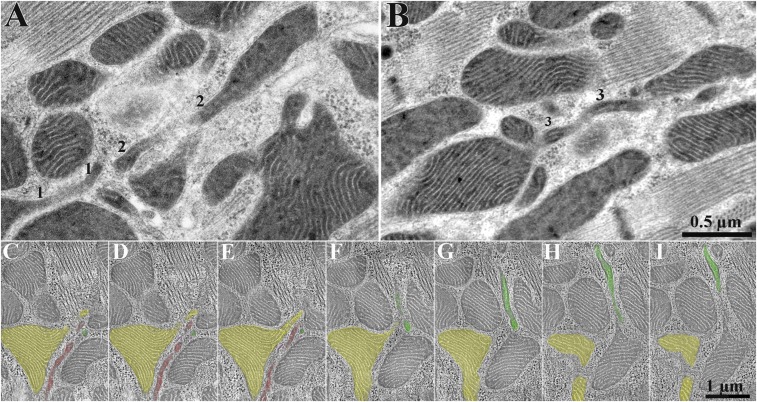
To directly assess the contribution of nanotunnels to small mitochondrial profiles observed in thin section (Fig. 3 A and B), we followed the path of nanotunnels through 0.4-μm-thick sections using electron tomography (Fig. 3 C–I; Movie S1). In the serial images, three long nanotunnels contribute to several small, round mitochondrial profiles visible as individual images. Interestingly, microtubules (Fig. 3 C–G and Movie S1) follow the path of nanotunnels (see also below).
Fig. 3.
The relationship between nanotunnels and small mitochondrial profiles imaged in rapidly frozen RyR2A4860G+/− myocytes. (A and B) In thin sections, the small profiles 1, 2, and 3 belong to three nanotunnels that are partly included in the section thickness and generate small apparently separated profiles at the edge of the section. (C–I) Sequential images taken from a tomogram of a 0.4-μm section (235 images recorded) provide images equivalent to those in thin sections (Movie S1). Three different colors identify profiles that appear continuous in some part of the tomogram but contribute to apparently separate profiles in other views. Microtubules colored in purple (C–G) follow the path of nanotunnel profiles (Movies S1 and S7).
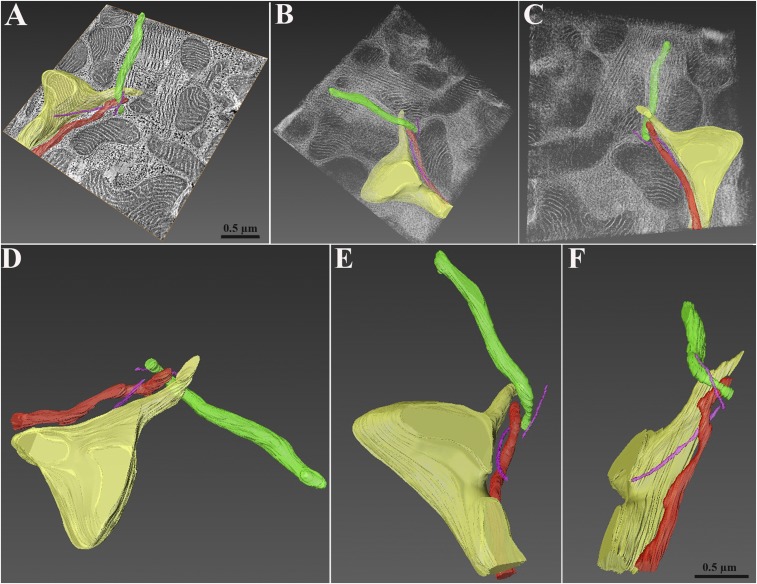
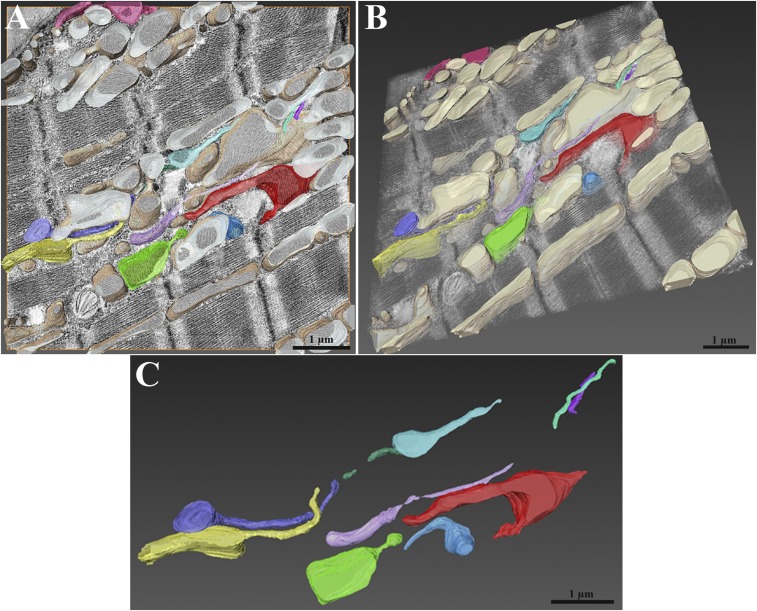
Mitochondria extending nanotunnels and microtubules were segmented and reconstructed in 3D (Fig. 4; Movies S2–S4). This more clearly shows that the majority of small mitochondrial profiles are sections through nanotunnel extensions. Nanotunnels are quite convoluted and have varied orientations relative to each other and the myofibrils, but they do not show any evidence for direct connections to each other even when they are separated by small distances. Under low magnification, a large zone of intense mitochondrial network was reconstructed (Fig. 5; Movie S5). In the volume of the section, nanotunnels pass over each other and other mitochondria forming part of an extensive complex assembly (Fig. 5; Movie S6). Due to limitations of the reconstruction, which did not cover a sufficient depth, it was not feasible to demonstrate direct mitochondrion-to-mitochondrion continuity via nanotunnels.
Fig. 4.
Three-dimensional reconstruction of mitochondrial nanotunnels in RyR2A4860G+/−. (A) Orthoslice view of cardiac muscle with mitochondrial nanotunnels and microtubules segmented and reconstructed using electron tomograms. Each color identifies a specific mitochondrion (Movie S2), whereas microtubules are highlighted in purple. (B and C) Mitochondria and microtubules are shown in the volume of the section (566 millions voxels) in different orientations. Nanotunnels extend in three dimensions through the volume of the myocyte, passing over each other and appearing as small, round mitochondria on the surface of the section (Movie S3). Microtubules follow their profiles. (D–F) Three representative orientations emphasize the complexity (Movie S4).
Fig. 5.
Complexity of nanotunnel dispositions in a large sectional area of RyR2A4860G+/−. A tomogram was recorded at lower STEM magnification (14,000×) to reconstruct a large area of intense mitochondrial nanotunneling activity. Mitochondria not extending nanotunnels are colored in pale brown; mitochondria-extending nanotunnels are highlighted by different colors. (A) Orthoslice view of the myocyte with mitochondrial 3D reconstruction (Movie S5). (B) View of mitochondria in the myocyte volume (255 million voxels) showing the complex arrangement in a crowded area (Movie S6). (C) Three-dimensional model of nanotunnels showing their variability on length; some extend over several microns.
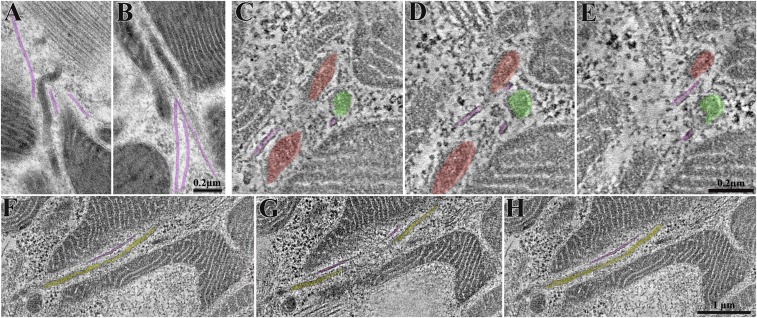
Ultrathin sections of rapidly frozen cardiomyocytes, as well as electron tomography and 3D reconstructions, showed an abundance of microtubules in close, parallel proximity with nanotunnels (Fig. 6; Movie S7), suggesting that microtubules may contribute to tunneling dynamics. Interestingly, electron micrographs show that cristae in nanotunnels are aligned parallel to the longitudinal axis of the extensions, suggesting the possibility that these structures arise from a pulling action along the microtubules (Fig. 2C), consistent with the hypothesis that microtubules are involved in this process.
Fig. 6.
Microtubules apparently guide nanotunnels. (A and B) Ultrathin section of rapidly frozen cardiomyocyte. Microtubules (in purple) are very close to mitochondrial profiles and are oriented following the direction/orientation of nanotunnels. (C–H) Selected images from two tomograms showing microtubules that accompany nanotunnels (red and green in C–E and yellow in F–H) (Movie S7).
Two Modes of Intermitochondria Communication with Different Kinetics.
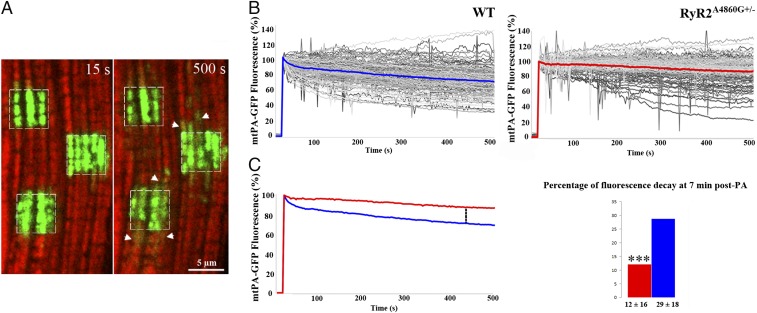
To evaluate whether the presence of nanotunnels affects the flow of matrix-targeted soluble fluorescent proteins between mitochondria, we compared exchanges of mtDsRed and mtPA-GFP between mitochondria of isolated WT and RyR2A4860G+/− cardiomyocytes. mtPAGFP was photoactivated within two to five small square areas (25 µm2) per cell, resulting in simultaneous bleaching of mtDsRed in the same area (Fig. 7A). During the time of recording (165 cycles at 3-s intervals), the mtPA-GFP fluorescence decays in the photoactivated (PA) areas whereas small positive spots appear within a few microns (Fig. 7A). The fact that the proteins are within the mitochondrial matrix indicates flow through some mitochondrial extensions and/or exchanges between mitochondria.
Fig. 7.
mtPA-GFP fluorescence decay in WT and RyR2A4860G+/− cardiomyocytes. (A) Representative WT cardiomyocyte showing PA areas (squares) at 15 s from irradiation and at the end of recording (500 s). The mtPA-GFP fluorescence decays in the selected areas whereas small positive spots (arrowheads) appear in their vicinity. (B) Intensity of mtPA-GFP fluorescence signal in PA areas normalized to PA peak value during 500 s of recording. Gray curves represent individual regions; blue and red, the average in WT and heterozygotes, respectively. (C, Left) Direct comparison of the two average traces. The decay is faster in WT. (Right) At 445 s post-PA, percentage decay of signal is significantly smaller in heterozygote (red) than in WT (blue): 12 ± 16% (mean ± SD) vs. 29 ± 18%, ***P < 0.0001; 36 cells, 109 PA areas, from three RyR2A4860G+/− mice and from 53 cells, 126 PA areas from four WT mice.
The overall fluorescence decay in the PA areas is a direct measure of the rate of loss of mtPA-GFP and gives an indication of the movement of matrix proteins from one set of mitochondria to others. The mtPA-GFP decay is significantly slower in heterozygotes than in WT cells. At 445 s after a 15-s activating pulse (Fig. 7 B and C) the fluorescence has decayed by 12% of the value at photoactivation in heterozygotes compared with 29% in WT.
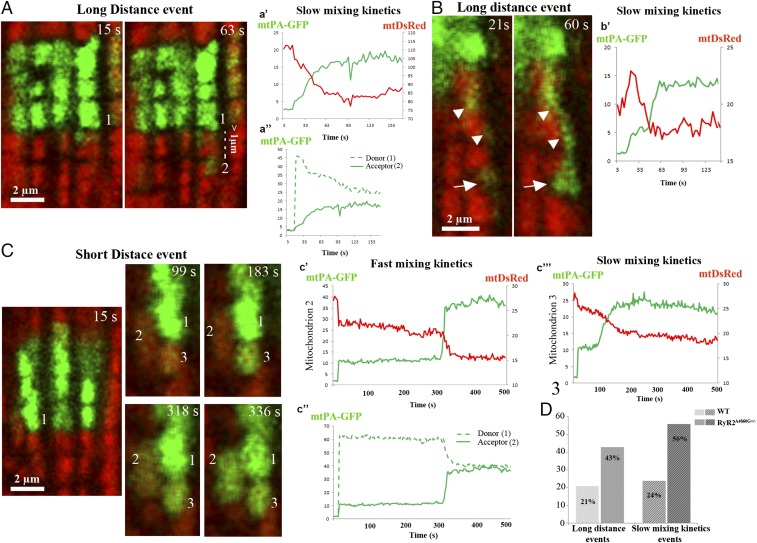
Analysis of individual acceptor organelles outside the PA areas simultaneously detected the time course of two indicators for matrix exchange between organelles: the gain of mtPA-GFP from a donor and the loss of unbleached mtDsRed to the same donor. The time course of the mixing kinetics shows the green fluorescence increasing whereas the red one declines in the acceptor within the same time interval until equilibrium is reached (Fig. 8). To compare dynamic rates and geometric factors, we arbitrarily divided the matrix mixing events into two groups: “slow” events that require >30 s (30–111 s in WT and 30–183 s in mutant) to reach equilibrium and “fast” events that require <30 s (Fig. 8). The percentage of slow events is significantly higher in the mutant than in WT (56% vs. 24%) (Fig. 8D) in good agreement with the slower overall fluorescence decay in RyR2A4860G+/− (Fig. 7C).
Fig. 8.
Long- and short-distance events and mixing kinetics. Representative images and examples of mixing kinetic events in WT selected for their visibility. (A) Long-distance event where an increase in mtPA-GFP intensity is detected at ≥1 µm from the PA area. The #1 mitochondrion, located in the PA area, slowly donates mtPA-GFP fluorescence to the #2 mitochondrion. (a′) Increase in mtPA-GFP fluorescence and decrease in mtDsRed of #2 mitochondrion occur with the same time course. Equilibrium is reached after 45 s. (a′′) The presumed donor, #1 mitochondrion, loses mtPA-GFP fluorescence in parallel to an increase in the acceptor (#2). (B) Rare view of a GFP-labeled nanotunnel (arrowheads) that reaches a mitochondrion over a long (∼6-µm) distance (arrow) (Movie S8). (b′) Fairly slow exchange of mtPA-GFP and mtDsRed (40 s to equilibrium). (C) Two short distance events displaying different mixing kinetics: fast, between mitochondria #1 and #2, and slow, between a not-well-identified mitochondrion in the PA area and #3 (Movie S9). (c′) The fast-mixing kinetics in #2 mitochondrion leads to equilibrium in 18 s; mtPA-GFP and mtDsRed fluorescence are mirror images of each other. (c′′) mtPA-GFP fluorescence in the presumptive donor and acceptor (mitochondria 1 and 2). (c′′′) Slow-mixing kinetics in #3 mitochondrion that leads to equilibrium in 84 s. (D) The percentages of both long-distance and slow-mixing kinetics events are increased in RyR2A4860G+/− vs. in WT. Data are from 82 events, 13 cells, 34 PA areas, and three mice for WT and from 66 events, 14 cells, 38 PA areas, and four mice for RyR2A4860G+/−.
Events also differ in terms of the distance between the edges of the PA areas and the site of appearance of new mtPA-GFP spots presumably representing acceptor mitochondria. Considering that in the electron micrographs the length of mitochondrial nanotunnels averaged between 0.6 µm and 3.6 µm, we decided that a threshold of ≥1 µm is a sufficient distance to indicate a communication requiring the presence of a nanotunnel in events at a “long distance” (Fig. 8 A and B; Movie S8). “Short-distance” events, by contrast, indicate increases in mtPA-GFP intensity at <1 µm in distance from the PA area or a PA neighboring mitochondrion (Fig. 8C; Movie S9). We estimated the frequency of long-distance events in a subset of cells. Long-distance events are significantly more frequent in RyR2A4860G+/− cells than in WT: 43 vs. 21% (Fig. 8D) with a distance range of 1–6 µm. This is in general agreement with the higher frequency of nanotunnels in RyR2A4860G+/− cells.
If communication via nanotunnels affects the rate of fluorescent protein exchange, we should find some relationship between the rate of matrix mixing and the relative positions of donor and acceptor mitochondria. Close to 100% of long-distance events in mutant (27 of 28) and WT (13 of 14) show slow mixing kinetics. Short-distance events have predominantly, although not exclusively, fast kinetics (73 and 76% of total respectively in mutant and WT). Fig. 8 compares examples of two long-distance events, where the transfer of mtPA-GFP is relatively slow (≥40 s to reach the equilibrium in this case), with two short-distance events, where the mixing kinetics are either fast (20 s) or slow (60 s). These data are in agreement with the general slow exchange in long-distance events and the mixed slow/fast exchange in short-distance events. In conclusion, the kinetics of long-distance and short-distance events are essentially similar in WT and mutant, but their frequencies are different, suggesting that the overall slower transmission in the latter is due to the increased frequency of long-distance, slower events.
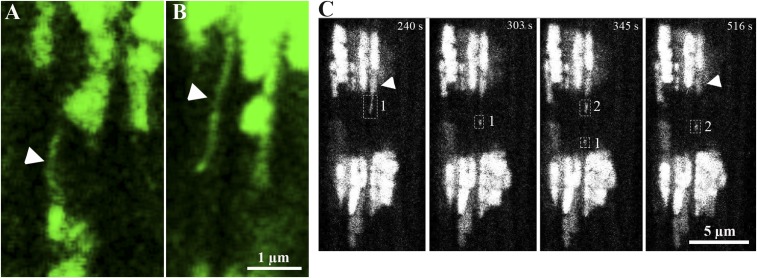
Direct observations of mtPA-GFP movement along nanotunnels were infrequent. A combination of the small size of the nanotunnel and the rapidity of matrix protein movement along it are the probable causes. Figs. 8B and 9 offer rare direct views of nanotunnel activity with the movement of small mtPA-GFP boluses along a single narrow path ∼5 µm long (Fig. 9C; Movie S10).
Fig. 9.
Nanotunnel activities in live cardiomyocytes. (A and B) Representative images of nanotunnels highlighted by their content of mtPA-GFP (arrowheads) in RyR2A4860G+/− (A) and WT (B) cardiomyocytes. (C) Sequential movement of green fluorescence along a nanotunnel extension in a RyR2A4860G+/− cardiomyocyte with parallel loss from a donor (arrowhead) during a 276-s recording. (Left) Initially, a narrow line of fluorescence (rectangle 1) is close to the PA area. After 99 s, the signal has moved away, progressing further to a total distance of ∼5 µm, reaching the second PA area (at 345 s) moving at 48 nm/s, and a new fluorescence (rectangle 2) is released from the donor, and it also moves away from the PA area (at 516 s) (Movie S10).
To investigate the cause of the slow rate of matrix mixing between mitochondria located at longer distances from each other, the rate of matrix flow along nanotunnels needs to be considered. The ratio between the time of the first appearance of green fluorescence in a distant mitochondrion acceptor and its distance from the PA area is quite variable, indicating a possible rate of flow between 4 nm/s and 121 nm/s (mean 43 nm/s ± 34 nm/s). Thus, the influence on mitochondrial mixing rates by the rate of diffusion along the nanotunnels is quite variable and may not be the limiting factor.
A final observation is that during imaging of >200 PA areas for 500 s each, no migration of mitochondria was detected. Each mitochondrion has a well-visible imprint in the confocal images once its mtPA-GFP is activated. Migration of an entire mitochondrion from the activated area would leave behind a notable local dip in fluorescence and would appear as a large positive spot elsewhere. This clearly demonstrates the basic stability of the mitochondrial positioning between the myofibrils.
Discussion
The unexpected effect of the RyR2A4860G mutation on mitochondrial morphology and kinetics provides an approach for the differentiation of two modalities of intermitochondrial matrix exchanges: (i) at direct large contact sites and (ii) via narrow nanotunnels between distant organelles (12), both occurring without movement of the individual organelles. The static EM images indicate an apparent and intense activation of nanotunneling activity in the mutant that is surprisingly linked to depression rather than enhancement of intermitochondrial matrix exchange rates: in mutant cells the overall frequency of exchange events is slightly reduced, and the relative incidence of long-distance, intrinsically slower events is higher. The combination of the two factors may be at the basis of the slower overall rate of matrix exchange. However, it cannot be excluded that the mutation causes a primary functional defect in the mixing. This work establishes a well-defined level of mitochondrial behavior in normal myocardium that can be used as a platform for comparison of altered behavior in this mutation as well as in other cardiac pathologies.
In both WT and mutant cells, exchange events occur at a relatively low frequency in comparison with the frequency of sites at which mitochondria are closely apposed to each other at kissing junctions and/or presumably at the end of nanotunnel extensions. Therefore, the initiation of an event must involve some stochastic transition in the relationship between the two interacting mitochondria. One possibility (11) is that an exchange is initiated by an actual fusion event that permits direct mixing of matrices. A second possibility (12) is that the membranes at kissing junctions become permissive to direct movements of proteins from one organelle to the other. Both hypotheses have some intrinsic weaknesses. In the case of fusion, the problem is that the matrix exchange is relatively slow, even considering the possible negative effect of matrix space complexity. In the case of kissing junctions, a yet-unexplored mechanism by which opening of pores in both outer and inner membranes is coordinated, must be provided.
Regardless of the mechanism by which communication is established (either fusion or gating of kissing junctions) the difference in the rate of exchange between long-distance events involving nanotunnels and those at close range involving contacts between the main body of mitochondria is most likely to be related to differences in their geometry. In 3D reconstructions, nanotunnels, even where crowded in a small space, do not seem to make frequent contacts with each other and with large mitochondria. This may indicate that the sites of communication are near the nanotunnel tips. The orientation of cristae and matrix spaces seem to facilitate flow along the length of the nanotunnels, but given the small diameter, the area of contact at the tips is quite limited, thus providing a restriction for matrix flow. Cell-to-cell communication via long narrow extensions are not unique to cardiac mitochondria. Free bacteria also communicate via short connecting tunnels (25) and so do higher cells (26), although in the latter case the communication may be restricted to the ferrying of organelles.
One interesting question is whether exchanges via nanotunnels depend on the availability of preformed elongated paths or whether nanotunnels develop in the process of an exchange event. The high frequency of nanotunnels in mutant myocytes may favor the former hypothesis, but unfortunately live images cannot solve the question because a nanotunnel is visible only when filled with activated mtPA-GFP. Regardless of the moment of formation, it is likely that nanotunnels are generated by an active pull of the mitochondria along microtubules. The frequent nanotunnel–microtubule appositions and the orientation of cristae is just what one would expect from such a mechanism. Incidentally, this possible mechanism of nanotunnel generation implies a mechanical anchorage of mitochondria (via tethers) that lets them resist the pull, consistent with lack of evidence for mitochondrial migrations in live images.
Short- and long-distance matrix exchanges between cardiac mitochondria allow the necessary communication without need of disrupting the original position of the organelles. In skeletal muscle of some species, the dichotomy between a large mitochondrion body and long, thin extensions is not as marked as in cardiac muscle because the whole mitochondrion is thin and elongated (27). It is not known how actively these mitochondria expand/retract along the narrow spaces available, but clearly they maintain a specific relationship to the triads.
The frequencies of small mitochondrial profiles and nanotunnels are higher by a factor of ∼1.5 and ∼3, respectively, in mutant vs. WT myocytes. The EM data illustrate that each nanotunnel and/or shorter mitochondrial extension contribute to several apparently separate small profiles in thin sections. If each of the additional nanotunnels in mutant myocytes happened to be transected by the section at one to two sites, that in itself would explain the increased frequency of small profiles following the RyR2 mutation. Thus, although some fission activity may occur in mutant cells, this is probably not a common event. By contrast, in a separate RyR2 mutation that results in gain of RyR2 release function and eventually in heart failure (28), we observed very extensive fragmentation of mitochondria and no nanotunneling. Therefore, nanotunneling is not a necessary prelude to fragmentation. In nonmuscle cells, fusion/fission events are coupled to large mitochondrial migrations (2). The indication from this study is that cardiac mitochondria do not need to migrate to communicate with each other and that mitochondria apparently maintain their original position despite the large Ca2+ imbalances. This is somewhat surprising in view of the fact that, in nonmuscle cells, large mitochondrial movements and/or fission occur under other related conditions. However, even within striated muscles, mitochondria are not necessarily permanently immobilized. Dispositions of mitochondria are highly variable when one considers examples from a variety of vertebrates (29); their positioning is developmentally regulated (5), and they may acquire freedom of movement under certain pathological conditions (28, 30, 31).
The relationship between the altered Ca2+ homeostasis due to the RyR2 A4860G+/− mutation, and the induction of nanotunneling is not clear, unless it is mediated by an increase in activity of transport along microtubules, which may be affected by Ca2+.
Materials and Methods
Experimental Animals.
The RyR2A4860G+/− mouse was generated and maintained as previously described (1). All procedures were approved by the Thomas Jefferson University Committee on Animal Care.
Two-Dimensional Electron Microscopy.
Heterozygous and WT hearts of 7-mo-old mice were perfused and fixed with 6% (vol/vol) glutaraldehyde in 0.1 M sodium cacodylate buffer (pH 7.4) and kept at 4 °C, and small bundles of ventricular-wall muscles were processed for standard thin-section EM (28). Fiji program (NIH) was used for morphometric analysis of randomly collected images. Cross-sections (magnification: 19,300×) and longitudinal sections (magnification: 26,300×) were used to measure areas of mitochondrial profiles and to count the frequency of nanotunnels.
Electron Tomography and 3D Reconstruction.
Previously fixed (see above) small cardiac bundles were rapidly frozen using a high-pressure freezing system (HPM 010), freely substituted in 100% acetone and 0.1% uranyl acetate, and embedded at −50 °C in lowicryl (HM-20). Resin was polymerized with 348 nm of light for 48 h at low temperatures and for 48 h at 25 °C. The surfaces of thick sections (0.4 µm) were labeled with ∼15-nm gold particles. Tilt series were collected at 200 keV of accelerating voltage using a FEI Tecnai F20 transmission electron microscope reaching maximum negative and positive tilts of 68°. Images in STEM mode were captured using a Fischione HAAD camera. A total of 264 and 112 images were used for high-magnification (28,000×) and low-magnification (14,000×) tomograms using IMOD (version 4.7). Videos were created by using a series of snapshots made in IMOD and importing those images into the movie-making software, Videomach (from www.gromada.com/main/products.php). Surface segmentation of the organelles was obtained by outlining the profile in AMIRA 5.6 3D software (FEI). The volumes were reconstructed using direct volume rendering of 3D images with shadings (Volren).
Adenovirus Infection and Cardiomyocytes Isolation.
Hearts of 7- to 8-mo-old mice were infected with adenovirus carrying mtDsRed and mtPA-GFP cDNA by four to five intramyocardiac injections of 5 × 10⁸ pfu of adenovirus in total volumes of 20 μL. After 7 d, hearts were subjected to enzymatic perfusion to isolate adult cardiomyocytes. Cells were plated and incubated for 1–2 h in plating medium [MEM, 10% calf serum, 100 U/mL penicillin, 2 mM ATP, 2 mM glutamine, 10 mM 2,3 butanedione monoxime (BDM)] followed by culture medium, MEM, 0.1% BSA, 100 U/mL penicillin, 2 mM glutamine, 10 mM BDM, 5 µg/mL insulin, 5 µg/mL transferrin, 5 ng/mL selenium, all at 37 °C and 2% CO2.
Live Confocal Microscopy.
The live-imaging approach follows seminal experimental guidelines developed and implemented by Veronica Eisner (Department de Biología Celular y Molecular, Facultad de Ciencias Biológicas, Pontificia Universidad Católica de Chile) (32). Imaging of isolated cells was performed within 12 h after cardiomyocyte isolation in 0.25% BSA with the addition of 10 mM BDM to inhibit contraction using a laser-scanning microscope (LSM 780, Carl Zeiss), exciting 488 nm (mtPA-GFP) and 568 nm (mtDsRed) with 63×/1.4 N.A. Apoplan oil objective. To photoactivate mtPA-GFP and photobleach mtDsRed, a pulsed laser beam (760 nm, Chameleon; Coherent) was applied within two to five selected square areas (25 µm2) in two-photon mode. Fluorescence of activated mtPA-GFP and of mtDsRed was recorded for ∼500 s (165 cycles of 3 s).
Live-Imaging Analysis.
We analyzed the time dependence of mtPA-GFP fluorescence decay within each square by determining the ratio of mtPA-GFP/mtDsRed fluorescence levels at each successive 3-s time point and normalizing it to the value at the time of photoactivation. Spectralyzer software (customer designed) was used to analyze the green and red intensity levels for individual sites where spread of activated PA-GFP outside the square was detected. The resulting graphs were used to define the rate of reciprocal exchange at each separate event. The position of each individual event (near or far) from the nearest possible site of origin was determined and compared with the rate of exchange.
Statistics.
All data are expressed as mean ± SD. Significace was calculated by Student’s t test.
Supplementary Material
Acknowledgments
We thank Dr. Veronica Eisner for suggestions and practical advice in the live experiment studies, David Weaver for help in some experimental setup, and Marina Scardigli for substantial help in the 3D reconstructions. Supported by NIH Grant 2P01 AR 052354-06A1 (to P. D. Allen) (C.F.-A., Core Leader) and Grant R01 DK051526 (to G.H.).
Footnotes
The authors declare no conflict of interest.
This article contains supporting information online at www.pnas.org/lookup/suppl/doi:10.1073/pnas.1617788113/-/DCSupplemental.
References
- 1.Benard G, et al. Mitochondrial bioenergetics and structural network organization. J Cell Sci. 2007;120(Pt 5):838–848. doi: 10.1242/jcs.03381. [DOI] [PubMed] [Google Scholar]
- 2.Liu X, Weaver D, Shirihai O, Hajnóczky G. Mitochondrial ‘kiss-and-run’: Interplay between mitochondrial motility and fusion-fission dynamics. EMBO J. 2009;28(20):3074–3089. doi: 10.1038/emboj.2009.255. [DOI] [PMC free article] [PubMed] [Google Scholar]
- 3.Wang C, et al. Dynamic tubulation of mitochondria drives mitochondrial network formation. Cell Res. 2015;25(10):1108–1120. doi: 10.1038/cr.2015.89. [DOI] [PMC free article] [PubMed] [Google Scholar]
- 4.Glancy B, et al. Mitochondrial reticulum for cellular energy distribution in muscle. Nature. 2015;523(7562):617–620. doi: 10.1038/nature14614. [DOI] [PMC free article] [PubMed] [Google Scholar]
- 5.Boncompagni S, et al. Mitochondria are linked to calcium stores in striated muscle by developmentally regulated tethering structures. Mol Biol Cell. 2009;20(3):1058–1067. doi: 10.1091/mbc.E08-07-0783. [DOI] [PMC free article] [PubMed] [Google Scholar]
- 6.Ainbinder A, Boncompagni S, Protasi F, Dirksen RT. Role of Mitofusin-2 in mitochondrial localization and calcium uptake in skeletal muscle. Cell Calcium. 2015;57(1):14–24. doi: 10.1016/j.ceca.2014.11.002. [DOI] [PMC free article] [PubMed] [Google Scholar]
- 7.Rossi AE, Boncompagni S, Wei L, Protasi F, Dirksen RT. Differential impact of mitochondrial positioning on mitochondrial Ca(2+) uptake and Ca(2+) spark suppression in skeletal muscle. Am J Physiol Cell Physiol. 2011;301(5):C1128–C1139. doi: 10.1152/ajpcell.00194.2011. [DOI] [PMC free article] [PubMed] [Google Scholar]
- 8.Konstantinidis K, Lederer WJ, Rizzuto R, Kitsis RN. Mitofusin 2 joins the sarcoplasmic reticulum and mitochondria at the hip to sustain cardiac energetics. Circ Res. 2012;111(7):821–823. doi: 10.1161/CIRCRESAHA.112.277269. [DOI] [PMC free article] [PubMed] [Google Scholar]
- 9.Friedman JR, Nunnari J. Mitochondrial form and function. Nature. 2014;505(7483):335–343. doi: 10.1038/nature12985. [DOI] [PMC free article] [PubMed] [Google Scholar]
- 10.Shirihai OS, Song M, Dorn GW., II How mitochondrial dynamism orchestrates mitophagy. Circ Res. 2015;116(11):1835–1849. doi: 10.1161/CIRCRESAHA.116.306374. [DOI] [PMC free article] [PubMed] [Google Scholar]
- 11.Eisner V, Lenaer G, Hajnóczky G. Mitochondrial fusion is frequent in skeletal muscle and supports excitation–contraction coupling. J Cell Biol. 2014;205(2):179–195. doi: 10.1083/jcb.201312066. [DOI] [PMC free article] [PubMed] [Google Scholar]
- 12.Huang X, et al. Kissing and nanotunneling mediate intermitochondrial communication in the heart. Proc Natl Acad Sci USA. 2013;110(8):2846–2851. doi: 10.1073/pnas.1300741110. [DOI] [PMC free article] [PubMed] [Google Scholar]
- 13.Picard M, et al. Trans-mitochondrial coordination of cristae at regulated membrane junctions. Nat Commun. 2015;6:6259. doi: 10.1038/ncomms7259. [DOI] [PMC free article] [PubMed] [Google Scholar]
- 14.Dedkova EN, Blatter LA. Calcium signaling in cardiac mitochondria. J Mol Cell Cardiol. 2013;58:125–133. doi: 10.1016/j.yjmcc.2012.12.021. [DOI] [PMC free article] [PubMed] [Google Scholar]
- 15.Frank S, et al. The role of dynamin-related protein 1, a mediator of mitochondrial fission, in apoptosis. Dev Cell. 2001;1(4):515–525. doi: 10.1016/s1534-5807(01)00055-7. [DOI] [PubMed] [Google Scholar]
- 16.Cereghetti GM, et al. Dephosphorylation by calcineurin regulates translocation of Drp1 to mitochondria. Proc Natl Acad Sci USA. 2008;105(41):15803–15808. doi: 10.1073/pnas.0808249105. [DOI] [PMC free article] [PubMed] [Google Scholar]
- 17.Macaskill AF, et al. Miro1 is a calcium sensor for glutamate receptor-dependent localization of mitochondria at synapses. Neuron. 2009;61(4):541–555. doi: 10.1016/j.neuron.2009.01.030. [DOI] [PMC free article] [PubMed] [Google Scholar]
- 18.Saotome M, et al. Bidirectional Ca2+-dependent control of mitochondrial dynamics by the Miro GTPase. Proc Natl Acad Sci USA. 2008;105(52):20728–20733. doi: 10.1073/pnas.0808953105. [DOI] [PMC free article] [PubMed] [Google Scholar]
- 19.Wang X, Schwarz TL. The mechanism of Ca2+ -dependent regulation of kinesin-mediated mitochondrial motility. Cell. 2009;136(1):163–174. doi: 10.1016/j.cell.2008.11.046. [DOI] [PMC free article] [PubMed] [Google Scholar]
- 20.Sharma VK, Ramesh V, Franzini-Armstrong C, Sheu S-S. Transport of Ca2+ from sarcoplasmic reticulum to mitochondria in rat ventricular myocytes. J Bioenerg Biomembr. 2000;32(1):97–104. doi: 10.1023/a:1005520714221. [DOI] [PubMed] [Google Scholar]
- 21.Eisner V, Csordás G, Hajnóczky G. Interactions between sarco-endoplasmic reticulum and mitochondria in cardiac and skeletal muscle: Pivotal roles in Ca²⁺ and reactive oxygen species signaling. J Cell Sci. 2013;126(Pt 14):2965–2978. doi: 10.1242/jcs.093609. [DOI] [PMC free article] [PubMed] [Google Scholar]
- 22.Boncompagni S, et al. Characterization and temporal development of cores in a mouse model of malignant hyperthermia. Proc Natl Acad Sci USA. 2009;106(51):21996–22001. doi: 10.1073/pnas.0911496106. [DOI] [PMC free article] [PubMed] [Google Scholar]
- 23.Durham WJ, et al. RyR1 S-nitrosylation underlies environmental heat stroke and sudden death in Y522S RyR1 knockin mice. Cell. 2008;133(1):53–65. doi: 10.1016/j.cell.2008.02.042. [DOI] [PMC free article] [PubMed] [Google Scholar]
- 24.Zhao Y-T, et al. Arrhythmogenesis in a catecholaminergic polymorphic ventricular tachycardia mutation that depresses ryanodine receptor function. Proc Natl Acad Sci USA. 2015;112(13):E1669–E1677. doi: 10.1073/pnas.1419795112. [DOI] [PMC free article] [PubMed] [Google Scholar]
- 25.Dubey GP, Ben-Yehuda S. Intercellular nanotubes mediate bacterial communication. Cell. 2011;144(4):590–600. doi: 10.1016/j.cell.2011.01.015. [DOI] [PubMed] [Google Scholar]
- 26.Rustom A, Saffrich R, Markovic I, Walther P, Gerdes HH. Nanotubular highways for intercellular organelle transport. Science. 2004;303(5660):1007–1010. doi: 10.1126/science.1093133. [DOI] [PubMed] [Google Scholar]
- 27.Franzini-Armstrong C. ER-mitochondria communication. How privileged? Physiology (Bethesda) 2007;22:261–268. doi: 10.1152/physiol.00017.2007. [DOI] [PubMed] [Google Scholar]
- 28.Lavorato M, et al. Dyad content is reduced in cardiac myocytes of mice with impaired calmodulin regulation of RyR2. J Muscle Res Cell Motil. 2015;36(2):205–214. doi: 10.1007/s10974-015-9405-5. [DOI] [PubMed] [Google Scholar]
- 29.Franzini-Armstrong C, Boncompagni S. The evolution of the mitochondria-to-calcium release units relationship in vertebrate skeletal muscles. J Biomed Biotechnol. 2011;2011:830573. doi: 10.1155/2011/830573. [DOI] [PMC free article] [PubMed] [Google Scholar]
- 30.Yuen B, et al. Mice expressing T4826I-RYR1 are viable but exhibit sex- and genotype-dependent susceptibility to malignant hyperthermia and muscle damage. FASEB J. 2012;26(3):1311–1322. doi: 10.1096/fj.11-197582. [DOI] [PMC free article] [PubMed] [Google Scholar]
- 31.Dorn GW., II Mitochondrial dynamics in heart disease. Biochim Biophys Acta. 2013;1833(1):233–241. doi: 10.1016/j.bbamcr.2012.03.008. [DOI] [PMC free article] [PubMed] [Google Scholar]
- 32.Eisner V. Mitochondrial fusion dynamics is robust in the heart and depends on calcium oscillations and contractile activity. Proc Natl Acad Sci USA. 2017;114:E859–E868. doi: 10.1073/pnas.1617288114. [DOI] [PMC free article] [PubMed] [Google Scholar]
Associated Data
This section collects any data citations, data availability statements, or supplementary materials included in this article.


