Significance
In vertebrates, proper patterning during appendage regeneration is regulated by positional memory—a cellular property hypothesized to rely on gradients of molecules present in uninjured limbs. Only one gene, exclusive to salamanders, has been shown to regulate positional memory and be expressed in a gradient in the uninjured limb. To identify new candidate effectors of positional memory, we mapped the abundance of RNAs, proteins, and metabolites along the uninjured zebrafish tail fin. We identified hundreds of molecular gradients and generated a high-confidence list of 32 genes and 42 metabolites that are candidate effectors of positional memory in zebrafish. Furthermore, expression patterns discovered here may help to explain how size-homeostasis and patterning are maintained in a complex adult tissue.
Keywords: regeneration, positional memory, growth control, zebrafish, caudal fin
Abstract
Regeneration requires cells to regulate proliferation and patterning according to their spatial position. Positional memory is a property that enables regenerating cells to recall spatial information from the uninjured tissue. Positional memory is hypothesized to rely on gradients of molecules, few of which have been identified. Here, we quantified the global abundance of transcripts, proteins, and metabolites along the proximodistal axis of caudal fins of uninjured and regenerating adult zebrafish. Using this approach, we uncovered complex overlapping expression patterns for hundreds of molecules involved in diverse cellular functions, including development, bioelectric signaling, and amino acid and lipid metabolism. Moreover, 32 genes differentially expressed at the RNA level had concomitant differential expression of the encoded proteins. Thus, the identification of proximodistal differences in levels of RNAs, proteins, and metabolites will facilitate future functional studies of positional memory during appendage regeneration.
Adult members of several species of fish and salamanders can regenerate properly patterned appendages after injury. Patterning during regeneration is regulated by positional memory, a cellular property that enables wounded tissue to recall its former location in the uninjured appendage and accordingly influence proliferation and patterning during outgrowth (1).
Positional memory imparts two key properties on regenerating tissue (2–5). First, amputations proximal to the body result in faster regrowth than distal amputations. Second, new tissue is patterned such that only structures distal to the injury site are regenerated. Thus, only structures lost because of injury are regrown. Although considerable research has focused on understanding how regeneration is initiated in different organisms (6–11), and computational models have predicted how positional information can regulate regenerative outgrowth (12, 13), much less is known about the cellular mechanisms underlying positional memory (2–5, 14).
Positional memory is proposed to be established by molecules that exist in a gradient in uninjured appendages (15–18). These gradients are interpreted by the masses of mesenchymal stem cells (blastemas) that form at the distal tip of amputated appendages. Blastemas use this positional information to subsequently grow, differentiate, and pattern into the fully formed appendage.
The transmembrane receptor Prod1 is the only bona fide effector of positional memory. Prod1 is expressed in a proximally enriched gradient in salamander limbs, and experimental manipulation of Prod1 expression alters proximodistal-dependent behaviors in blastema confrontation assays in vitro (19, 20). Also, overexpression of Prod1 in blastema cells that are fated to migrate distally enables migration into proximal structures (21). However, homologs of Prod1 have yet to be identified outside of salamanders (22), suggesting that this mechanism of positional memory may not be conserved among species.
In addition to Prod1, the small molecule retinoic acid (RA) was also reported as an effector of positional memory in amphibian limbs (23–26). Hyperactivation of RA signaling results in duplication of structures proximal to the amputation plane in regenerating amphibian limbs (23–26). This result suggests that RA can alter the positional memory of regenerating cells to a more proximal state, i.e., “proximalize” regenerating tissue. The ability of RA to proximalize regenerating tissue is due, at least in part, to increased expression of the transcription factors Meis1 and Meis2 (27). Interestingly, Meis1 and Meis2 directly bind the Prod1 promoter and activate transcription (28).
RA may also play a role in positional memory in zebrafish. Fish treated with exogenous RA during fin regeneration suffer dramatic bone patterning defects, but not an overall change in fin size (29, 30). However, these patterning defects may be due to RA-induced proximalization of regenerating tissue or to the role of RA signaling in the differentiation of preosteoblasts (31). In addition, it is unclear how RA signaling would set up a pattern of positional memory before injury because no gradient of endogenous RA signaling has been demonstrated in intact salamander limbs or zebrafish fins.
Despite these data on Prod1 and RA, there have been no reports of molecules that regulate positional memory, have patterned expression in uninjured appendages, and are conserved among species. The prevailing hypothesis of the mechanisms of positional memory predicts that gradients of molecules exist in uninjured appendages. Thus, we measured the global abundances of RNAs, proteins, and metabolites along the proximodistal axis of caudal fins in adult zebrafish, identifying numerous differentially patterned molecules. This information provides a rich resource for the field of regenerative biology.
Results
Mapping Positional Information Along the Proximodistal Axis of the Caudal Fin.
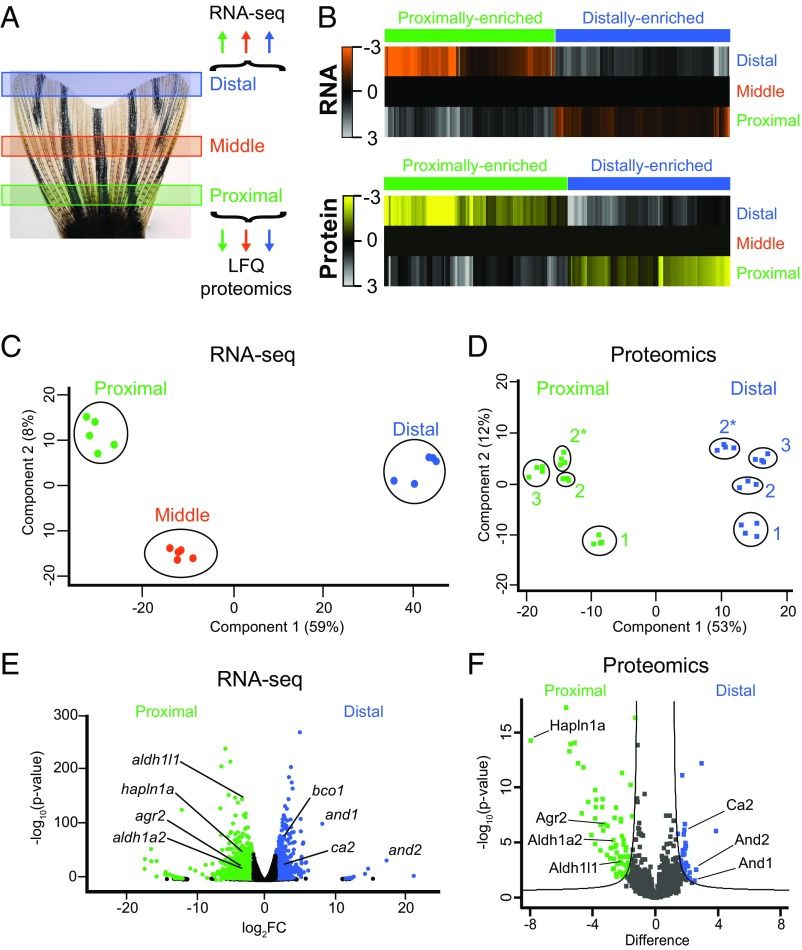
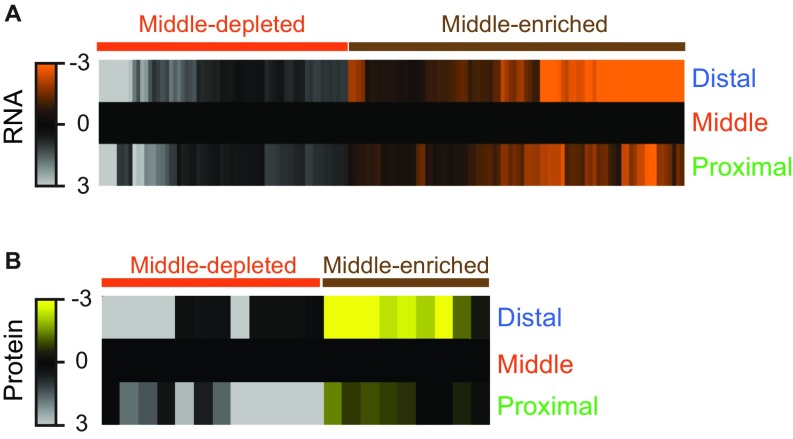
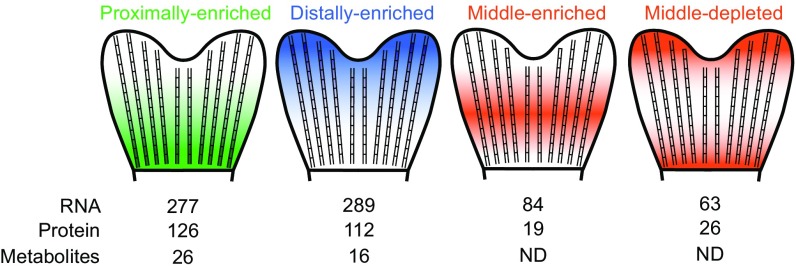
We and others (15, 17, 18) hypothesized that molecular effectors of positional memory are expressed in gradients along the proximodistal axis of uninjured appendages. To identify candidate molecules that might be involved in this process, we performed RNA sequencing (RNA-seq) and label-free quantification (LFQ) proteomics on proximal, middle, and distal regions of uninjured zebrafish caudal fins (Fig. 1A and Fig. S1). We quantified 23,926 RNAs and 3,061 proteins (Datasets S1–S12 and Datasets S13–S25, respectively). These screens identified 566 transcripts and 238 proteins that were present in proximally enriched or distally enriched gradients (Fig. 1B and Datasets S5 and S21). Here, we define gradients broadly as a unidirectional increase or decrease in gene expression across the proximal, middle, and distal regions, regardless of the overall differences in abundance among neighboring regions. This definition includes patterns such as linear and exponential gradients. Notably, we also discovered middle-enriched and middle-depleted expression patterns, compared with the proximal and distal regions (Fig. S2 and Datasets S6 and S21). Principal component analysis (PCA) showed large variations in transcript (Fig. 1C) and protein (Fig. 1D) abundance between proximal and distal regions of the fin. Transcripts in the middle region clustered as a distinct group, but were more similar to the proximal than distal region (Fig. 1C). The largest variation in differentially abundant molecules occurred between the proximal and distal regions, including 1,424 transcripts and 113 proteins (Fig. 1 E and F and Datasets S4 and S20). Thus, genomic expression quantitatively differs throughout the proximodistal axis of the caudal fin.
Fig. 1.
Transcriptomic and proteomic mapping of positional information in uninjured caudal fins. (A) Illustration of the three regions of the fin that were harvested for RNA-seq or LFQ proteomics (see also Fig. S1). (B) Heat maps of 566 transcripts or 238 proteins with proximally enriched (green) or distally enriched (blue) gradients. Each transcript was differentially expressed (FDR < 1%) between each region, and in the same direction across regions. The transcript values shown are the average RPM from all biological replicates, normalized to the middle region, and then log2 transformed. The average protein abundance from all technical replicates is shown as log2 abundance normalized to the middle region. All protein values for the heat map are derived from experiment 3 only (Fig. S1). Each protein was differentially expressed (FDR < 5%) between proximal and distal regions (see Dataset S21 description for more details). (C and D) PCA for RNA-seq (C) or proteomics (D) data. In C, the points represent biological replicates. In D, the points represent technical replicates from different experiments (indicated by numbers 1, 2, and 3). Experiments 2 and 2* are samples from the same group of fish analyzed on different mass spectrometers. (E and F) Volcano plots showing the relative abundances of transcripts (E) or proteins (F). Transcripts were considered differentially expressed at FDR < 1% and fold change > 3 between proximal and distal regions, whereas proteins were considered differentially expressed at FDR < 5%. Selected transcripts and proteins are highlighted with the gene or protein name.
Fig. S1.
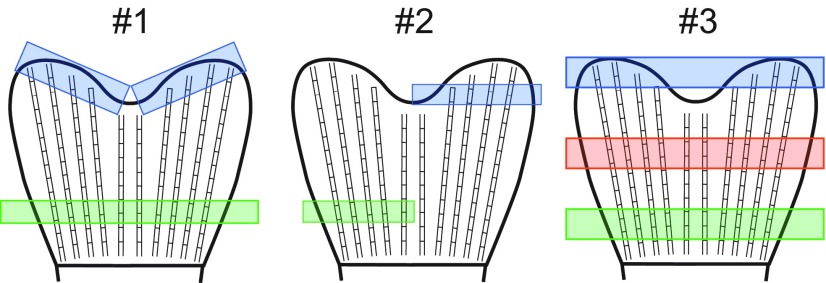
Illustrations showing regions harvested for the proximodistal proteomics screens. Proximal (green) and distal (blue) regions were collected from three separate biological experiments. Experiment 1 regions were pooled from eight fish, whereas experiments 2 and 3 were pooled from 20 fish each. The middle (orange) region was only collected during experiment 3 from 20 pooled fish.
Fig. S2.
Middle-enriched and middle-depleted gradients were also identified by RNA-seq and LFQ proteomics. (A and B) Heat maps of 147 transcripts (A) or 45 proteins (B) with middle-depleted (red) or middle-enriched (brown) gradients. In A, transcript values shown are RPM normalized to middle and then log2 transformed. Each transcript was differentially expressed (FDR < 1%) between proximal and middle regions and also between middle and distal regions. In B, the average protein abundance from all technical replicates is shown as log2 abundance normalized to the middle region. All protein values for the heat map are derived from experiment 3 only (Fig. S1). Each protein was differentially expressed (FDR < 5%) between proximal and distal regions (see Dataset S21 description for more details).
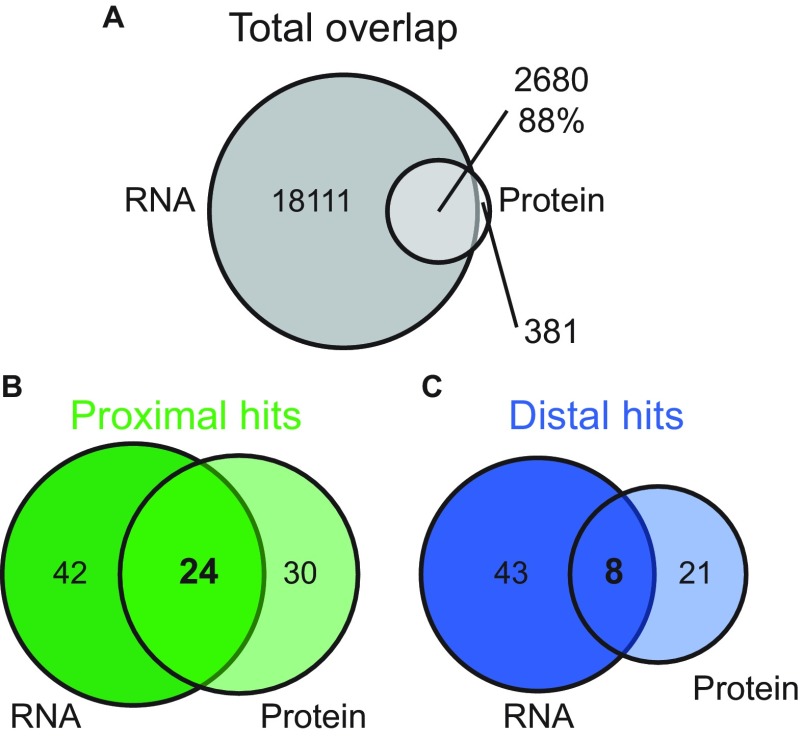
To generate a high confidence list of molecules whose levels differ along the proximodistal axis, we compared the proximal and distal RNA-seq and LFQ proteomics datasets. We restricted our analysis to transcripts and proteins present in similar patterns in both datasets. The RNA-seq screen was more comprehensive and quantified 88% of the proteins quantified by LFQ proteomics. Conversely, LFQ proteomics only quantified 13% of the transcripts quantified in the RNA-seq data (Fig. S3A). Among the proteins and transcripts measured in both experiments, 54 proteins and 66 transcripts were proximally enriched, and 29 proteins and 51 transcripts were distally enriched (Fig. S3 B and C). In both the proximal and distal regions, fewer than 50% of the differentially expressed transcripts were found to have similar differentially expressed proteins. This observation is consistent with the reported degree of overlap for RNA and protein abundance comparisons in other systems (32–36) and suggests a high degree of posttranscriptional regulation in these regions of the caudal fin. The overlap between these lists yielded a high confidence list of 32 molecules that had statistically significant differences in RNA and protein abundances between proximal and distal regions of the fin (Fig. S3 B and C and Table 1). Of these 32 hits, 21 were present in a gradient across proximal, middle, and distal regions at the RNA level (Fig. 1B and Table 1).
Fig. S3.
Comparison between proximal and distal RNA-seq and LFQ proteomics reveals extensive posttranscriptional regulation. (A) RNA-seq identified and quantified 20,791 transcripts, whereas LFQ proteomics identified and quantified 3,061 proteins. There were 2,680 genes measured by both screens. (B and C) Comparing the proximal and distal differentially expressed transcripts and proteins, restricted to the 2,680 commonly measured by both screens, we found 24 genes were proximally enriched for both mRNA and protein (B) and 8 genes were distally enriched for both mRNA and protein (C). In both the proximal and distal regions, fewer than 50% of the differentially expressed transcripts were found to have similar differentially expressed protein.
Table 1.
Top hits common to RNA-seq and LFQ proteomics
| Gene | log2FC RNA | P value RNA | log2FC protein | P value protein |
| Proximally enriched | ||||
| agr2 | 3.841 | 2.88e−25 | 3.229 | 2.27e−07 |
| aldh1a2* | 2.954 | 6.07e−19 | 2.683 | 6.15e−06 |
| aldh1l1* | 3.209 | 1.56e−148 | 2.232 | 5.13e−04 |
| bgnb* | 2.128 | 2.83e−28 | 2.698 | 2.50e−03 |
| bhmt* | 1.927 | 4.96e−66 | 2.596 | 5.54e−08 |
| c4* | 3.531 | 9.67e−29 | 1.122 | 2.27e−02 |
| capn12* | 2.712 | 9.97e−116 | 5.402 | 1.09e−14 |
| fabp1b.2 | 10.572 | 8.32e−22 | 1.517 | 8.42e−02 |
| fgfbp2a* | 2.355 | 3.90e−40 | 3.831 | 6.75e−08 |
| gyg1b* | 3.981 | 3.56e−68 | 2.876 | 2.73e−04 |
| hapln1a* | 3.557 | 2.45e−55 | 7.948 | 5.33e−15 |
| hgd* | 1.852 | 6.21e−60 | 3.399 | 5.77e−09 |
| hsd17b7 | 2.304 | 2.28e−17 | 2.840 | 3.03e−05 |
| mbpa* | 2.480 | 1.72e−67 | 2.501 | 7.02e−03 |
| muc5.2* | 6.864 | 0 | 5.482 | 5.44e−14 |
| myh11b | 3.485 | 1.00e−4 | 2.127 | 2.47e−06 |
| paplnb | 7.086 | 2.42e−07 | 2.475 | 1.15e−02 |
| ppp1r1c* | 3.477 | 9.60e−53 | 1.738 | 3.96e−03 |
| si:dkey-65b12.6* | 6.237 | 0 | 4.092 | 1.93e−06 |
| si:dkeyp-93a5.3 | 4.302 | 5.74e−4 | 1.664 | 1.73e−04 |
| vcanb* | 2.194 | 2.48e−23 | 3.772 | 1.29e−09 |
| vim* | 1.722 | 1.75e−21 | 1.910 | 1.05e−03 |
| zgc:136930 | 2.127 | 1.76e−21 | 2.635 | 3.04e−04 |
| zgc:172244 | 7.378 | 9.32e−12 | 5.125 | 8.44e−15 |
| Distally enriched | ||||
| and1 | 8.188 | 9.01e−104 | 2.511 | 2.75e−02 |
| and2 | 17.327 | 2.25e−36 | 2.617 | 2.82e−03 |
| anxa1c* | 1.743 | 4.36e−56 | 1.700 | 7.49e−12 |
| bco1* | 2.759 | 1.68e−80 | 1.644 | 1.00e−02 |
| ca2* | 1.922 | 2.51e−31 | 1.849 | 7.28e−07 |
| krt93* | 4.738 | 2.25e−23 | 3.868 | 8.93e−07 |
| krt94 | 3.533 | 2.00e−42 | 2.940 | 6.59e−13 |
| tgfbi* | 2.720 | 3.49e−119 | 2.097 | 1.47e−03 |
Indicates genes present in a gradient across proximal, middle, and distal regions at the RNA level, as shown in Fig. 1B.
Bioinformatic Characterization of Molecules Identified by RNA-seq and LFQ Proteomics.
RA signaling and Prod1 are thought to be involved in establishing positional memory. We identified transcripts and proteins related to RA and Prod1 among the high-confidence list of candidate effectors in zebrafish caudal fins. The mRNA and protein for aldh1a2 (also known as raldh2), which encodes the rate-limiting enzyme in RA production (37), were expressed in proximally enriched gradients (Fig. 1 E and F and Table 1). In contrast, the mRNA and protein for bco1, which encodes an enzyme that converts vitamin A to retinal, the substrate of Aldh1a2 (38), were distally enriched (Fig. 1 E and F and Table 1), suggesting complex regulation of RA metabolism and signaling. Several other members of the RA pathway also showed evidence of differential expression but did not meet our selection criteria (Dataset S10). These patterns suggest that the regulation of RA signaling may be even more complex involving differential regulation at multiple levels of the pathway. In addition, the mRNA and protein for agr2, which encodes the putative ligand for the transmembrane protein Prod1 (39), were expressed in proximally enriched gradients (Fig. 1 E and F and Table 1).
Additional transcripts and proteins present in our high-confidence list have roles in development and fin size homeostasis that are consistent with roles in positional memory. Caudal fins continue to grow throughout the life of zebrafish and new skeletal ray segments arise at the distal tip of the fin rays around unmineralized actinotrichia fibrils (40, 41). The genes actinodin 1 (and1) and actinodin 2 (and2) encode proteins involved in the development and regeneration of actinotrichia (42, 43). Both and1 and and2 were among the 15 candidates with the largest enrichment in the distal region compared with the proximal region of the fin in both the mRNA and protein analyses (Fig. 1 E and F and Table 1). Likewise, the mRNA and protein for hapln1a were proximally enriched in zebrafish caudal fins (Fig. 1 E and F and Table 1). hapln1a encodes an extracellular matrix protein that functions downstream of the gap junction protein Cx43 (Connexin 43), the gene of which is mutated in shortfin (sof) fish (44). Thus, our data are consistent with expression patterns predicted for effectors of positional memory from salamander studies and known developmental patterning genes in fish.
Evidence for Possible Multifactorial Contributions to Positional Memory.
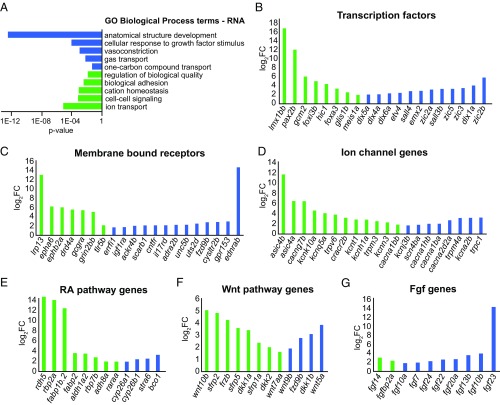
Experimental manipulation of effectors of positional memory is predicted to induce abnormal patterning during regeneration (1). Consistent with this prediction, Gene Ontology (GO) term analyses showed biological processes involved in patterning, such as “anatomical structure development” and “cell-cell signaling” (Fig. 2A). Thus, we analyzed the RNA-seq data to identify the types of molecules that are differentially expressed along the proximodistal axis of the caudal fin.
Fig. 2.
Complex differential expression of RNAs identified along proximodistal axis of caudal fin. (A) Annotations for GO Biological Process terms were performed for RNA. Proximally enriched (green) and distally enriched (blue) RNAs (FDR < 1% and fold change > 3.0) were examined as separate groups by using g:Cocoa (under g:Profiler) with “Best per parent group” hierarchical filtering. Statistically significant GO terms had P < 0.05. (B–G) Bar graphs show proximally enriched (green) and distally enriched (blue) transcripts identified by RNA-seq (FDR < 1% and fold change > 3) for transcription factors (B), membrane bound receptors (C), ion channels (D), RA signaling pathway (E), Wnt signaling pathway (F), and for Fgf genes (G). For B–D, only the top 20 scored RNAs are shown (Datasets S7–S9).
Transcription factors are master regulators of cell identity and, thus, are top candidates for effectors of positional memory. Of the 693 mRNAs encoding transcription factors quantified in our RNA-seq data, 53 were differentially expressed between proximal and distal regions of the fin (Fig. 2B and Dataset S7). Seven of these transcription factors, dlx5a, dlx6a, meis1a, msx1a, hoxb13a, raraa, and lmx1bb, are directly implicated in patterning developing appendages (45–50), consistent with the prediction that mechanisms from development may regulate positional memory in adult structures.
Transmembrane proteins are good candidates for effectors of positional memory because of their roles as receptors for major signaling pathways. Additionally, some transmembrane proteins form channels that tune bioelectric signaling, which has been shown to pattern developing and regenerating tissues (51, 52). The GO terms “ion transport” and “cation homeostasis” were annotated in proximally enriched genes in the caudal fin (Fig. 2A). RNAs corresponding to 80 of 964 transmembrane receptors and 55 of 222 ion channel proteins were differentially expressed between proximal and distal regions (Datasets S8 and S9, respectively). These hits included glutamate and dopamine receptive G protein coupled receptors and several Ca2+ and K+ permeable channels (Fig. 2 C and D). In addition, we found differential expression of transmembrane proteins associated with cell signaling pathways not previously implicated in growth control or regeneration, such as ephrin and ednrab.
Cell-cell communication is controlled through signal transduction pathways. Several of these pathways, such as RA, WNT, and FGF signaling, have known roles in growth control and patterning during appendage development and regeneration (10, 18, 53). Therefore, we manually curated lists of genes with known roles in RA, WNT, and FGF signaling (Datasets S10, S11, and S12, respectively). These lists included 55, 52, and 41 genes for RA, WNT, and FGF signaling pathways, respectively. From these lists, we identified complex, opposing gradients of transcript abundance for 12 RA, 13 WNT, and 10 FGF signaling pathway genes (Fig. 2 E–G). Future work resolving these expression domains to the cellular level should help elucidate how these complex patterns interact.
Patterns of Aldh1l1 and Ca2 in Multiple Fins of Wild-Type and Mutant Fish.
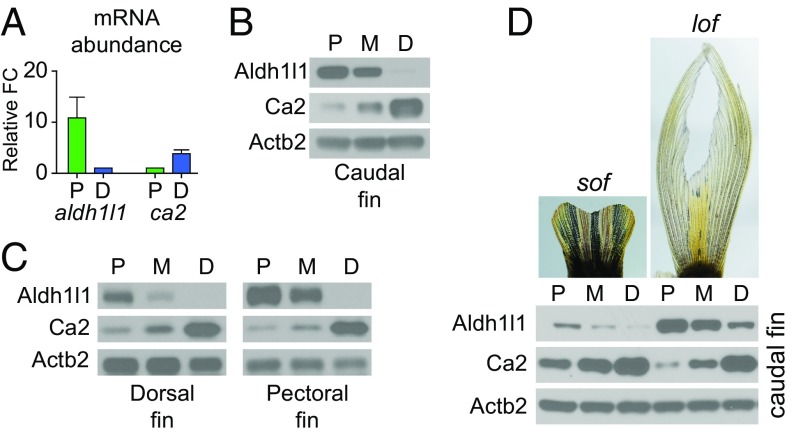
We predicted that heretofore-unidentified markers of positional memory may be conserved in fins with different shapes and sizes. The enzyme Aldh1l1 was among the list of high-confidence candidates that were proximally enriched. Aldh1l1 is an aldehyde dehydrogenase that converts 10-formyltetrahydrofolate to tetrahydrofolate, a critical factor in folate metabolism (54). Maternal folate deficiency during human prenatal development can cause major patterning abnormalities, largely due to neural tube defects (55). Therefore, we analyzed Aldh1l1 in more detail. We verified that aldh1l1 transcripts were more abundant in proximal compared with distal regions of the uninjured adult caudal fin (Fig. 3A). Moreover, we verified that Aldh1l1 protein was present in a proximally enriched gradient in caudal fins by using Western blot (Fig. 3B). We hypothesized that patterns of candidate effectors should be conserved in different fins. Indeed, Aldh1l1 protein was in a proximally enriched gradient in dorsal and pectoral fins of uninjured zebrafish (Fig. 3C).
Fig. 3.
Aldh1l1 and Ca2 abundance in WT and mutant fins. (A) Graphs of the relative abundance of aldh1l1 and ca2 transcripts in proximal compared with distal regions of uninjured fins determined by RT-qPCR. Data are normalized to the abundance of actb2 transcripts. Data are mean ± SEM of n = 6 experiments for aldh1l1 and n = 3 for ca2, with >8 fish per experiment. (B and C) Representative Western blots showing Aldh1l1 and Ca2 protein in the proximal (P), middle (M), and distal (D) regions of uninjured caudal fins (B) and uninjured pectoral and dorsal fins (C). Actb2 was used as a loading control. (D) Representative images of sof and lof uninjured caudal fins, with Western blots showing Aldh1l1 and Ca2 protein in the proximal (P), middle (M), and distal (D) regions of these mutant fins.
We also performed further analysis of the enzyme Ca2, one of the distally enriched candidates from the high-confidence list. Ca2 catalyzes the hydration of carbon dioxide, and defects in ca2 are associated with a heritable disorder with cerebral, skeletal, and renal phenotypes (56). We verified that the abundances of Ca2 transcripts (Fig. 3A) and protein (Fig. 3B) were distally enriched. Moreover, Ca2 protein was distally enriched in both the dorsal and pectoral fins (Fig. 3C).
We also examined whether the opposing gradients of Aldh1l1 and Ca2 are maintained in fish with mutations that alter fin size. sof and longfin (lof) fish have short and long caudal fins, respectively (Fig. 3D) (40, 41, 57). We found that the opposing gradients of Aldh1l1 and Ca2 were maintained in fins of both strains of mutant fish (Fig. 3D). In addition, the overall expression of Aldh1l1 was lower in fins of sof fish compared with lof fish (Fig. 3D). This observation suggests that positional information can be scaled to fit fins altered in size because of mutations rather than having complete misregulation of the normal differential expression patterns. These data demonstrate that the abundances of Aldh1l1 and Ca2 are markers for position along the proximodistal axis across multiple zebrafish fins and in fin-size mutants and suggest that these enzymes may play a role in establishing positional memory during regeneration.
Relative Metabolite Abundance Measured Along Proximodistal Axis of Caudal Fins.
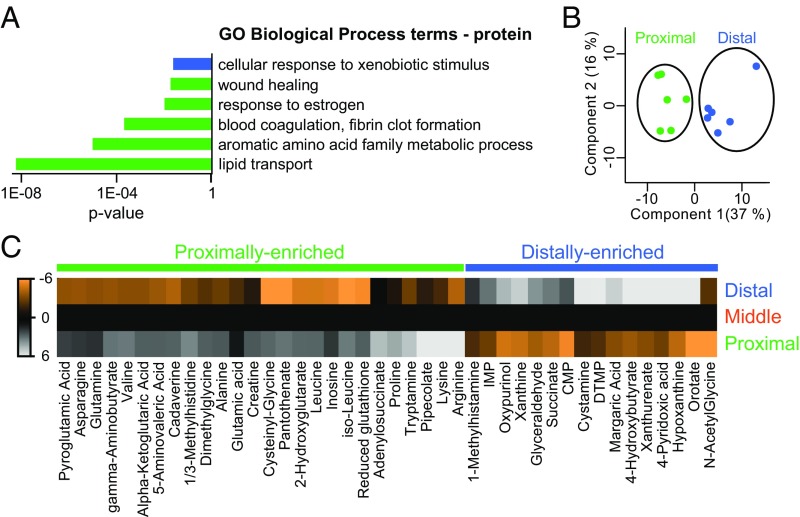
In addition to genetically encoded cues, metabolic products may contribute to positional memory. For example, vitamin D metabolism is important for establishing anteroposterior positional information in the pectoral fin (16). We found that several metabolic enzymes, including aldh1l1, were differentially expressed along the proximodistal axis of caudal fins. Moreover, GO term analysis of proximally enriched proteins identified proteins related to amino acid metabolism and lipid transport (Fig. 4A).
Fig. 4.
Metabolites are differentially expressed along the proximodistal axis of the fin. (A) Annotations for GO Biological Process terms were performed for protein. Proximally enriched (green) and distally enriched (blue) proteins (FDR < 5%) were examined as separate groups by using g:Cocoa (under g:Profiler) with Best per parent group hierarchical filtering. Statistically significant GO terms had P < 0.05. (B) PCA of metabolite abundance from proximal (green) and distal (blue) regions; points represent individual fish. (C) Heat maps of 42 metabolites with proximally enriched (green) or distally enriched (blue) gradients. Each metabolite was differentially abundant (FDR < 5%) between proximal and distal regions. The metabolite values shown are the abundance averages from all biological replicates, normalized to the middle region, and then log2 transformed.
We used mass spectrometry to profile metabolites in proximal, middle, and distal regions of the uninjured caudal fin. We were able to quantify 125 metabolites in individual fish fin samples (Datasets S26 and S27). PCA clustered the metabolite abundances from proximal and distal fin regions into distinct groups (Fig. 4B). The abundances of several individual metabolites differed between the proximal and distal region; 26 were proximally enriched and 16 were distally enriched (Fig. 4C and Dataset S28). Arginine, the most proximally enriched metabolite measured (Dataset S29), is required for wound healing (58) and induces proliferation in multiple cells types (59–61). Glutamine and leucine function with arginine to promote proliferation (62) and were also proximally enriched (Dataset S29). Conversely, orotate, which increases in abundance in arginine-depleted tissues (63), was the most distally enriched metabolite measured (Dataset S29). Thus, metabolites may function to maintain proximal tissues in a metabolically poised state for more rapid proliferation.
Protein Abundance During Early Regeneration.
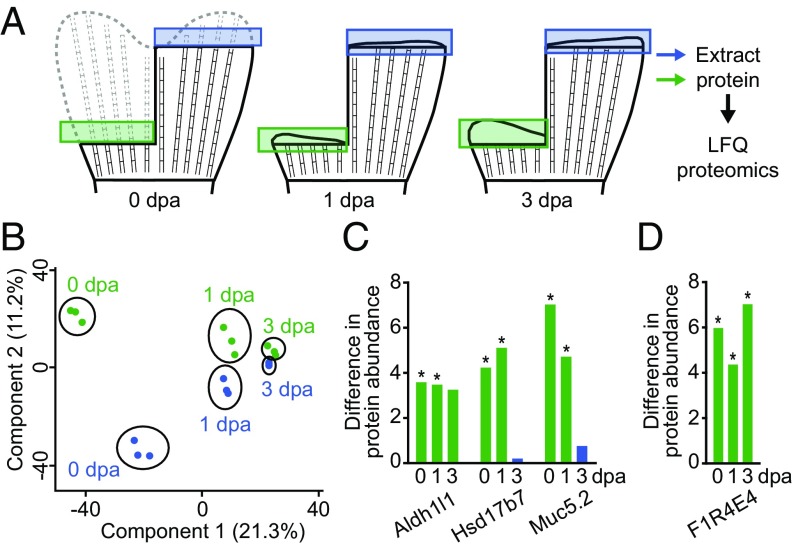
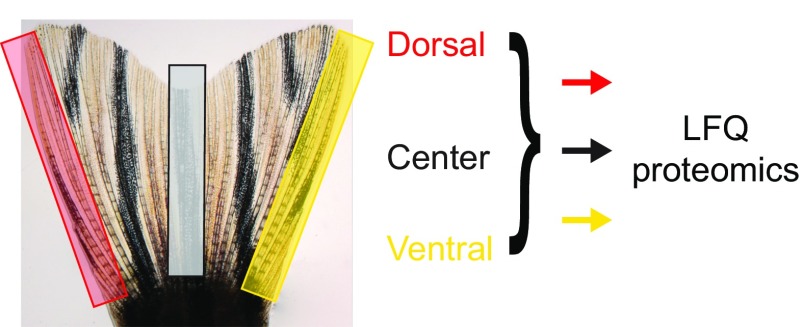
We predicted that the pattern of expression of markers of positional memory in the uninjured fin should be retained during the early stages after injury. To test this prediction, we performed LFQ proteomics on segments of regenerating fins at 1 and 3 d after amputation (dpa), during the periods of blastema formation and outgrowth, respectively (Fig. 5A and Datasets S15, S22, and S23). To reduce potential variability between fish, we sampled dorsal-proximal and ventral-distal regions of regenerating fins from the same fish (double amputation). We found that 97, 11, and 2 of 3,061 proteins were differentially expressed between dorsal-proximal and ventral-distal positions at 0, 1, and 3 dpa, respectively (Datasets S15, S22, and S23). These differences were due to proximodistal differences rather than dorsoventral differences because we observed in an independent LFQ proteomics experiment that none of the 3,061 quantified proteins were differentially expressed between the entire dorsal and ventral lobes of the fin (Fig. S4 and Datasets S24 and S25). PCA of protein expression at different times during regeneration showed that samples from 1 and 3 dpa clustered into distinct groups with little variation between proximal or distal regions, whereas more variation existed between proximal and distal regions in uninjured fins (0 dpa) (Fig. 5B). These clustering patterns suggest that the molecular regenerative program in blastemas largely overrides positional information maintained along the proximodistal axis in uninjured fins.
Fig. 5.
Proteomic analyses of proximal and distal regions of regenerating caudal fins identifies proteins that maintain differential expression after injury. (A) Diagram showing the regions of fins collected before (0 dpa) or during (1 and 3 dpa) regeneration for analysis by LFQ proteomics. (B) PCA of samples from proximal (green) and distal (blue) regions at the indicated times. The points represent technical replicates of 20 fish per region and time point. (C and D) Graphs of differences in protein abundances between proximal and distal regions. Protein abundance is plotted as the absolute value of the difference between the log2 transformed protein abundance. The colors of the bars indicate proximally enriched (green), or distally enriched (blue) proteins. *FDR < 5%. The genes graphed in C are the ones found with proximally enriched protein expression at 0 and 1 dpa, and also have proximally enriched RNA expression in uninjured fins. The gene graphed in D is the only protein that was differentially expressed between proximal and distal regions at 0, 1, and 3 dpa.
Fig. S4.
Representative caudal fin showing regions harvested for dorsal, central, and ventral proteomics.
Nevertheless, of the 11 proteins differentially expressed at 1 dpa, 6 were also differentially expressed in uninjured fins (0 dpa). Three of the genes encoding these proteins, aldh1l1, hsd17b7, and muc5.2 (Fig. 5C), were also measured by RNA-seq and found to be differentially expressed as transcripts in uninjured fins (Table 1 and Dataset S4). At 3 dpa, only two proteins were differentially expressed between the two regions (Dataset S23). One of these hits, an uncharacterized protein with the UniProt ID F1R4E4, was the only protein that was differentially expressed at 0, 1, and 3 dpa (Fig. 5D). F1R4E4 has >30% similarity to human Legumain, an asparaginyl endopeptidase. Thus, these six proteins uniquely meet all of the criteria as candidates for bona fide effectors of positional memory.
Discussion
Outgrowth is tightly controlled during appendage regeneration in vertebrates to ensure that the tissue recovers to the appropriate preinjury size. Controlled outgrowth is regulated by positional memory in tissues remaining after injury. With the goal of searching for molecules that may participate in positional memory, we quantified the transcriptome, proteome, and metabolome along the proximodistal axis of zebrafish caudal fins, and the proteome of regenerating fins at different times after injury. Comparing these datasets led to the identification of RNAs, proteins, and metabolites that display different steady-state levels along the proximodistal axis (Fig. 6).
Fig. 6.
Molecular gradients identified in the fin. Summary of transcripts, proteins, and metabolites found in the illustrated patterns along the proximodistal axis of the caudal fin; ND, not detected.
Despite the observed roles of Prod1 and RA signaling in positional memory, previous studies (23–26, 39) do not report expression gradients of agr2 or RA signaling pathway molecules in uninjured tissues. However, we identified differential expression of agr2 and many RA pathway genes in the uninjured caudal fin. Closer scrutiny of these gene products in the uninjured amphibian limb may identify similar expression gradients. Additionally, secreted anterior gradient protein is the ligand for the Prod1 receptor in salamanders, but not all members of this protein family are secreted robustly, or at all (64). It will be interesting to learn whether zebrafish Agr2 is secreted in the fin and if so, what receptor(s) it is binding.
To understand outgrowth during regeneration, we also need to understand the molecular factors that control homeostasis of tissue size in uninjured adult tissues. There are likely many factors that must be expressed at homeostatic levels to maintain size proportions in adults. For example, inhibiting Fgf signaling in uninjured adult zebrafish fins results in a gradual reduction of fin size due to a loss of distal structures (65). Importantly, we identified eight distally enriched Fgf transcripts in uninjured fins, consistent with their role in homeostasis of the distal fin region. This spatially restricted phenotype highlights the importance of patterned expression gradients in the adult fin and suggests that there are upstream factors controlling the expression of Fgf ligands in uninjured tissues.
Transcription factors required for development may maintain patterned expression in adult tissues and play a role in tissue size homeostasis and/or positional memory. Notably, an analysis of global gene expression identified transcription factors with roles in fin development with spatially restricted expression in adult pectoral fins (16). Likewise, we found 53 transcription factors that were differentially expressed along the proximodistal axis in the caudal fin, several of which are implicated in patterning developing appendages. Two of these factors, dlx5a and msx1a, are known to be up-regulated in early blastemas (2 dpa) during caudal fin regeneration (66). Additionally, among this identified set were raraa, an RA receptor that regulates transcription of RA targets, and meis1a, an RA target that activates Prod1 expression (27). Further analysis of these transcription factors may yield insight into how their expression is spatially restricted in adult tissues and the roles of these proteins in patterning regenerating appendages and stabilizing adult structures.
In contrast to the role of RA signaling in salamanders and frogs, hyperactivation of RA signaling does not induce overgrowth of regenerating zebrafish fins. This difference may be due to genetic or morphological differences among species. However, RA signaling is important for fin development and regeneration (67–70). We identified several members of the RA signaling pathway with opposing patterns of differential expression along the proximodistal axis of uninjured fins. Thus, complex regulation of RA signaling and the pleiotropic roles of RA in fin morphogenesis may provide an alternate explanation as to why global activation of RA signaling does not proximalize regenerating tissue in zebrafish. Experiments in which RA signaling is activated in single-fin rays or specific cell types during fin regeneration may address this issue.
Patterning and size control during development and regeneration are also regulated by bioelectric signaling (52, 71–78). Mutations in two strains of zebrafish with fin size phenotypes map to genes involved in bioelectric signaling (41, 79). The another longfin (alf) mutation maps to the gene encoding the potassium channel protein, Kcnk5b, which directly increases potassium conductance, and causes fin overgrowth (80). In contrast, the sof mutation occurs in cx43, which encodes a protein involved in gap junction formation, and produces short fins (81). Our data identified mRNAs for 55 ion channel genes that were differentially expressed in uninjured caudal fins. Thus, these proteins may regulate bioelectric signaling to maintain size homeostasis in adult fins.
It remains unclear how the molecular patterns described here are established and maintained in the adult fin. Some of these patterns may arise from the underlying morphology of the fin. For example, proximal rays have wider hemirays, accommodating more fibroblasts, than distal rays. Thus, the abundance of proximally enriched factors stimulating RA signaling (e.g., aldh1a2) could be directly due to the increased fibroblast population and bone matrix production that are prevalent in the proximal rays (31). Accordingly, cyp26a1 and cyp26b1 are distally enriched, indicative of their roles in osteoblast proliferation and positioning as observed during life-long growth at the distal end of the fin (31, 82). However, it is also possible that these patterns are retained from development, because the same expression patterns for aldh1a2 and cyp26b1 are seen in developing limb buds (83). Understanding how these molecular distributions are regulated in the uninjured adult fin remains an important question for the study of positional memory and investigations of tissue homeostasis in adult structures.
In conclusion, our data catalog global patterns of gene products and metabolites through one axis of a complex adult tissue and reveal candidate effectors of positional memory. This list of candidates offers a resource of potential markers and effectors with roles in regeneration and organ size control in adult appendages.
Materials and Methods
Zebrafish Lines, Husbandry, and Surgeries.
AB WT fish (Zebrafish International Resource Center) between 6 and 15 mo old were used for all transcriptomic, proteomic, and metabolomic screens. For Western blots, AB WT, Tupfel lof, and sof fish were used as indicated. Fish husbandry was done by using standard procedures. All amputations were done as described (3, 84) and approved by the University of Washington Institutional Animal Care and Use Committee.
RNA-seq.
RNA-seq was performed on five biological replicates for each of three positions along the proximodistal axis of the caudal fin: proximal, middle, and distal (15 total samples). Each biological replicate was a pool of fin regions cut from two male and two female zebrafish. Collected fins were flash frozen in liquid nitrogen and stored at −80 °C. Total RNA was extracted from fin samples and rRNA-depleted by using the Ribo-Zero Gold rRNA Removal Kit (Illumina). Sample libraries were made by using TruSeq Constructions Kits and sequenced by using the HiSeq platform (Illumina) with 20–30 million 50 bp, paired-end sequences per sample. RNA extraction, rRNA depletion, library construction, and sequencing were done by Covance Genomics Laboratory. Differential gene expression analyses were performed as follows: FASTQ reads were aligned to Zebrafish GRCz10 by using Tophat 2.0.13 (85) with default settings. HTSeq count (86) was used to get read counts for each sample. Ensembl GRCz10 gene annotation file was used for gene expression quantification. Differential analysis was performed with DESEq (87).
Proteomics.
Three separate biological experiments were performed to quantify protein expression along the proximodistal axis in the uninjured fin (Fig. S1). Experiment 1 collected and pooled proximal and distal regions from eight age-matched fish. Experiment 2 collected and pooled dorsal-proximal and ventral-distal regions from 20 age- and gender-matched fish. Samples from experiment 2 were run on two independent mass spectrometry machines (2 and 2*; see below). Experiment 3 collected and pooled proximal, middle, and distal regions from 20 age- and gender-matched fish. The middle region was only sampled in Experiment 3. For 1 and 3 dpa regenerating samples, dorsal-proximal and ventral-distal double amputations were done at day 0. Twenty age- and gender-matched fish were amputated for each regeneration time point, and the proximal and distal regenerating samples were collected on the appropriate day. Of note, collections at 1 and 3 dpa included one to two ray segments of existing stump tissue (Fig. 5). One biological experiment was performed to quantify protein in dorsal, central, and ventral regions of the caudal fin with regions pooled from 20 age- and gender-matched fish (Fig. S4). Fin sections were pestle ground, sonicated, and heated to 60 °C for 30 min in 1 M urea, 50 mM ammonium bicarbonate, pH 7.8. Cell debris was removed by centrifugation (10,000 × g, 2 min). Following a BCA, normalized quantities of protein were reduced with 2 mM DTT, alkylated with 15 mM iodoacetamide, and digested overnight with a 1:50 ratio of trypsin to total protein. The resulting peptides were desalted on Waters Sep-Pak C18 cartridges. Peptides were measured by nano-liquid chromatography-MS/MS (LC-MS/MS) on a Q Exactive (experiments 1, 2, and regenerating samples; ThermoFisher Scientific) or Orbitrap Fusion (experiments 2* and 3; ThermoFisher Scientific). Peptides were separated online by reverse phase chromatography by using a heated 50 °C 30-cm C18 column (75-mm ID packed with Magic C18 AQ 5 μM/100 Å beads) in a 120-min gradient [1% (vol/vol) to 45% (vol/vol) acetonitrile with 0.1% (vol/vol) formic acid] separated at 250 nL/min. The Q Exactive was operated in the data-dependent mode with the following settings: 70000 resolution, 300–2,000 m/z full scan, Top 10, and a 1.8 m/z isolation window. The Fusion Orbitrap was operated in data-dependent mode with a 60,000 resolution, 400–1,600 m/z full scan, top speed of 3 s, and 1.8 m/z isolation window. Identification and LFQ of peptides was done with MaxQuant 1.3.0.5 (88) by using a 1% false discovery rate (FDR) against the Danio rerio Swiss-Prot/TrEMB database downloaded from Uniprot on June 10, 2013. We analyzed three to eight technical replicates per condition. Peptides were searched for variable modification of n-term protein acetylation, oxidation (M), deamidation (NQ), with a six ppm mass error and a match between run window of 4 min. Proteins that were significantly regulated between conditions were identified by using a permutation-based t test (S1, FDR < 5%) in Perseus 1.4.1.3.
Real-Time Quantitative PCR.
Proximal or distal regions from 8 to 12 fish for each biological replicate were collected and pooled. aldh1l1 was run on six total biological replicates and ca2 was run on three. Total RNA was extracted from each sample by using TRIzol (ThermoFisher Scientific) according to the manufacturer’s protocol. cDNA was synthesized by using 0.5–1.0 μg of purified RNA with the RevertAid First Strand cDNA Synthesis Kit (ThermoFisher Scientific) and a 1:1 ratio of oligo-dT and random hexamer primers. Real-time quantitative PCR (RT-qPCR) was performed by using LightCycler 480 SYBR Green I Master mix (Roche) on a LightCycler 480 Instrument (Roche). Fold change was calculated by using the ΔΔCT method, relative to actb2. Statistical significance was calculated by using Student’s t test with P < 0.05. aldh1l1-forward primer (5′-GCTCTGTGTTCTTCAATAAGGG-3′); aldh1l1-reverse primer (5′-TTTCGCTAACCACTCTTTCC-3′); ca2-forward primer (5′- CGATAAGCATAACGGCCCAGACAA-3′); ca2-reverse primer (5′- CTATTGGAGACTGGCGAG AGCCG-3′); actb2-forward primer (5′- GGTATGGGACAGAAAGACAG-3′); actb2-reverse primer (5′- AGAGTCCATCACGATACCAG -3′).
Western Blot Analyses.
For all caudal, dorsal, and pectoral fin experiments, proximal, middle, and distal regions were harvested and pooled from 10 age- and gender-matched fish, for each biological replicate, with three total replicates tested. Protein was isolated by using radioimmunoprecipitation assay (RIPA) lysis buffer (50 mM Tris pH 8.0, 1% Triton X-100, 0.1% SDS, 0.2% deoxycholate, 150 mM sodium chloride, 2 mM EDTA) with one cOmplete, Mini, EDTA-free Protease Inhibitor Mixture tablet (Roche) and one PhosSTOP tablet (Roche) added per 10 mL of RIPA buffer. Samples were normalized by using Pierce BCA Protein Assay Kit (ThermoFisher Scientific). Five to 15 micrograms of protein was run per sample on NuPAGE Novex 4–12% (wt/vol) Bis-Tris (Invitrogen) gels, and proteins were transferred to 0.45 µM nitrocellulose membranes. Membranes were blocked with 5% (wt/vol) nonfat dry milk powder in PBTw (1× PBS with 0.1% Tween 20) for 30–60 min and washed three times for 5 min each by using PBTw. Then, membranes were incubated with antibodies targeting Aldh1l1 at 1:1000 (Sigma MABN495) or Ca2 at 1:16000 (89) diluted in 5% (wt/vol) BSA and 0.02% sodium azide in PBTw overnight on a shaker at 4 °C. The next day, membranes were washed three times for 10 min each with PBTw and then incubated with HRP-conjugated antibodies targeting mouse IgG (H+L) (Jackson ImmunoResearch 111–035-146; 1:2000) or rabbit IgG (H+L) (Jackson ImmunoResearch 111-035-144; 1:3000) for 1 h on a shaker at room temperature in 5% nonfat dry milk powder in PBTw. For loading controls, HRP-conjugated antibodies targeting Actb2 (Santa Cruz sc-47778 HRP; 1:20000), diluted in 5% (wt/vol) BSA in PBTw, were incubated for 1 h at room temperature. Membranes were then washed six times for 10 min each with PBTw, treated with Pierce ECL Western Blotting Substrate (Life Technologies) and exposed on Blue Basic Autorad film (Bioexpress).
Metabolomics.
Proximal, middle, and distal regions were harvested separately from six adult fish (three male and three female). For each fish, tissue samples were transferred to Eppendorf tubes, immediately flash frozen in liquid nitrogen, and then stored at −80 °C. For metabolite extraction, samples were placed on ice, resuspended in 300 μL of 80% (vol/vol) methanol in water and homogenized by using an Ultra-Turrax homogenizer with three 5-s pulses per sample. Samples were kept on ice for 10 min and then spun at 4 °C for 15 min at high speed. Supernatant (250 µL per sample) was transferred to a new tube and dried down by using a speed vacuum at 30 °C. Dried samples were stored at −80 °C. The LC-MS/MS data were collected by using a standard targeted metabolic profiling MS method in the Northwest Metabolomics Research Center as described (90, 91). Briefly, the LC-MS/MS experiments were performed on an Agilent 1260 LC (Agilent Technologies) AB Sciex QTrap 5500 MS (AB Sciex) system. Each sample had 10 µL injected for analysis by using negative ionization mode and 2 µL injected for analysis by using positive ionization mode. Both chromatographic separations were performed by using hydrophilic interaction chromatography (HILIC) on the SeQuant ZIC-cHILIC column (150 × 2.1 mm, 3.0 µm; Merck KGaA) with a flow rate of 0.3 mL/min. The mobile phase was composed of solvents A [5 mM ammonium acetate in 89.9% H2O, 9.9% (vol/vol) acetonitrile, 0.2% acetic acid] and B [5 mM ammonium acetate in 89.9% (vol/vol) acetonitrile, 9.9% H2O, 0.2% acetic acid]. After the initial 2-min isocratic elution of 90% (vol/vol) B, the percentage of solvent B decreased to 50% (vol/vol) at t = 5 min. The composition of solvent B maintained at 50% (vol/vol) for 4 min (t = 9 min), and then the percentage of B gradually went back to 90% (vol/vol), to prepare for the next injection. The metabolite identities were confirmed by spiking the pooled serum sample used for method development with mixtures of standard compounds. The extracted multiple reaction monitoring peaks were integrated by using MultiQuant 2.1 software (AB Sciex). Of the 199 metabolites targeted, we were able to identify and quantify 125 in zebrafish fin tissue. Each metabolite was normalized to the average concentration for all 125 measured metabolites per sample. Subsequent analyses were performed by using MetaboAnalyst 3.0 (92). Differentially expressed metabolites were identified by using FDR < 5%.
Supplementary Material
Acknowledgments
We thank Stanley Kim, Tatiana Chua, and Jeanot Muster for fish care and maintenance; Steve Perry for providing the Ca2 antibody; David Kimelman for providing the Tupfel long fin fish; and Kathryn Iovine for providing the short fin fish. This work was supported by The Howard Hughes Medical Institute, NIH Grants P01 GM081619 and U01 HL100395, and in part by University of Washington's Proteomics Resource Grant UWPR95794. R.T.M. is an Investigator of The Howard Hughes Medical Institute.
Footnotes
The authors declare no conflict of interest.
Data deposition: The data reported in this paper have been deposited in the Gene Expression Omnibus (GEO) database, www.ncbi.nlm.nih.gov/geo (accession no. GSE92760).
This article contains supporting information online at www.pnas.org/lookup/suppl/doi:10.1073/pnas.1620755114/-/DCSupplemental.
References
- 1.Poss KD. Advances in understanding tissue regenerative capacity and mechanisms in animals. Nat Rev Genet. 2010;11(10):710–722. doi: 10.1038/nrg2879. [DOI] [PMC free article] [PubMed] [Google Scholar]
- 2.Iten LE, Bryant SV. Regeneration from different levels along the tail of the newt, Notophthalmus viridescens. J Exp Zool. 1976;196(3):293–306. doi: 10.1002/jez.1401960304. [DOI] [PubMed] [Google Scholar]
- 3.Lee Y, Grill S, Sanchez A, Murphy-Ryan M, Poss KD. Fgf signaling instructs position-dependent growth rate during zebrafish fin regeneration. Development. 2005;132(23):5173–5183. doi: 10.1242/dev.02101. [DOI] [PubMed] [Google Scholar]
- 4.Maden M. Blastemal kinetics and pattern formation during amphibian limb regeneration. J Embryol Exp Morphol. 1976;36(3):561–574. [PubMed] [Google Scholar]
- 5.Maden M, Avila D, Roy M, Seifert AW. Tissue specific reactions to positional discontinuities in the regenerating axolotl limb. Regeneration (Oxf) 2015;2(3):137–147. doi: 10.1002/reg2.35. [DOI] [PMC free article] [PubMed] [Google Scholar]
- 6.Akimenko M-A, Marí-Beffa M, Becerra J, Géraudie J. Old questions, new tools, and some answers to the mystery of fin regeneration. Dev Dyn. 2003;226(2):190–201. doi: 10.1002/dvdy.10248. [DOI] [PubMed] [Google Scholar]
- 7.Gemberling M, Bailey TJ, Hyde DR, Poss KD. The zebrafish as a model for complex tissue regeneration. Trends Genet: TIG. 2013;29(11):611–620. doi: 10.1016/j.tig.2013.07.003. [DOI] [PMC free article] [PubMed] [Google Scholar]
- 8.Stoick-Cooper CL, Moon RT, Weidinger G. Advances in signaling in vertebrate regeneration as a prelude to regenerative medicine. Genes Dev. 2007;21(11):1292–1315. doi: 10.1101/gad.1540507. [DOI] [PubMed] [Google Scholar]
- 9.Tal TL, Franzosa JA, Tanguay RL. Molecular signaling networks that choreograph epimorphic fin regeneration in zebrafish - a mini-review. Gerontology. 2010;56(2):231–240. doi: 10.1159/000259327. [DOI] [PMC free article] [PubMed] [Google Scholar]
- 10.Wehner D, Weidinger G. Signaling networks organizing regenerative growth of the zebrafish fin. Trends Genet. 2015;31(6):336–343. doi: 10.1016/j.tig.2015.03.012. [DOI] [PubMed] [Google Scholar]
- 11.Yin VP, Poss KD. New regulators of vertebrate appendage regeneration. Curr Opin Genet Dev. 2008;18(4):381–386. doi: 10.1016/j.gde.2008.06.008. [DOI] [PMC free article] [PubMed] [Google Scholar]
- 12.Rolland-Lagan A-G, Paquette M, Tweedle V, Akimenko M-A. Morphogen-based simulation model of ray growth and joint patterning during fin development and regeneration. Development. 2012;139(6):1188–1197. doi: 10.1242/dev.073452. [DOI] [PubMed] [Google Scholar]
- 13.Bessonov N, et al. On a model of pattern regeneration based on cell memory. PLoS One. 2015;10(2):e0118091. doi: 10.1371/journal.pone.0118091. [DOI] [PMC free article] [PubMed] [Google Scholar]
- 14.Iovine MK. Conserved mechanisms regulate outgrowth in zebrafish fins. Nat Chem Biol. 2007;3(10):613–618. doi: 10.1038/nchembio.2007.36. [DOI] [PubMed] [Google Scholar]
- 15.Kragl M, et al. Novel insights into the flexibility of cell and positional identity during urodele limb regeneration. Cold Spring Harb Symp Quant Biol. 2008;73:583–592. doi: 10.1101/sqb.2008.73.034. [DOI] [PubMed] [Google Scholar]
- 16.Nachtrab G, Kikuchi K, Tornini VA, Poss KD. Transcriptional components of anteroposterior positional information during zebrafish fin regeneration. Development. 2013;140(18):3754–3764. doi: 10.1242/dev.098798. [DOI] [PMC free article] [PubMed] [Google Scholar]
- 17.Stocum DL, Cameron JA. Looking proximally and distally: 100 years of limb regeneration and beyond. Dev Dyn. 2011;240(5):943–968. doi: 10.1002/dvdy.22553. [DOI] [PubMed] [Google Scholar]
- 18.Tornini VA, Poss KD. Keeping at arm’s length during regeneration. Dev Cell. 2014;29(2):139–145. doi: 10.1016/j.devcel.2014.04.007. [DOI] [PMC free article] [PubMed] [Google Scholar]
- 19.Kumar A, Gates PB, Brockes JP. Positional identity of adult stem cells in salamander limb regeneration. C R Biol. 2007;330(6-7):485–490. doi: 10.1016/j.crvi.2007.01.006. [DOI] [PubMed] [Google Scholar]
- 20.da Silva SM, Gates PB, Brockes JP. The newt ortholog of CD59 is implicated in proximodistal identity during amphibian limb regeneration. Dev Cell. 2002;3(4):547–555. doi: 10.1016/s1534-5807(02)00288-5. [DOI] [PubMed] [Google Scholar]
- 21.Echeverri K, Tanaka EM. Proximodistal patterning during limb regeneration. Dev Biol. 2005;279(2):391–401. doi: 10.1016/j.ydbio.2004.12.029. [DOI] [PubMed] [Google Scholar]
- 22.Garza-Garcia A, Harris R, Esposito D, Gates PB, Driscoll PC. Solution structure and phylogenetics of Prod1, a member of the three-finger protein superfamily implicated in salamander limb regeneration. PLoS One. 2009;4(9):e7123. doi: 10.1371/journal.pone.0007123. [DOI] [PMC free article] [PubMed] [Google Scholar]
- 23.Maden M. Vitamin A and pattern formation in the regenerating limb. Nature. 1982;295(5851):672–675. doi: 10.1038/295672a0. [DOI] [PubMed] [Google Scholar]
- 24.Niazi IA, Saxena S. Abnormal hind limb regeneration in tadpoles of the toad, Bufo andersoni, exposed to excess vitamin A. Folia Biol (Krakow) 1978;26(1):3–8. [PubMed] [Google Scholar]
- 25.Niazi IA, Pescitelli MJ, Stocum DL. Stage-dependent effects of retinoic acid on regenerating urodele limbs. Wilhelm Rouxs Arch Dev Biol. 1985;194(6):355–363. [Google Scholar]
- 26.Thoms SD, Stocum DL. Retinoic acid-induced pattern duplication in regenerating urodele limbs. Dev Biol. 1984;103(2):319–328. doi: 10.1016/0012-1606(84)90320-8. [DOI] [PubMed] [Google Scholar]
- 27.Mercader N, Tanaka EM, Torres M. Proximodistal identity during vertebrate limb regeneration is regulated by Meis homeodomain proteins. Development. 2005;132(18):4131–4142. doi: 10.1242/dev.01976. [DOI] [PubMed] [Google Scholar]
- 28.Shaikh N, Gates PB, Brockes JP. The Meis homeoprotein regulates the axolotl Prod 1 promoter during limb regeneration. Gene. 2011;484(1-2):69–74. doi: 10.1016/j.gene.2011.06.003. [DOI] [PMC free article] [PubMed] [Google Scholar]
- 29.Géraudie J, Brulfert A, Monnot MJ, Ferretti P. Teratogenic and morphogenetic effects of retinoic acid on the regenerating pectoral fin in zebrafish. J Exp Zool. 1994;269(1):12–22. [Google Scholar]
- 30.White JA, Boffa MB, Jones B, Petkovich M. A zebrafish retinoic acid receptor expressed in the regenerating caudal fin. Development. 1994;120(7):1861–1872. doi: 10.1242/dev.120.7.1861. [DOI] [PubMed] [Google Scholar]
- 31.Blum N, Begemann G. Osteoblast de- and redifferentiation is controlled by a dynamic response to retinoic acid during zebrafish fin regeneration. Development. 2015;142(17):2894–2903. doi: 10.1242/dev.120204. [DOI] [PubMed] [Google Scholar]
- 32.de Sousa Abreu R, Penalva LO, Marcotte EM, Vogel C. Global signatures of protein and mRNA expression levels. Mol Biosyst. 2009;5(12):1512–1526. doi: 10.1039/b908315d. [DOI] [PMC free article] [PubMed] [Google Scholar]
- 33.Greenbaum D, Colangelo C, Williams K, Gerstein M. Comparing protein abundance and mRNA expression levels on a genomic scale. Genome Biol. 2003;4(9):117. doi: 10.1186/gb-2003-4-9-117. [DOI] [PMC free article] [PubMed] [Google Scholar]
- 34.Gry M, et al. Correlations between RNA and protein expression profiles in 23 human cell lines. BMC Genomics. 2009;10:365. doi: 10.1186/1471-2164-10-365. [DOI] [PMC free article] [PubMed] [Google Scholar]
- 35.Maier T, Güell M, Serrano L. Correlation of mRNA and protein in complex biological samples. FEBS Lett. 2009;583(24):3966–3973. doi: 10.1016/j.febslet.2009.10.036. [DOI] [PubMed] [Google Scholar]
- 36.Vogel C, Marcotte EM. Insights into the regulation of protein abundance from proteomic and transcriptomic analyses. Nat Rev Genet. 2012;13(4):227–232. doi: 10.1038/nrg3185. [DOI] [PMC free article] [PubMed] [Google Scholar]
- 37.Bchini R, Vasiliou V, Branlant G, Talfournier F, Rahuel-Clermont S. Retinoic acid biosynthesis catalyzed by retinal dehydrogenases relies on a rate-limiting conformational transition associated with substrate recognition. Chem Biol Interact. 2013;202(1–3):78–84. doi: 10.1016/j.cbi.2012.11.019. [DOI] [PMC free article] [PubMed] [Google Scholar]
- 38.Woggon W-D. Oxidative cleavage of carotenoids catalyzed by enzyme models and beta-carotene 15,15´-monooxygenase. Pure Appl Chem. 2009;74(8):1397–1408. [Google Scholar]
- 39.Kumar A, Godwin JW, Gates PB, Garza-Garcia AA, Brockes JP. Molecular basis for the nerve dependence of limb regeneration in an adult vertebrate. Science. 2007;318(5851):772–777. doi: 10.1126/science.1147710. [DOI] [PMC free article] [PubMed] [Google Scholar]
- 40.Iovine MK, Johnson SL. Genetic analysis of isometric growth control mechanisms in the zebrafish caudal Fin. Genetics. 2000;155(3):1321–1329. doi: 10.1093/genetics/155.3.1321. [DOI] [PMC free article] [PubMed] [Google Scholar]
- 41.Johnson SL, Bennett P. Growth control in the ontogenetic and regenerating zebrafish fin. Methods Cell Biol. 1999;59:301–311. doi: 10.1016/s0091-679x(08)61831-2. [DOI] [PubMed] [Google Scholar]
- 42.Wehner D, et al. Wnt/β-catenin signaling defines organizing centers that orchestrate growth and differentiation of the regenerating zebrafish caudal fin. Cell Reports. 2014;6(3):467–481. doi: 10.1016/j.celrep.2013.12.036. [DOI] [PubMed] [Google Scholar]
- 43.Zhang J, et al. Loss of fish actinotrichia proteins and the fin-to-limb transition. Nature. 2010;466(7303):234–237. doi: 10.1038/nature09137. [DOI] [PubMed] [Google Scholar]
- 44.Govindan J, Iovine MK. Hapln1a is required for connexin43-dependent growth and patterning in the regenerating fin skeleton. PLoS One. 2014;9(2):e88574. doi: 10.1371/journal.pone.0088574. [DOI] [PMC free article] [PubMed] [Google Scholar]
- 45.Akimenko MA, Johnson SL, Westerfield M, Ekker M. Differential induction of four msx homeobox genes during fin development and regeneration in zebrafish. Development. 1995;121(2):347–357. doi: 10.1242/dev.121.2.347. [DOI] [PubMed] [Google Scholar]
- 46.Carlson MRJ, Komine Y, Bryant SV, Gardiner DM. Expression of Hoxb13 and Hoxc10 in developing and regenerating Axolotl limbs and tails. Dev Biol. 2001;229(2):396–406. doi: 10.1006/dbio.2000.0104. [DOI] [PubMed] [Google Scholar]
- 47.Heude E, Shaikho S, Ekker M. The dlx5a/dlx6a genes play essential roles in the early development of zebrafish median fin and pectoral structures. PLoS One. 2014;9(5):e98505. doi: 10.1371/journal.pone.0098505. [DOI] [PMC free article] [PubMed] [Google Scholar]
- 48.Lohnes D, et al. Function of the retinoic acid receptors (RARs) during development (I). Craniofacial and skeletal abnormalities in RAR double mutants. Development. 1994;120(10):2723–2748. doi: 10.1242/dev.120.10.2723. [DOI] [PubMed] [Google Scholar]
- 49.Mercader N, et al. Opposing RA and FGF signals control proximodistal vertebrate limb development through regulation of Meis genes. Development. 2000;127(18):3961–3970. doi: 10.1242/dev.127.18.3961. [DOI] [PubMed] [Google Scholar]
- 50.Vogel A, Rodriguez C, Warnken W, Izpisúa Belmonte JC. Dorsal cell fate specified by chick Lmx1 during vertebrate limb development. Nature. 1995;378(6558):716–720. doi: 10.1038/378716a0. [DOI] [PubMed] [Google Scholar]
- 51.Levin M. Endogenous bioelectrical networks store non-genetic patterning information during development and regeneration. J Physiol. 2014;592(11):2295–2305. doi: 10.1113/jphysiol.2014.271940. [DOI] [PMC free article] [PubMed] [Google Scholar]
- 52.Stewart S, Rojas-Muñoz A, Izpisúa Belmonte JC. Bioelectricity and epimorphic regeneration. BioEssays. 2007;29(11):1133–1137. doi: 10.1002/bies.20656. [DOI] [PubMed] [Google Scholar]
- 53.Cunningham TJ, Duester G. Mechanisms of retinoic acid signalling and its roles in organ and limb development. Nat Rev Mol Cell Biol. 2015;16(2):110–123. doi: 10.1038/nrm3932. [DOI] [PMC free article] [PubMed] [Google Scholar]
- 54.Krupenko SA. FDH: An aldehyde dehydrogenase fusion enzyme in folate metabolism. Chem Biol Interact. 2009;178(1-3):84–93. doi: 10.1016/j.cbi.2008.09.007. [DOI] [PMC free article] [PubMed] [Google Scholar]
- 55.Molloy AM, Kirke PN, Brody LC, Scott JM, Mills JL. Effects of folate and vitamin B12 deficiencies during pregnancy on fetal, infant, and child development. Food Nutr Bull. 2008;29(2 Suppl):S101–S111. doi: 10.1177/15648265080292S114. [DOI] [PubMed] [Google Scholar]
- 56.Shah GN, Bonapace G, Hu PY, Strisciuglio P, Sly WS. Carbonic anhydrase II deficiency syndrome (osteopetrosis with renal tubular acidosis and brain calcification): Novel mutations in CA2 identified by direct sequencing expand the opportunity for genotype-phenotype correlation. Hum Mutat. 2004;24(3):272. doi: 10.1002/humu.9266. [DOI] [PubMed] [Google Scholar]
- 57.Tresnake I. The long-finned zebra Danio. Trop Fish Hobbyist. 1981;(29):43–56. [Google Scholar]
- 58.Seifter E, Rettura G, Barbul A, Levenson SM. Arginine: An essential amino acid for injured rats. Surgery. 1978;84(2):224–230. [PubMed] [Google Scholar]
- 59.Tan B, et al. L-Arginine stimulates proliferation and prevents endotoxin-induced death of intestinal cells. Amino Acids. 2010;38(4):1227–1235. doi: 10.1007/s00726-009-0334-8. [DOI] [PMC free article] [PubMed] [Google Scholar]
- 60.Ban H, et al. Arginine and Leucine regulate p70 S6 kinase and 4E-BP1 in intestinal epithelial cells. Int J Mol Med. 2004;13(4):537–543. [PubMed] [Google Scholar]
- 61.Fujiwara T, et al. L-arginine stimulates fibroblast proliferation through the GPRC6A-ERK1/2 and PI3K/Akt pathway. PLoS One. 2014;9(3):e92168. doi: 10.1371/journal.pone.0092168. [DOI] [PMC free article] [PubMed] [Google Scholar]
- 62.Marc Rhoads J, Wu G. Glutamine, arginine, and leucine signaling in the intestine. Amino Acids. 2009;37(1):111–122. doi: 10.1007/s00726-008-0225-4. [DOI] [PubMed] [Google Scholar]
- 63.Brosnan ME, Brosnan JT. Orotic acid excretion and arginine metabolism. J Nutr. 2007;137(6) Suppl 2:1656S–1661S. doi: 10.1093/jn/137.6.1656S. [DOI] [PubMed] [Google Scholar]
- 64.Grassme KS, et al. Mechanism of action of secreted newt anterior gradient protein. PLoS One. 2016;11(4):e0154176. doi: 10.1371/journal.pone.0154176. [DOI] [PMC free article] [PubMed] [Google Scholar]
- 65.Wills AA, Kidd AR, 3rd, Lepilina A, Poss KD. Fgfs control homeostatic regeneration in adult zebrafish fins. Development. 2008;135(18):3063–3070. doi: 10.1242/dev.024588. [DOI] [PMC free article] [PubMed] [Google Scholar]
- 66.Yoshinari N, Ishida T, Kudo A, Kawakami A. Gene expression and functional analysis of zebrafish larval fin fold regeneration. Dev Biol. 2009;325(1):71–81. doi: 10.1016/j.ydbio.2008.09.028. [DOI] [PubMed] [Google Scholar]
- 67.Blum N, Begemann G. Retinoic acid signaling controls the formation, proliferation and survival of the blastema during adult zebrafish fin regeneration. Development. 2012;139(1):107–116. doi: 10.1242/dev.065391. [DOI] [PubMed] [Google Scholar]
- 68.Blum N, Begemann G. Retinoic acid signaling spatially restricts osteoblasts and controls ray-interray organization during zebrafish fin regeneration. Development. 2015;142(17):2888–93. doi: 10.1242/dev.120212. [DOI] [PubMed] [Google Scholar]
- 69.Gibert Y, Gajewski A, Meyer A, Begemann G. Induction and prepatterning of the zebrafish pectoral fin bud requires axial retinoic acid signaling. Development. 2006;133(14):2649–2659. doi: 10.1242/dev.02438. [DOI] [PubMed] [Google Scholar]
- 70.Grandel H, Brand M. Zebrafish limb development is triggered by a retinoic acid signal during gastrulation. Dev Dyn. 2011;240(5):1116–1126. doi: 10.1002/dvdy.22461. [DOI] [PubMed] [Google Scholar]
- 71.Altizer AM, et al. Endogenous electric current is associated with normal development of the vertebrate limb. Dev Dyn. 2001;221(4):391–401. doi: 10.1002/dvdy.1158. [DOI] [PubMed] [Google Scholar]
- 72.Borgens RB, Vanable JW, Jr, Jaffe LF. Bioelectricity and regeneration: Large currents leave the stumps of regenerating newt limbs. Proc Natl Acad Sci USA. 1977;74(10):4528–4532. doi: 10.1073/pnas.74.10.4528. [DOI] [PMC free article] [PubMed] [Google Scholar]
- 73.Durant F, Lobo D, Hammelman J, Levin M. Physiological controls of large-scale patterning in planarian regeneration: A molecular and computational perspective on growth and form. Regeneration (Oxf) 2016;3(2):78–102. doi: 10.1002/reg2.54. [DOI] [PMC free article] [PubMed] [Google Scholar]
- 74.Hermle T, Saltukoglu D, Grünewald J, Walz G, Simons M. Regulation of Frizzled-dependent planar polarity signaling by a V-ATPase subunit. Curr Biol. 2010;20(14):1269–1276. doi: 10.1016/j.cub.2010.05.057. [DOI] [PubMed] [Google Scholar]
- 75.Hotary KB, Robinson KR. Evidence of a role for endogenous electrical fields in chick embryo development. Development. 1992;114(4):985–996. doi: 10.1242/dev.114.4.985. [DOI] [PubMed] [Google Scholar]
- 76.Jenkins LS, Duerstock BS, Borgens RB. Reduction of the current of injury leaving the amputation inhibits limb regeneration in the red spotted newt. Dev Biol. 1996;178(2):251–262. doi: 10.1006/dbio.1996.0216. [DOI] [PubMed] [Google Scholar]
- 77.Oviedo NJ, et al. Long-range neural and gap junction protein-mediated cues control polarity during planarian regeneration. Dev Biol. 2010;339(1):188–199. doi: 10.1016/j.ydbio.2009.12.012. [DOI] [PMC free article] [PubMed] [Google Scholar]
- 78.Tseng A-S, Beane WS, Lemire JM, Masi A, Levin M. Induction of vertebrate regeneration by a transient sodium current. J Neurosci. 2010;30(39):13192–13200. doi: 10.1523/JNEUROSCI.3315-10.2010. [DOI] [PMC free article] [PubMed] [Google Scholar]
- 79.van Eeden FJ, et al. Genetic analysis of fin formation in the zebrafish, Danio rerio. Development. 1996;123(1):255–262. doi: 10.1242/dev.123.1.255. [DOI] [PubMed] [Google Scholar]
- 80.Perathoner S, et al. Bioelectric signaling regulates size in zebrafish fins. PLoS Genet. 2014;10(1):e1004080. doi: 10.1371/journal.pgen.1004080. [DOI] [PMC free article] [PubMed] [Google Scholar]
- 81.Iovine MK, Higgins EP, Hindes A, Coblitz B, Johnson SL. Mutations in connexin43 (GJA1) perturb bone growth in zebrafish fins. Dev Biol. 2005;278(1):208–219. doi: 10.1016/j.ydbio.2004.11.005. [DOI] [PubMed] [Google Scholar]
- 82.Haas HJ. Studies on mechanisms of joint and bone formation in the skeleton rays of fish fins. Dev Biol. 1962;5(1):1–34. doi: 10.1016/0012-1606(62)90002-7. [DOI] [PubMed] [Google Scholar]
- 83.Yashiro K, et al. Regulation of retinoic acid distribution is required for proximodistal patterning and outgrowth of the developing mouse limb. Dev Cell. 2004;6(3):411–422. doi: 10.1016/s1534-5807(04)00062-0. [DOI] [PubMed] [Google Scholar]
- 84.Petrie TA, Strand NS, Yang CT, Rabinowitz JS, Moon RT. Macrophages modulate adult zebrafish tail fin regeneration. Development. 2014;141(13):2581–2591. doi: 10.1242/dev.098459. [DOI] [PMC free article] [PubMed] [Google Scholar]
- 85.Trapnell C, Pachter L, Salzberg SL. TopHat: Discovering splice junctions with RNA-Seq. Bioinformatics. 2009;25(9):1105–1111. doi: 10.1093/bioinformatics/btp120. [DOI] [PMC free article] [PubMed] [Google Scholar]
- 86.Anders S, Pyl PT, Huber W. HTSeq--a Python framework to work with high-throughput sequencing data. Bioinformatics. 2015;31(2):166–169. doi: 10.1093/bioinformatics/btu638. [DOI] [PMC free article] [PubMed] [Google Scholar]
- 87.Anders S, Huber W. Differential expression analysis for sequence count data. Genome Biol. 2010;11(10):R106. doi: 10.1186/gb-2010-11-10-r106. [DOI] [PMC free article] [PubMed] [Google Scholar]
- 88.Cox J, Mann M. MaxQuant enables high peptide identification rates, individualized p.p.b.-range mass accuracies and proteome-wide protein quantification. Nat Biotechnol. 2008;26(12):1367–1372. doi: 10.1038/nbt.1511. [DOI] [PubMed] [Google Scholar]
- 89.Miller S, Pollack J, Bradshaw J, Kumai Y, Perry SF. Cardiac responses to hypercapnia in larval zebrafish (Danio rerio): The links between CO2 chemoreception, catecholamines and carbonic anhydrase. J Exp Biol. 2014;217(Pt 19):3569–3578. doi: 10.1242/jeb.107987. [DOI] [PubMed] [Google Scholar]
- 90.Gu H, Zhang P, Zhu J, Raftery D. Globally optimized targeted mass spectrometry: Reliable metabolomics analysis with broad coverage. Anal Chem. 2015;87(24):12355–12362. doi: 10.1021/acs.analchem.5b03812. [DOI] [PMC free article] [PubMed] [Google Scholar]
- 91.Sperber H, et al. The metabolome regulates the epigenetic landscape during naive-to-primed human embryonic stem cell transition. Nat Cell Biol. 2015;17(12):1523–1535. doi: 10.1038/ncb3264. [DOI] [PMC free article] [PubMed] [Google Scholar]
- 92.Xia J, Sinelnikov IV, Han B, Wishart DS. MetaboAnalyst 3.0--making metabolomics more meaningful. Nucleic Acids Res. 2015;43(W1):W251–W257. doi: 10.1093/nar/gkv380. [DOI] [PMC free article] [PubMed] [Google Scholar]
Associated Data
This section collects any data citations, data availability statements, or supplementary materials included in this article.


