

Summary
The hippocampal dentate gyrus is often viewed as a segregator of upstream information. Physiological support for such function has been hampered by a lack of well-defined characteristics that can identify granule cells and mossy cells. We developed an electrophysiology-based classification of dentate granule cells and mossy cells in mice that we validated by optogenetic tagging of mossy cells. Granule cells exhibited sparse firing, had a single place field, and showed only modest changes when the mouse was tested in different mazes in the same room. In contrast, mossy cells were more active, had multiple place fields and showed stronger remapping of place fields under the same conditions. Although granule cell-mossy cell synapse was strong and facilitating, mossy cells rarely ‘inherited’ place fields from single granule cells. Our findings suggest that the granule cells and mossy cells could be modulated separately and their joint action may be critical for pattern separation.
INTRODUCTION
Theoretical work, clinical imaging, and lesion experiments suggest that an important computational function of the hippocampal dentate gyrus is pattern separation (Marr, 1971; McNaughton and Morris, 1987; Treves and Rolls, 1994; Rolls and Kesner, 2006; Yassa and Stark, 2011; Myers and Scharfman, 2009; Knierim and Neunuebel, 2016). This putative function is supported by the neural circuitry of the dentate gyrus, which is comprised of inputs from layer II entorhinal neurons, local interactions between dentate granule cells, mossy cells, and interneurons, and outputs to CA3 pyramidal cells. Because granule cells (1 million in each rat hemisphere) outnumber input entorhinal layer II neurons by a factor of five and do not communicate directly with each other (Amaral, 1978), the fan-out connections of entorhinal-granule cell system can segregate or ‘orthogonalize’ even minuscule but relevant differences present in the input patterns (McNaughton and Morris, 1987; McNaughton and Nadel, 1990). Specifically, mossy cells receive limited but strong convergent excitation from 40-100 granule cells, and return bilateral, widespread and divergent excitation to the granule cells (Buckmaster et al., 1992, 1996). Granule cells then forward neural activity representing separated patterns by each targeting a small population of CA3 pyramidal cells (~14 per granule cell) via powerful ‘giant’ synapses, called mossy terminals (Amaral, 1978; Amaral et al., 1990; Henze et al., 2002). Each CA3 pyramidal cell receives input from only 15-30 granule cells, and the auto-associative network of this subregion allows for the complementary computation of pattern completion. A small fraction of the CA3 pyramidal neurons also send recurrent axon collaterals back to the granule cells (Ishizuka et al., 1990; Li et al., 1994). The excitatory actions of granule cells and mossy cells are balanced by a diverse population of interneurons (Amaral, 1978; Halasy and Somogyi, 1993; Sik et al., 1997; Acsady et al., 1998; Hosp et al., 2014). Despite this well characterized anatomy, physiological support for the hypothesized role of the dentate gyrus in pattern separation is limited by the lack of reliable methods to identify and distinguish granule cells and mossy cells in neurophysiological recordings of behaving animals.
Histological verification of the electrode tip in the granule cell layer is often used as an argument for granule cell identity (Buzsaki et al., 1983; Jung and McNaughton, 1993; Leutgeb et al., 2007). However, this histologic classification is insufficient to differentiate dentate gyrus cell types, because mossy cells and large interneurons in the subgranular layers can generate large amplitude extracellular spikes that can be effectively volume-conducted to a recording electrode in the granule cell layer (Henze and Buzsáki, 2007). This reliance on electrode placement for classification of recorded cells has led to large variability of neurophysiologic features attributed to granule cells (as fast firing: Bland et al., 1980; Buzsaki et al., 1983; Rose et al., 1983; Leutgeb et al., 2007 or slow firing: Mizumori et al., 1989; Jung and McNaughton, 1993; Gothard et al., 2001; Nitz and McNaughton, 2004; Neunuebel and Knierim, 2012, 2014), and lack of reliable data about mossy cell firing patterns and behavioral correlates (Henze and Buzsáki, 2007; Jinde et al., 2012; Neunuebel and Knierim, 2012, 2014; Soltesz et al., 1993). To understand how granule cells and mossy cells contribute to the postulated computation of the dentate gyrus, it is necessary to develop parameters that allow their unequivocal separation in extracellular recordings. In this study, we identified electrophysiological criteria that distinguish granule cells from mossy cells, and validated the classification by optogenetic tagging of mossy cells. This classification scheme allowed us to subsequently characterize the network properties and behavioral correlates of these two key neural cell types.
RESULTS
Identification of granule cells and mossy cells in extracellular recordings
Mice (n = 16; n = 1 wild type, n = 7 SST-Cre; n = 3 POMC-Cre∷Ai35 mice; n = 5 DRD2-Cre∷Ai35 mice) were implanted with silicon probes and recorded during free behavior in their home cage or while performing a task in various mazes. The physiological identity of granule cells and mossy cells was determined by a heuristic, two-stage approach (Figure 1). In the first stage, putative excitatory and inhibitory neurons in the dentate gyrus were segregated. As a first step, neurons were grouped by their combined waveform and bursting properties (Figure 1A). The unfiltered waveform was quantified by the trough-to-peak latency of the extracellular spike. Bursting was determined by calculating the number of spikes in the 3–5 ms bins of the spike autocorrelograms divided by the number of spikes in the 200–300 ms bin (Figure 1A, inset; Royer et al., 2012). We took advantage of the simultaneously recorded units to physiologically identify them as excitatory or inhibitory by their short-latency temporal interactions with other neurons (Barthó et al., 2004; Royer et al., 2012). Putative monosynaptic connections are associated with precisely timed spiking relationships at short (<5 ms) latency offsets between two recorded neurons, as detected by narrow significant peaks (excitatory) or troughs (inhibitory) in the cross-correlogram (Figure S2B; Barthó et al., 2004). By these criteria, 331 of the neurons were classified as excitatory neurons and served as a template (yellow symbols in Figure 1a) for comparing the goodness of separation based on trough-to-peak latency and burstiness features. This first stage classification resulted in three divisions: putative excitatory cells (n = 1086), narrow-waveform (n = 248) and wide-waveform (n = 268) putative interneurons. A subset of neurons in SST-Cre mice were identified optogenetically as somatostatin-containing interneurons (green symbols in Figure 1A; Figure S1A) and they were all wide-waveform interneurons. The mean firing rates of narrow (median = 7.97 Hz) and wide-waveform (median = 2.11 Hz) interneurons were significantly different (P < 0.00001; Kruskal-Wallis test). Units recorded in CA3 were separately classified (Figure S2).
Figure 1. Classification of dentate gyrus units.
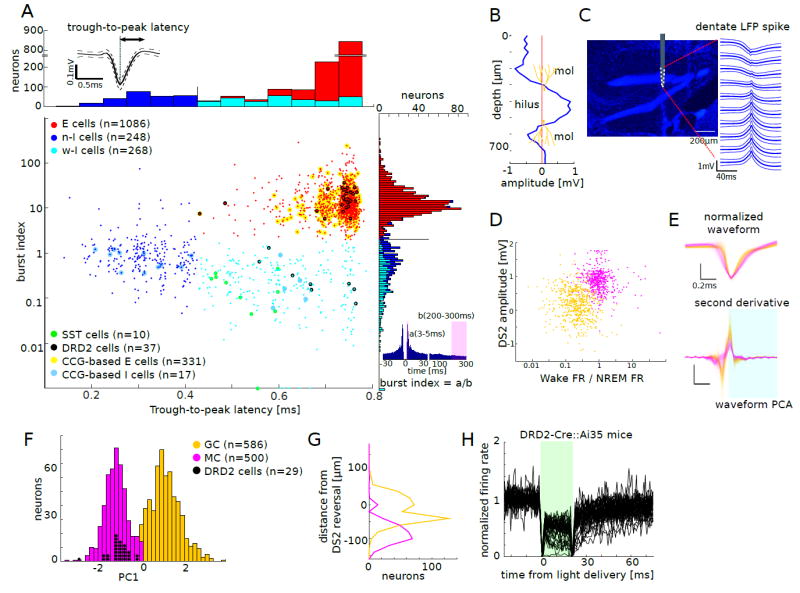
(A) Units (n = 1602 from 15mice) were first classified based on trough-to-peak latency and burst index. Each dot corresponds to one unit (Gaussian noise with s.d. = 0.012 was added to the trough-to-peak latency for the sake of visibility). Units with trough-to-peak latency < 0.425 ms were classified as narrow-waveform putative interneurons (n-I cells, blue). Wide-waveform units were grouped into putative excitatory cells (E cells, red; burst index>1.8) and wide-waveform putative interneurons (w-I cells, cyan) based on the bimodality of the marginal distribution for the burst index (right). Top left inset: average waveform (±SD) of a single unit. Optogenetically identified somatostatin-containing (SST) cells are marked by green circles and dopamine receptor D2 (DRD2) cells by black circles. E and I cells identified by short latency spike cross-correlogram (CCG) are marked by yellow (CCG-based E cells) and blue circles (CCG-based I cells), respectively. Top inset: example averaged waveform (mean ± s.d.). Bottom right inset: burst index, number of spikes in the 3–5 ms bins divided by the average number of spikes in the 200–300 ms bins.
(B) Depth profile of the amplitude of DS2 recorded with a 32-site linear probe (25 μm spacing). mol: molecular layer.
(C) Left: 10-site silicon probe shank overlaid on the image of histologically reconstructed track (DAPI, blue) at the estimated depth. Right: average LFP DS2 at different recording sites (mean ± s.d.).
(D) E units displayed as a function of DS2 amplitude and the ratio of the firing rate during wake and NREM. Yellow: putative granule cells (GC), magenta: putative mossy cells (MC).
(E) Top: overlaid amplitude-normalized average waveforms of all E units. Bottom: second derivative of the normalized waveforms. Shaded period was used for waveform PCA. Scale bar: 0.2ms
(F) Bimodal distribution of PC1, which was obtained after the second PCA, using four parameters: DS2 amplitude, the ratio of the firing rate during wake to NREM, w-PC1 (after waveform PCA), and w-PC2 (see Figure S4A-C). Based on the bimodality of the distribution, K-means clustering over the four parameters was performed to classify E units into putative GC (yellow) and MC (magenta).
(G) Distribution of depth locations of the recorded E units referenced to DS2 reversal (0). MC were located significantly deeper than GC (P<0.001; Mann-Whitney U-test).
(H) Optogenetic suppression of DRD2 cells in DRD2-Cre∷Ai35 mice, where Arch is specifically expressed in DRD2 cells. 37 units showed decreased firing (> 20 %) upon green light delivery. The large deflections at the onset and offset of the light delivery are due to the photoelectric effects.
The second stage divided excitatory neurons into putative granule cells and mossy cells based on three features. The first feature was the depth of the recorded neuron, estimated by the amplitude and polarity of LFP ‘type 2 dentate spike’ (DS2; Bragin et al., 1995) recorded by the electrode with the largest amplitude spike of the unit. Dentate spikes are large amplitude (>0.5-2.5 mV; <20-80 msec) punctate LFP patterns characterized by synchronous discharge of dentate units (Bragin et al., 1995; Penttonen et al., 1997). DS2 has a voltage versus depth profile similar to the entorhinal cortex-evoked responses in the dentate gyrus and shows a polarity reversal above the granule cell layer (Bragin et al., 1995). Therefore, the characteristic amplitude versus depth profile of DS2 (Figure 1B, C) can identify the recording depth within and outside the granule cell layer with high spatial precision (~ 20 μm, Figure 1b; Penttonen et al., 1997). This criterion therefore localized neurons within, above or below the granule cell layer. The second feature utilized the firing rate ratio of the unit between awake period in home cage and non-REM sleep (NREM) (Figure 1D; see also below). The third feature was based on a principal component classification of the second derivative of the unit waveforms (Figure 1E; Figure S3A-C). These three sets of features were then used to segregate two groups by a second principal component analysis. The marginal distribution along the 1st component showed a well-segregated bimodal distribution. K-means clustering on the three sets of features reliably segregated excitatory neurons as putative granule cells (n = 586) and putative mossy cells (n = 500) (Figure 1F).
Using the DS2 polarity reversal as a depth landmark, we could quantify the vertical position of recorded putative granule cells and mossy cells. This analysis revealed that putative mossy cells were located significantly deeper than granule cells (Figure 1G). Next, we examined the depth profile of the average waveforms of putative granule cells and mossy cells. Because the recording sites of the silicon probe shanks were placed parallel to the somatodendritic axis of the granule cells and perpendicular to that of the mossy cells, we expected to observe the somatodenritic backpropagation of action potentials for granule cells but not for mossy cells. Indeed, the spikes of granule cells showed a delay from the soma to the proximal dendrites (corresponding to ~ 0.2–0.3 m/s, Krueppel et al., 2011), whereas no such delays were observed in putative mossy cells (Figure S3D-F). Overall, the waveform of granule cells was narrower, they fired less during waking compared to mossy cells and the cell bodies of granule cells were located above those of mossy cells.
Optogenetic validation of the physiology-based separation of granule cells and mossy cells
To confirm the physiology-based separation of granule cells and mossy cells, we used optogenetic methods (Figure S1). For mossy cell identification, we used DRD2-Cre mice as DRD2 (Dopamine Receptor D2) expression is specific to mossy cells but is not expressed in granule cells (Puighermanal et al., 2015). We crossed DRD2-Cre mouse line with Ai35 mouse line to express Archaerhodopsin (Arch)-GFP selectively in DRD2 neurons in a Cre-dependent manner. In double transgenic DRD2-Cre∷Ai35 mice, 29 out of 107 putative mossy cells were light responsive (Figure 1H; Figure S1C, D), whereas only eight of 68 w-I interneurons and none of the putative granule cells (n = 202) or n-I interneurons (n = 69) were suppressed significantly by green light (Figure S1D). Light-induced decrease of firing rate of the minority of w-I interneurons could reflect disfaciliation by the mossy cells or sporadic expression of the DRD2 gene in these neurons (Puighermanal et al., 2015). These results confirm our cell identification based on extracellular electrophysiological features.
In an attempt to identify granule cells by optogenetic means, we used POMC-Cre∷Ai35 mice. A number of putative granule cells could be silenced (Figure S1E, G). However, optogenetic silencing of granule cells also decreased the firing rates of putative mossy cells as well as interneurons, likely due to monosynaptic disfacilitation. Indeed, in monosynaptically connected pairs, green light pulses reduced the firing rates of both presynaptic and postsynaptic neurons (Figure S1E). Thus, optogenetic tagging of granule cells has proven unreliable due to the strong circuit-mediated effects (Buzsaki et al., 2015).
Physiological properties of granule cells and mossy cells
Mossy cells were more active than granule cells during both waking and NREM sleep (Figure S4A, P < 0.0001 for both waking and NREM, Kruskal-Wallis test). Granule cells had their highest firing rates during NREM sleep and similar rates during wake and REM (P < 0.0001; Kruskal-Wallis). Mossy cells were less affected by brain state changes and CA3 pyramidal neurons were most active during wake and least active during REM (P < 0.0001, Kruskal-Wallis test with Bonferroni post hoc test P < 0.00001; Figure 2A, Figure S4A).
Figure 2. Physiological properties of identified GC and MC.
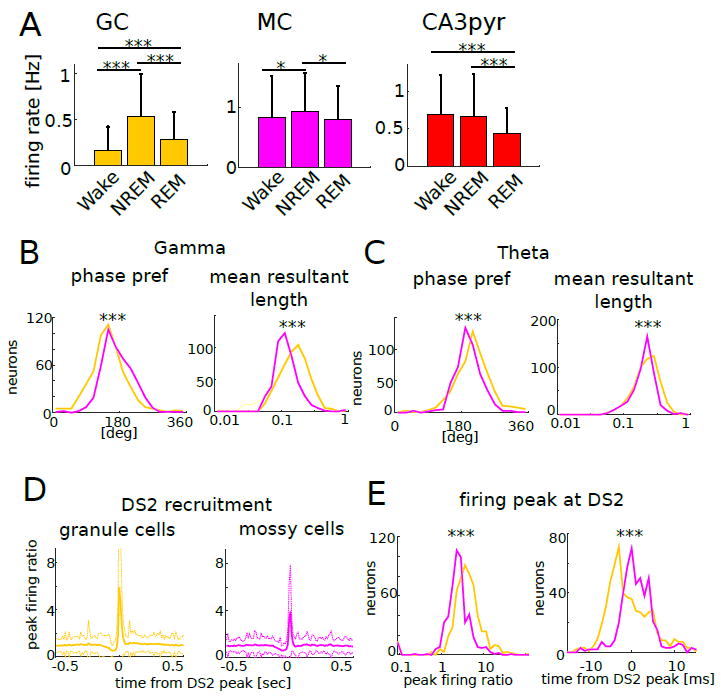
(A) Mean firing rate of each neuron type in different brain states (Wake, NREM, REM). *P <0.05, ***P <0.0001, which applies to all panels in this figure.
(B) Phase preference of individual units (left) and the mean resultant length (right) for gamma oscillations.
(C) Phase preference of individual units (left) and the mean resultant length (right) for theta oscillations.
(D) Peri-event time histogram of GC (left) and MC (right) spikes aligned to the time of the peak of DS2 (mean ± s.d.). Peak firing ratio was calculated by dividing peak firing rate by baseline rate.
(E) Left: distribution of peak firing ratios. GC increased their discharge rates during DS2 significantly more than MC (p < 0.0001, Kruskal-Wallis test). Right: distributions of firing peak timing. GC peaked significantly earlier than MC (p<0.0001, Kruskal-Wallis test). Overall, note that GC were more effectively modulated by gamma, theta oscillations and DS2 compared to MC.
Granule cells fired on earlier phases of gamma waves (P < 0.0001, Kruskal-Wallis test) and later phases of theta oscillations (P < 0.0001, Kruskal-Wallis test) compared to mossy cells. Granule cells were more strongly phase-modulated by both gamma (P < 0.0001; Kruskal-Wallis test) and theta (P < 0.0001; Kruskal-Wallis test) oscillations (Figure 2B, C, Figure S4C-F) compared to mossy cells. Interestingly, slow firing neurons had stronger phase coupling to gamma waves than fast firing cells (granule cell: r = -0.176, P < 0.0001; mossy cell; r = -0.184, P < 0.0001). Granule cells were also more effectively recruited to LFP DS2 than mossy cells (Figure 2D, E; P < 0.0001, Kruskal-Wallis test) and fired earlier (Figure 2E; P < 0.0001, Kruskal-Wallis test).
Granule cell-mossy cell spike transmission
Monosynaptic connections between simultaneously recorded units were detected by cross-correlation methods (Figure 3). Connections between granule cells and mossy cells showed characteristic monosynaptic delays of 1.5 to 3 ms (Figure 3A). The spike transmission probability between excitatory neuron pairs determined that 5.5% of the granule cells monosynaptically excited mossy cells (n = 32 pairs), whereas no mossy cell significantly excited putative granule cells (Figure 3A, B, C). Granule cells resided 59±35 μm above their driven mossy cell partners (Figure 3B, D). Mossy cells excited equal proportions of the narrow and wide waveform interneurons, whereas granule cells preferentially excited narrow waveform interneurons (Figure 3C).
Figure 3. GC-to-MC spike transmission.
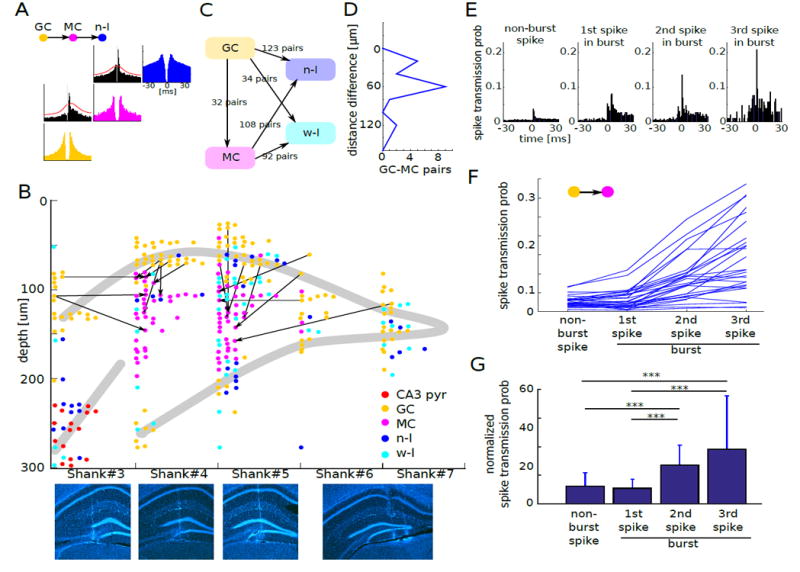
(A) Cross-correlation histogram of an example GC-MC putative monosynaptic pair. MC also showed putative monosynaptic connection to an n-I cell, implying its excitatory nature. Red lines in the cross-correlation histogram mark the statistical threshold for significant detection of outliers from baseline (STAR Methods). Auto-correlograms for each cell type are shown in color as in Figure 1.
(B) Example session of GC-MC putative monosynaptic pairs. Direction of excitatory drive in the cross-correlogram is shown by arrow. Note that arrow direction is toward the hilus of the dentate gyrus, indicating granule cell to mossy cell excitation. Bottom: coronal sections show tracks of each shank (DAPI, blue).
(C) Summary of putative monosynaptic connections among DG units (n = 13 mice).
(D) Distance of cell body locations of monosynaptically connected GC-MC pairs. Depth 0 corresponds to the location of GC. Note that all putative mossy cells reside below the driver granule cell.
(E) Cross-correlation histogram of an example GC-MC putative monosynaptic pair with non-burst spikes, 1st spike, 2nd spike and 3rd spike in bursts.
(F) Change of spike transmission probability as a function of spike order in bursts.
(G) Change of spike transmission probability relative to the baseline as a function of spike order in bursts. ***P < 0.001. These findings demonstrate the strongly potentiating nature of GC-MC synapse.
Since previous work indicated that mossy terminals are strongly potentiating (Henze et al., 2002; Lysetsky et al., 2005; Vyleta et al., 2016), we examined spike transmission probabilities between first and second spikes of granule cell bursts and mossy cell spikes. Spike transmission probability increased from first to second spike (Figure 3E-G), in line with the potentiating nature of mossy synapses. This physiological coupling also reduced the possibility that the putative mossy cells were semilunar granule cells (Williams et al., 2007) since the latter cell type does not receive large mossy synapses (Amaral, 1978).
In addition to monosynaptic connections, we detected narrow large peaks with < 1 ms latency in the spike cross-correlograms of mossy cell pairs, CA3 pyramidal cell pairs and mossy cell–CA3 pyramidal cells pairs (sometimes referred to as ‘zero time lag’ pairs; Diba et al., 2014; Figure S5A). Only <0.2% of granule cell pairs showed significant peaks at < 1 ms while 23% of mossy cells and 9% of CA3 pyramidal cells showed synchronous (< 1 ms) co-activation (Figure S5B). Importantly, the peak delays predictably increased with distance between the recordings shanks in the medio-lateral direction and they were significantly correlated with each other (Figure S5C: R = 0.50, p < 0.001). The most parsimonious explanation of these findings is that the synchronous co-activation of neurons with ‘zero’ (< 1 msec) time lags were brought about by excitation of the neuron pairs by their shared granule cells. In support of this hypothesis, these short delays correspond to the speed of action potential propagation of mossy fibers (Figure S5C, ~1 m/s; Langdon et al.1993). These results demonstrate that discharge of a single granule cell can bring about super-synchronous discharge (<1 ms) among two or more of its target mossy cells and CA3 pyramidal neurons. Subsequent spikes of a burst are especially effective in inducing super-synchrony.
State-dependent changes in spike transmission probabilities
To assess the state-dependent changes in spike transmission probabilities, we calculated the peak-to-background firing rate difference of short-time scale cross-correlograms (Fujisawa et al., 2008) between principal cells and interneurons and between granule cells and mossy cells. Granule cell to mossy cell and granule cell to interneuron comparisons showed reduced probability of spike transmission during NREM compared to wake (Figure 4A, B). Mossy cell to interneuron transmission was not changed, whereas spike transmission between CA3 pyramidal cell–interneuron pairs increased (Figure 4C, D). Moreover, the ‘zero’ time lag peaks of mossy cell pairs and CA3 pyramidal cell pairs were smaller during NREM than waking (Figure 4E, F). These findings imply stronger synaptic efficacy from granule cells to mossy cells during wake compared to NREM sleep.
Figure 4. State-dependent changes of unit-unit interactions in DG and CA3.
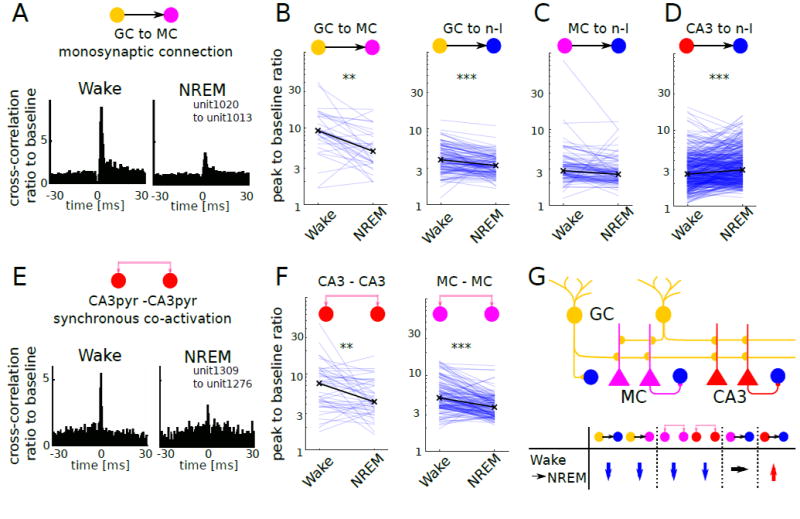
(A) Example GC–MC putative monosynaptic pair shows the decreased spike transmission probability during NREM compared to wake.
(B) GC–MC (left) and GC–n-I (right) monosynaptic pairs show significant decrease of spike transmission probability during NREM (GC–MC: n = 31, P < 0.005; GC–nI: n = 120, P < 0.0001, Wilcoxon signed rank test). Black x: median for each state. ***P < 0.0001, **P < 0.005
(C) MC–n-I monosynaptic pairs (n = 98, P = 0.13, Wilcoxon signed rank test).
(D) CA3 pyramidal–n-I pairs (n = 408, P < 0.0001, Wilcoxon signed rank test).
(E) Example of CA3pyr–CA3pyr synchronous co-activation shows decreased co-activation during SWS compared to wake.
(F) CA3pyr–CA3pyr co-activated pairs (n = 47, P < 0.005, Wilcoxon signed rank test) and MC–MC co-activated pairs (MC–MC: n = 136, P < 0.0001, Wilcoxon signed rank test).
(G) Schema of DG-CA3 local circuit and summary of the state-dependent changes of unit-unit interactions.
Spatial and memory properties of granule cells and mossy cells
The behavioral correlates of dentate-CA3 neurons were investigated in a circular T-maze (Figure 5A) and an open field platform (Figure S6A). The fraction of active neurons (> 1 Hz) was significantly higher in the central arm compared to the side arms (Figure 5B, Figure S6B; P < 0.00001 for all three cell types; Kruskal-Wallis test). Most granule cells had no place field or just one and only a small fraction (6.6% of recorded cells) had two or more. In contrast, 57.8% of mossy cells and 36.1% of CA3 pyramidal neurons had two or more place fields (Figure 5C, D; P < 0.0001; Kolmogorov-Smirnov test). Of the three neuron types, granule cells had the lowest within-place field peak firing rates (Figure 5E; GC vs MC, P < 0.003, Kolmogorov-Smirnov test) and lowest spatial information (bits/s; Figure 5F; P < 0.0005, Kolmogorov-Smirnov test). The differential firing rates of some neurons in the central arm reliably predicted the future turns of the animal (‘splitter’ cells; Woods et al., 2000). The fraction of splitter cells was comparable in the three principal cell groups (Figure S6C, D).
Figure 5. Spatial correlates of GC, MC and CA3 pyramidal cells.
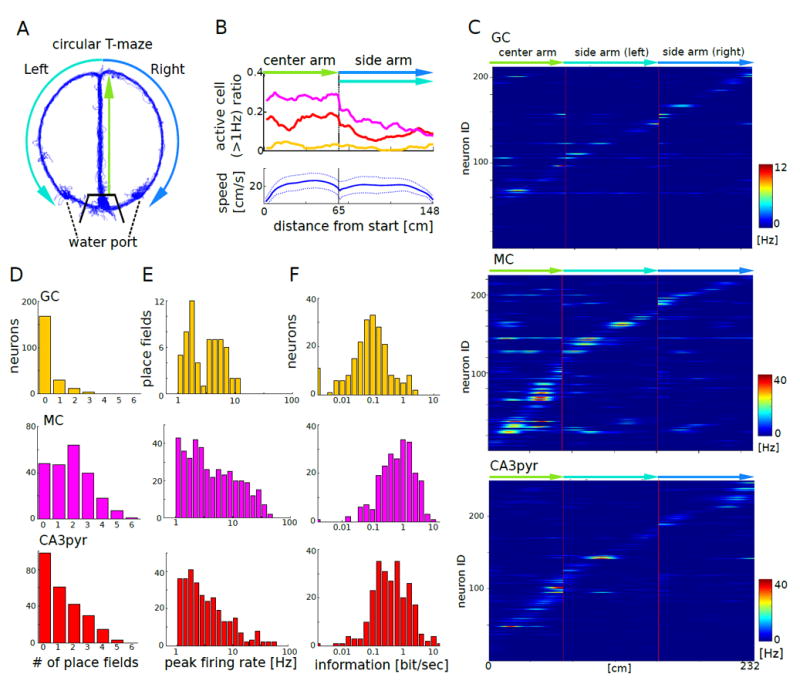
(A) Travel trajectory of a mouse on the circular T–maze (blue). Thick black lines indicate the gates surrounding the waiting area.
(B) Top: fraction of GCs (yellow), MCs (magenta), and CA3pyr (red) active (>1Hz) at each location of the linearized maze. Bottom: running speed (mean ± s.d.).
(C) Firing patterns of GCs (top, n = 213), MCs (middle, n = 225), and CA3pyr (bottom, n = 249) on the linearized maze (n = 9 mice. Each row represents the position-dependent firing rate of a single neuron.
(D) Distribution of the number of place fields of GCs (top), MCs (middle), and CA3pyr (bottom; P<0.001, Kolmogorov-Smirnov test).
(E) Distributions of within-place field peak firing rates (bottom). The distributions were significantly different between GC and MC (P = 0.003, Kolmogorov-Smirnov test) and between MC and CA3pyr (P < 0.001).
(F) Distributions of information measure (bit/s). All comparisons were significantly different from each other (P < 0.001, Kolmogorov-Smirnov test).
To examine the pattern separation properties of granule cells, mossy cells and CA3 pyramidal neurons, mice were first tested on a rectangular open field with walls (maze A) (artificial leather floor, words on walls, and cereal as food reward), followed by testing in maze B (plastic floor with electrical tape grid, white stripes on walls, and chocolate as food reward) and again in maze A’ (Figure 6A; Figure S6A). We first examined remapping properties of individual neurons by comparing pixel-by-pixel correlations between maze A and maze B (Figure 6B; Figure S7A-F). A ‘remapping index’ was calculated as the difference in correlations between AA’ and the average of AB and BA’. For neurons with significant place fields (within-session stability index ≥ 0.5, place field size ≥ 100 pixels [9 × 9 cm2] and peak firing rate ≥ 1 Hz), the remapping index was significantly higher than zero in each group (GC, P < 0.05; MC, P < 0.00001; CA3, P < 0.00001; Wilcoxon signed rank test) but granule cells showed less remapping compared to mossy cells (Figure 6C, D, P = 0.034; Kruskal-Walls test with Bonferroni post hoc test; GC vs MC P = 0.028). Neurons with values ≥ 0.2 were classified as remapping neurons. By these criteria, only a minority of granule cells (36.7%, n = 11 out of n = 30 place cells) showed remapping, whereas the majority of both mossy cells (61.3%, n=68 out of n = 111 place cells) and CA3 pyramidal neurons (55.6%, n = 80 out of n = 144) did (Figure 6C).
Figure 6. Place field remapping of GC, MC and CA3 pyramidal cells in different mazes.
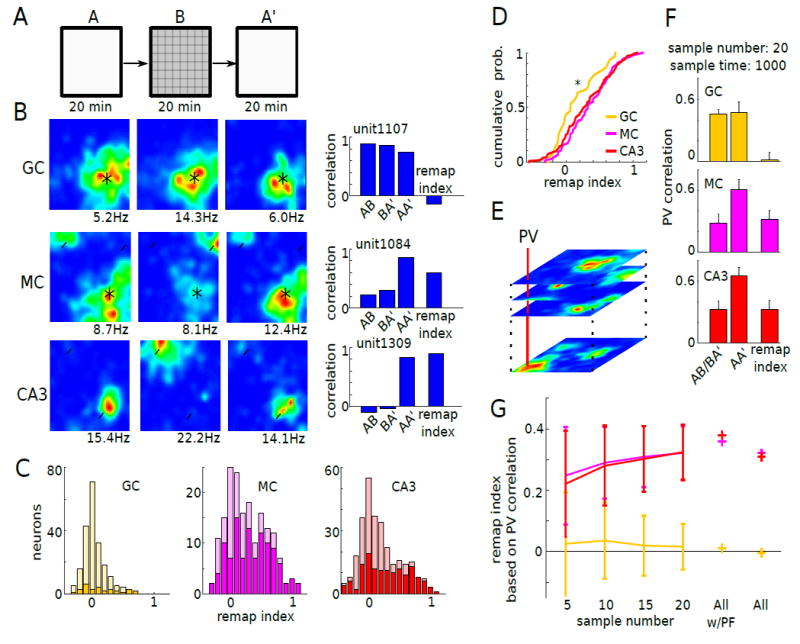
(A) Mice were tested first in open field A for 20 minutes, then in open field B in the same room for 20 minutes, and again in open field A (A’). Open field A and B had the same size but were made from different materials with different textures.
(B) Left: firing rate maps of example GC (top), MC (middle), and CA3pyr (bottom) in A, B and A’. Right: correlation of firing maps in A–vs–B, B–vs–A’, and A–vs–A’ for the example units. Place field remapping index was calculated by subtracting the mean of the AB and BA’ correlations from the AA’ correlation. Black asterisk: place fields observed both in A and B. White arrow head: place fields observed either in A or B.
(C) Distribution of the remapping index of GCs (left, n = 247), MCs (middle, n = 181), and CA3pyr (right, n = 317; n = 5 mice). Bright colors indicate units with significant place fields (GC: n = 30, MC: n = 111, CA3pyr: n = 144).
(D) GCs with stable place fields had significantly lower remapping index compared to MCs and CA3pyrs with stable place fields (P = 0.033, one-way Kruskal-Wallis test with Bonferroni post hoc test; P = 0.028).
(E) The rate maps of units of the same cell types were stacked into 2500 (50 x 50 pixels) population vectors (PVs; as in Leutgeb et al., 2007).
(F) PV correlation was calculated for AB, BA’ and AA’ for GCs (top), MCs (middle), and CA3pyr (bottom). For calculating PVs, rate maps of 20 units randomly selected from all units with stable place field were stacked. Random sampling was performed 1000 times iteratively for place field shift score calculations.
(G) Remapping index was calculated based on PVs with sets of different sample numbers (n = 5, 10, 15, 20). Remapping index scores, calculated based on PV for all units or all units with stable place fields, are marked by +. Place fields of MCs shifted more compared to those of GCs. All w/PF: all units with place fields.
We also examined the population vector correlations across the different mazes (A vs B) and compared the changes with the vector correlations obtained within the same maze upon repeated testing (A vs A’) (Figure 6E). For these analyses, we included neurons with significant place fields. Due to the small number of granule cells with place fields, we performed downsampling for population vector analysis to equalize the numbers of cells across categories. After iterative random sampling of 20 place cells for constructing a population vector, population vector correlations between AB/BA’ versus AA’ were calculated to obtain a remapping index. The magnitude of population remapping was significantly smaller for granule cells compared to mossy cells and CA3 pyramidal cells (P < 0.00001; Kruskal-Wallis test with Bonferroni post hoc; P < 0.00001; Figure 6F). These results remained robust within a range of threshold values with different numbers of neurons comprising the population vector (P < 0.00001 for n = 5, 10, 15, 20 sampling number, Kruskal-Wallis test with Bonferroni post hoc; P < 0.05; Figure 6G). Overall, these findings demonstrate that mossy cells show robust sensitivity to environmental changes, more so than granule cells.
Transmission of place information between granule cells and mossy cells
Because the dendrites of mossy cells in rodents are largely confined to the dentate hilus (Amaral, 1978; Scharfman, 1991), spatial information may be conveyed to them by the granule cells. Monosynaptic connections between granule cell-mossy cell pairs (n = 18 in the T–maze; Figure 7A), identified by the significant spike transmission probability histograms, offered an opportunity to examine the inheritance of spatial information between them. One granule cell was connected to 3 mossy cells and two pairs of granule cells converged on one mossy cell each (Figure 7A). Eleven of the 18 granule cells with postsynaptic partners had no place fields in the T-maze even though the postsynaptic partner mossy cells had place fields. Conversely, the remaining granule cells that had place fields were often different from the place fields of their partner mossy cells. Across 10 place fields from granule cells and 48 place fields from mossy cells, only two place fields showed overlap between monosynaptically connected pairs (Figure 7B). Within putatively driven place fields, we found that the postsynaptic mossy cell also fired on those trials in which the presynaptic granule cell was silent (Figure 7C-E). To examine the effect of the presynaptic granule cell on the postsynaptic mossy cell firing, pixel-by-pixel correlation of the place field of the presynaptic granule cell was calculated on a trial-by-trial basis. This comparison did not show a significant correlation (Figure 7F; n = 10 place fields, r = −0.020 ± 0.232; P = 0.77, Wilcoxon signed rank test).
Figure 7. Spatial correlates of the monosynaptically connected GC–MC pairs.
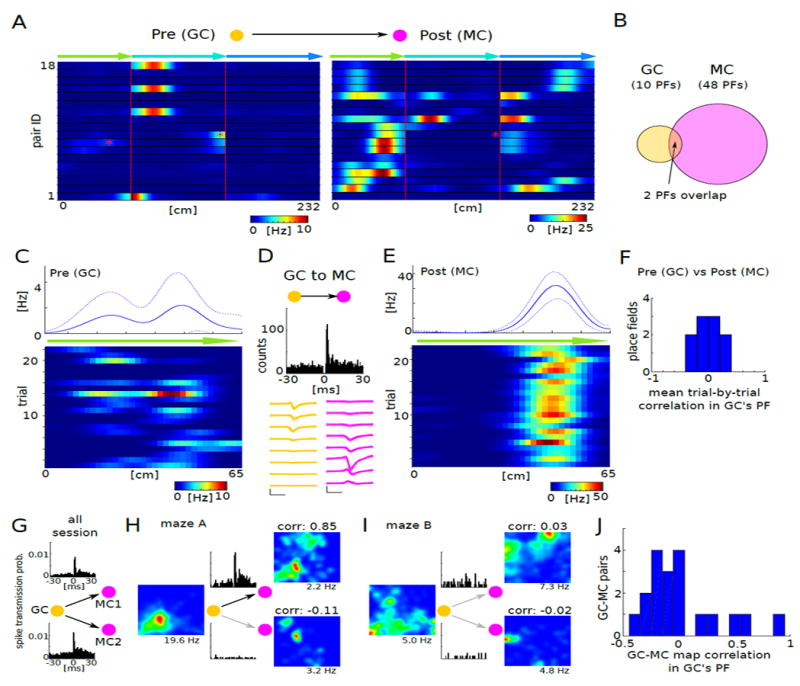
(A) Firing patterns of 18 monosynaptically connected GC–MC pairs (between 16 GC and 17 MC) on the linearized maze. Red asterisks indicate the overlapping place fields of two GC–MC pairs.
(B) Only 2 place fields (PF) showed overlap between GC and MC. Of the 18 GC partners of the monosynaptically connected pairs, only 10 had place fields. In contrast, 18 MC had 48 place fields.
(C,E) Firing rate maps of the pre- and postsynaptic members of a GC–MC pair in the center arm of the maze (top, mean ± s.d.). Bottom: firing patterns of the same neurons, color-coded for each trial.
(D) Cross-correlogram between GC in (C) and MC in (E) shows putative monosynaptic connection. Bottom: average waveform (mean ± s.d.) of the GC and MC.
(F) Correlation of firing rate maps between GC and MC was calculated on a trial-by-trial basis at the locations where GC had place fields. Note median correlation around 0 (P = 0.77, Wilcoxon signed rank test).
(G-J) Correlation of firing rate maps between monosynaptically connected GC-MC pairs in open mazes (n = 3 mice). (G) Baseline cross-correlogram of monosynaptically connected GC-MC triplet. (H) Example rate maps in maze a for GC-MC triplet. One pair (GC-MC1) had high (top) and whereas the other pair (GC-MC2) has low (bottom) correlation between rate maps of granule cell and mossy cell within the granule cell’s place field. Insets: Cross-correlogram of GC-MC pairs, with the same scale as in (G). (I) Example rate maps in maze B. (J) GC-MC map correlations of all comparisons in which the presynaptic GC had significant place fields. Note median correlation around 0 (n = 19, P = 0.60, Wilcoxon signed rank test).
We also examined granule cell-mossy cell pairs in the different open mazes. A triplet of monosynaptically connected granule cell with two mossy cell partners are shown in Figure 7G. In maze A, one pair (GC-MC1) showed high pixel-by-pixel correlation between rate maps confined to the place field of the presynaptic granule cell, whereas the other pair of the triplet (GC-MC2) showed a low correlation. In maze B, both GC-MC1 and GC-MC2 pairs showed a low correlation between rate maps. These examples illustrate that place field inheritance depends also on context. For population analysis, we examined the pixel-by-pixel correlation between rate maps of 15 monosynaptically connected granule cells and mossy cells within the place field of the presynaptic granule cell (n = 3 mice; Figure 7J). Of the 75 comparisons (n = 15 GC-MC pairs, each pair was tested in 5 sessions in different mazes and different rooms), the presynaptic granule cells had 19 place fields. In this 19 granule cell-mossy cell pair subset, only 2 had correlation higher than 0.5 between the maps of the presynaptic granule cell and postsynaptic mossy cell. Overall, these findings demonstrate that inheritance of spatial information from a single granule cell to mossy cells is rare and, therefore, the firing pattern of a single presynaptic granule cell cannot fully explain the position-related firing of its postsynaptic mossy cell partner.
DISCUSSION
We developed a neurophysiology-based classification method to conclusively identify dentate granule cells and mossy cells in neural data acquired from freely moving mice. These two excitatory cell types can first be distinguished from dentate gyrus interneurons based on their wide action potential waveform and increased tendency to burst firing. Three main characteristics then separated the excitatory neurons into granule cells and mossy cells: i) cell body location relative to the reversal of the DS2; ii) relative firing rates in NREM and waking states; iii) waveform shape. Granule cells had cell bodies located near the depth of DS2 reversal, had increased firing in NREM compared to waking, and had a sharper waveform. In contrast, mossy cells were located well below the depth of the DS2 reversal, had equivalent firing rates in NREM and waking, and had a more symmetric waveform. We validated these physiological characteristics with optogenetic methods, establishing firm criteria for granule cell and mossy cell identification in vivo. Our classification method allowed us to investigate how these cell types interact and encode spatial information. Granule cells were typically low firing, had a single place field, and showed minimal remapping across different contexts in the same room, whereas mossy cells were higher firing, had two or more place fields, and remapped more strongly. Furthermore, despite the strongly facilitating nature of granule cell-mossy cell synapses, place fields of most mossy cells could not be explained by the ‘inheritance’ of place fields from single granule cells.
Differential context-sensitivity of granule cells and mossy cells
The hypothesized function of the low convergence and divergence of granule cells onto CA3 pyramidal cells is to disperse (“orthogonalize” or separate) the entorhinal information onto the extensive recurrent system of CA3 neurons during the encoding of memories and provide sparse representation (Hasselmo and Wyble, 1997; McNaughton and Morris, 1987; Treves and Rolls, 1994; Rolls and Kesner, 2006; but see Nakashiba et al., 2012). In support of this hypothesis, damage to the dentate gyrus diminishes the animals’ ability to distinguish between similar environmental contexts, supporting its role in pattern separation (Gilbert et al., 2001; McHugh et al., 2007; Hunsaker et al., 2008; Kim and Lee, 2011; Nakashiba et al., 2012). During retrieval of memories, the auto-associative CA3 recurrent system can recover the whole memory representation from partial or fragmented information (“pattern completion”) (McNaughton and Morris, 1987; Hunsaker et al., 2008; Nakashiba et al., 2012). In addition, the sparse convergence of granule cell–CA3 pyramidal cell connections and the postulated sparse firing of granule cells provide an ideal mechanism for increasing the storage capacity of the hippocampus (Treves and Rolls 1994; Lisman 1999).
Understanding how pattern separation is accomplished by the neurons of the dentate gyrus has been limited by conflicting results regarding the physiological characteristics of its main cell types. Theoretically, granule cells with sparse activity, low firing rates, and single place fields are most consistent with a role in pattern separation, and our observations support attribution of these characteristics to granule cells. Our findings are in agreement with those of others that show that the majority of granule cells are silent during waking (Jung and McNaughton, 1993; Gothard et al., 2001; Neunuebel and Knierim, 2012, 2014; Danielson, 2016; Diamantaki et al., 2016). Furthermore, we found that if granule cells have place fields, they are typically single, with peak firing rates less than half of those of CA3 and mossy cells. Such results are in keeping with Neunuebel and Knierim (2012), who distinguished between dentate neurons with single and multiple place fields, tentatively classifying neurons with single place fields as granule cells. Although all hippocampal place cells can have multiple place fields, granule cells are thought to have the least number of double or multiple place fields. However, other reports have attributed different physiological features to granule cells. J. Leutgeb et al (2007) reported that the majority of their 67 granule cells were active during waking, with single or multiple place fields (16 single, 13 double, 8 triple, 4 quadruple fields), and peak firing rates comparable to those of CA3 pyramidal cells. Similarly, Jung and McNaughton (1993) reported that granule cells had multiple place fields. Following these reports, several computational models of the dentate gyrus reproduced these proposed environment-dependent firing patterns in their pattern separation algorithms (de Almeida et al., 2009; Ujfalussy et al., 2009; Si and Treves, 2009). We believe that the discrepancy between previous experimental studies and our current results can be explained by assuming that the previous reports recorded from a mixed population of mossy and granule cells and/or did not effectively separate single granule cells. In support of this notion, nearly all features previously attributed to granule cells in those studies appear to be characteristic properties of mossy cells in our study, including their ability to robustly remap in response to changing the shapes of the testing apparatus in the same room.
A consistent feature of place cells is that they change their spatial tuning to changes in environmental context, known as remapping (Leutgeb et al., 2005; Muller and Kubie 1987). Our experiments examined the response of dentate neurons to different testing apparatuses in the same room, and found that granule cells exhibited only modest place field shifts, whereas mossy cells and CA3 pyramidal neurons were more likely to remap. In contrast, granule cells can have strong remapping when tested in different rooms, with individual neurons firing only in a single room (GoodSmith et al., 2016). We hypothesize that this differential remapping of granule cells in same vs. different room occurs because these cells are strongly influenced by head directions neurons, which are known to be under the control of distal cues (Knierim et al., 1995; Yoganarasimha and Knierim, 2005). Grid cell firing of entorhinal cortical neurons depends on the integrity of the head direction system (Winter et al., 2015), and, in turn, granule cells are strongly controlled by highly active layer II entorhinal neurons (Isomura et al., 2006; Mizuseki et al., 2009), a notion supported by their robust response to the DS2. According to this hypothesis, granule cells are anchored to room locations (distal cues) by a static orientation of the head direction system, despite exposure to new apparatuses (local cues). When the orientation of the head direction system changes in different rooms, global remapping occurs and different sets of granule cells become active.
Because we observed that mossy cells and CA3 pyramidal cells remap more strongly than granule cells in different apparatuses in the same room, we hypothesize that these neurons are controlled more effectively by local cues (Lee et al., 2004), possibly driven by lateral entorhinal inputs. How do mossy cells and granule cells interact to perform pattern separation across various contexts? The selective degeneration of mossy cells results in increased firing of granule cells and impaired contextual discrimination (Jinde et al., 2012). We similarly demonstrated in our optogenetic experiments that silencing of DRD2 (mossy) cells was accompanied by increased firing of the granule cell population. Because mossy cells exert strong disynaptic feed-forward inhibition on granule cells (Buzsaki and Czeh, 1981), a main function of mossy cells may be to selectively amplify the granule cell outputs by local feedback excitation and keep ‘off-beam’ granule cells silent (Buckmaster et al., 1996) so that sparse activation can be sustained in the background of strong entorhinal cortex input activation. In such an intertwined system, granule cells and mossy cells likely work in tandem, with their interaction allowing appropriate mixing of distal and local representations, enabling them to separate both environmental contexts and prominent local cues.
Granule cell–mossy cell spike transmission
To further examine the granule cell-mossy cell interaction, we examined the transmission of spikes and spatial information between anatomically connected pairs of these neurons. Because granule cells fire sparsely and their anatomical convergence is very low, the likelihood of coincident firing of granule cells with a common target is believed to be extremely low (McNaughton and Nadel, 1990; Danielson et al., 2016), except during DS2 (Bragin et al., 1995). Therefore, a different mechanism must allow granule cells to drive mossy cells. One such postulated mechanism is that single granule cells effectively discharge their mossy cell targets via highly effective ‘detonator’ mossy terminals (McNaughton and Nadel, 1990; Henze et al., 2002). In support of this hypothesis, we found that spike transmission probability between granule cell-mossy cell pairs was relatively high, though variable. This high efficacy of spike transmission stands in sharp contrast to CA3-CA1, CA3-CA3 or neocortical pyramidal cells pairs, where spike transmission between these cells is exceptional (Csicsvari et al., 2003; Fujisawa et al., 2008). We also found that increasing numbers of granule cell spikes rapidly enhanced synchronous discharge of postsynaptic mossy cells and CA3 pyramidal cells (Figure 3E, F), consistent with a strongly potentiating mossy synapse (Henze et al., 2002; Vyleta et al., 2016; Figure 3E-G). These results suggest that granule cell-mossy cell interactions are a key component of computation performed by the dentate gyrus.
Given the effectiveness of spike transmission between granule cells and mossy cells, it could be expected that place preferences would be conserved between synaptically connected pairs. However, we found that, the place fields in the majority of monosynaptically connected granule cell–mossy cell pairs were rarely correlated. Even in the few pairs with overlapping place fields, the trial-to-trial comparison showed that the postsynaptic mossy cell was capable of firing spikes when its presynaptic granule cell was silent, suggesting that other source(s) rather than a single granule cell input was responsible for its place-related discharge. To explain our data, one needs to assume that two, or potentially more, granule cells with overlapping place fields participate in driving mossy cell place fields. Because of the low anatomical convergence of granule cells outputs, an additional assumption is that granule cells innervate their targets in a highly non-random manner (Deguchi et al., 2011). Alternatively, place information may be conveyed to mossy cells by the CA3c recurrent system (Scharfmann 1994; 2007; Scharfmann et al., 2001) and, in turn, secondarily affect granule cells (Lisman 1999).
Overall, our findings suggest that pattern separation in the dentate gyrus may be accomplished by interactions of independently modulated granule cells and mossy cells (Myers and Scharfman, 2009), which may have complementary separation properties for distal and local cues. Granule cells may ‘inherit’ spatially-invariant inputs from medial entorhinal grid cells (Hafting et al., 2005), making them most responsive to distal cues. Mossy cells and CA3 neurons may be additionally influenced by lateral entorhinal inputs, introducing responsiveness to local cues. Furthermore, place preferences may not be always transmitted directly from synaptically connected granule cells and mossy cells, enhancing the complexity of place representation within the dentate gyrus network. Experiments manipulating upstream inputs carrying spatial information and simultaneously monitoring physiologically-identified granule cells, mossy cells and CA3c pyramidal cells are necessary to test these hypotheses.
STAR Methods
CONTACT FOR REAGENT AND RESOURCE SHARING
Further information and requests for reagents and resource may be directed to, and will be fulfilled by the lead contact, Dr. György Buzsáki (gyorgy.buzsaki@nyumc.org).
EXPERIMENTAL MODEL AND SUBJECT DETAILS
We used several lines of transgenic mice (n = 7 SST-Cre, n = 5 DRD2-Cre∷Ai35, n = 3 POMC-Cre∷Ai35; and 1 wild type) for optogenetic tagging of recorded units (Table S1). To obtain expression of channelrhodopsin-2 (ChR2; Boyden et al., 2005) or archaerhodopsin-3 (Arch; Chow et al., 2010; Mattis et al., 2012), SST-Cre mice were injected with either AAV5-EF1a-DIO-hChR2(H234R)-EYFP-WPRE-pA (n = 6 mice) or AAV5-EF1a-DIO-eArch3.0-EYFP (n =1 mouse), respectively (University of North Carolina Vector Core). Virus injection was performed at anteroposterior: -1.9mm mediolateral: -1.2mm dorsoventral: -1.9, -2.1, -2.3mm with Nanoject II Auto-Nanoliter Injector (Drummond) for 300 nl volume in total, 100nl/2 min per site 2 to 4 weeks before starting experiments to obtain sufficient level of expression of ChR2 or Arch. In n = 5 DRD2-Cre∷Ai35 mice and n = 3 POMC-Cre∷Ai35 mice, Arch-GFP fusion gene was expressed in a Cre-dependent manner (Table S1). Male mice were used for all experiments.
METHOD DETAILS
Electrode implantation and surgery
All animal handling procedures were approved by the Institutional Animal Care and Use Committee of New York University Medical Center. 16 male mice (24-44 gr, 3-11 months old) were implanted with recording electrodes under isoflurane anesthesia as previously described (Stark et al., 2012). Silicon probes (NeuroNexus, Inc.) were mounted on movable microdrives for recording the activity of multiple single-units and local field potentials (LFPs) in the dentate gyrus (DG). One or two optical fibers were attached to the probe shanks (Royer et al., 2010), terminating in a tip etched to a point above electrode sites. The back end(s) of the fiber(s) were coupled to laser diodes (Stark et al., 2012; 450 nm blue or 520 nm green, Osram Inc.).
The high-density silicon probes consisted of 6 or 8 shanks (200-μm shank separation) and each shank had 8 (8-shank probes, Buzsaki64) or 10 recording (6-shank probes, Buzsaki64sp) sites (160 μm2 each site, 1–3-MΩ impedance), staggered to provide a two-dimensional arrangement (20-μm vertical separation). The probes were implanted either parallel to the longitudinal axis (n = 6 mice) or perpendicular to the longitudinal axis (transverse axis, n = 9 mice) with the center of the probe at anteroposterior: -1.9mm, mediolateral: -1.6mm (n = 7 mice) or -1.2mm (n = 8 mice) dorsoventral: -1.0mm from bregma. In one mouse, a 32-site linear probe (50 μm vertical tip separation) was implanted at anteroposterior: -1.9mm mediolateral: -1.2mm from bregma to record dentate spike 2 (DS2) amplitude profile along the dorso-ventral axis of the dentate gyrus. In all experiments, ground and reference screws or 100-μm diameter tungsten wires were implanted in the cerebellum. After 4 to 7 days of the recovery period, the probes were slowly lowered until reaching the dentate hilus, characterized by the positive amplitude of DS2. After each recording day, the silicon probe was moved 70 μm to record from new positions across the two blades of the granule cell layer. The mediolateral position of each shank was determined by subsequent histological analysis of the brains.
Data acquisition
During the recording session, neurophysiological signals were acquired continuously at 20 kHz on a 256-channel Amplipex system (Szeged; Hungary; 14-bit resolution, analog multiplexing; Berényi et al., 2014). The wide-band signal was down-sampled to 1.25 kHz and used as the LFP signal. For tracking the position of the animals, two small light-emitting diodes (LED; 5-cm separation), mounted on the headstage, were recorded by a digital video camera at 30 frames per s. The LED locations were detected online and resampled at 39 Hz by the acquisition. Spike sorting was performed semi-automatically, using KlustaKwik (Harris et al., 2000) (http://klustakwik.sourceforge.net/). This was followed by manual adjustment of the waveform clusters using the software Klusters (Hazan et al., 2006).
Behavioral procedures
Nine mice were water deprived until their body weight decreased by 15 to 20% before training. They were trained in a spontaneous side alternation task on a circular T-maze (65 cm central arm, 102 cm left side arm, 102 cm right side arm) for water reward at the water port located at the point 18 cm from the end of the side arms. 10 μl water was delivered on correct trials. After mice returned to the waiting area, the gates were closed and opened immediately on pretraining session. After mice reached performance rate of 90% or better, a 10-s wait period was introduced in the waiting area. Physiological recordings were performed while mice performed the spontaneous alternate task. T-maze behavior was controlled by Arduino MEGA 2560 (Arduino) and RP2.1 Real-Time Processor (Tucker-Davis Technologies) with infrared sensors (Omron), motors for opening and closing the gates and activating solenoids for water delivery.
Six mice also explored two familiar open fields in the same room for food reward. The open field was a 46x46cm square arena surrounded by 21-cm-high, black walls. Open field A had a black artificial leather floor and black plastic walls on which words were taped (Figure S6a). Open field B was placed in the same place as the open field A. Open field B had black plastic floor with black stripes taped in a grid manner and black plastic walls on which white lines were taped. The mice explored the open fields in the order of A – B – A’ for 20 min each, separated by 5 min breaks in the home cage. Each mouse also explored the open field A and B in another room or in the same room surrounded by the curtain. Data in these additional sessions was used for Figure7H-J.
The exploration phase in the circular T-maze and/or two open environments was preceded and followed by sleep sessions lasting for 2 to 3 hours in the home cage. After post-exploration sleep, light delivery for optogenetic tagging of neurons was performed in the home cage. Recordings were classified into wake, REM and NREM epochs based on theta/delta ratio calculated from the power spectrogram of the dentate hilus LFPs and the movement of the mice (Stark et al., 2014).
LFP analysis
Dentate spike 2 (DS2) was first detected as the period when the difference of the band pass filtered (2-50Hz) LFP recorded from a hilus location and molecular layer site exceeded 1.14mV. If the mean LFP value at the molecular layer during the DS2 was lower than the baseline value (−36 ms to −16 ms) by > 0.19mV, the DS2 passed the criteria and included for later analysis. Peak time of DS2 was defined as the time when the dentate hilus wide-band LFP showed maximum value.
Unit firing modulation by LFP
For analyzing the spike firing modulation by theta (4-10Hz) and gamma oscillations (30–80Hz), only periods with oscillation amplitude higher than criteria were used (criteria: median+0.5 s.d. for theta, median+1 s.d. for gamma). Only units which passed Rayleigh’s test of nonuniformity (α < 0.05 and κ> 0.1) were included for the analysis for phase modulation. The magnitude of phase modulation of units by theta or gamma oscillations was quantified by the mean resultant length (MRL). MRL is the length of the average of vectors on the unit circle, where the length of each vector is proportional to the firing count on each phase angle.
Optogenetic tagging of neurons
Peak light power, measured at the tip of the shanks before implantation, was 1 to 4 mW (450nm laser diode and 520nm laser diode). For SST-Cre mice, injected with AAV-EF1a-DIO-ChR2-EYFP, units were identified as SST cells if the PETH triggered by ~1800 repetitions of 10ms light pulses changed the median increased by ≥ 5 standard deviations of baseline post-stimulus event histogram within 5ms after light onset. For a SST-Cre mouse injected with AAV-EF1a-DIO-Arch-EYFP, units were identified the light pulse triggered histogram decreased by more than 50% of the baseline PETH in +2 to +8ms after light onset. For DRD2-Cre∷Ai35 mice, putative mossy cells were identified if the PETH triggered by 60,000-100,000 repetitions of 20ms light pulses decreased by ≥ 20% of the baseline PETH in +2 to +15ms bins. POMC-Cre∷Ai35 was used for identifying granule cells but 1-s light pulses affect the firing of GC and MC in a short latency, which may be caused by strong granule cell to mossy cell synaptic inputs.
Unit classification based on physiological features
Units recorded by medial shanks penetrating granule cell layers, as verified histologically, were classified as ‘dentate’ units. Units recorded by more lateral shanks not penetrating the granule cell layers and those > 200 μm below the granule cell layer on medial shanks were classified as CA3 units (Figure S2). Dentate units were first classified based on the trough-to-peak latency (TP latency) and burst index. Burst index was determined by calculating the average number of spikes in the 3–5 ms bins of the spike autocorrelogram divided by the average number of spikes in the 200–300 ms bins. To calculate the TP latency, the average waveforms were taken from the recording site with the maximum amplitude for the averaged waveforms of a given unit. The same average waveforms were also used for the waveform PCA (see later). Units with TP latency < 0.425ms were classified as narrow-waveform putative interneurons (n-I cells; Figure 1). Wide-waveform units were heuristically classified into putative excitatory cells (E cells; burst index > 1.2) and wide-waveform putative interneurons (w-I cells) based on the bimodality of the marginal distribution for the burst index. CA3 region units were also classified in a similar way into n-I cells (TP latency < 0.525ms), w-I cells (burst index < 0.18 and TP latency > 0.525ms), and E cells (burst index > 0.12 and TP latency > 0.525ms). Criteria for separation were chosen as a trough of the bimodal distribution of each marginal distribution.
In the second stage, excitatory cells (E) of the dentate gyrus were further divided into putative granule cells and mossy cells. First, a PCA was performed on the average E waveforms. Average waveforms were normalized by the peak amplitude and up-sampled to 100kHz with a spline interpolation method. Waveform PCA was performed using the time between 0 to 0.8ms period of the second derivative of the up-sampled average waveform (Figure 1). As a result of the waveform PCA, w-PC1 and w-PC2 were obtained. The amplitude of the LFP DS2 at the recording site where the units’ maximum waveform amplitude was observed was used to estimate the unit’s anatomical location. Third, we calculated the firing rate ratios for each unit between nonREM sleep (NREM) and waking. We classified dentate E cells into two clusters with k-means method based on w-PC1, w-PC2, DS2 amplitude, and the ratio of the firing rate during NREM and waking (Figure 1).
Detection of short-time scale interactions of neuron pairs
Cross-correlograms of spike trains of neuron pairs can reveal putative synaptic connections between them (Barthó et al., 2004; Fujisawa et al., 2008; Stark and Abeles, 2009). This takes the form in the cross-correlogram of short time-lag (1–6 ms) positive or negative deviations from baseline indicating putative excitatory or inhibitory connections, respectively. Such detection is based on testing the null hypothesis of a homogeneous baseline at short time-scale (Stark and Abeles, 2009). To this end, cross-correlograms binned in 0.5-ms windows were convolved with a 10-ms standard deviation Gaussian window resulting in a predictor of the baseline rate. At each time bin, the 99.9999 percentile of the cumulative Poisson distribution (at the predicted rate) was used as the statistical threshold for significant detection of outliers from baseline. A putative connection was considered significant when at least two consecutive bins in the cross-correlograms within +1.5 to +5ms passed the statistical threshold. We also detected short-time scale unit synchronous co-activations if at least two consecutive bins in the cross-correlograms within -1 to +1ms passed the statistical threshold. To estimate the peak time lag at a temporal resolution finer than the bin size (0.5 ms), the center of mass of the bins within ± 1ms from the peak bin was calculated. All detected short-time scale interactions were manually inspected and refined after automatic detections in order to exclude the contamination from the long-time scale trend.
Place fields of dentate units
For the circular T-maze, the time from the gate opening to the arrival to the reward location was included for the analysis. The positions were linearized along the track axis. The position and spiking data were sorted into 0.92 × 0.92 cm2 (open field) or 1.86 cm (circular T-maze) pixels, generating the raw maps of spike number and occupancy. Spike number and occupancy was included in the analysis only when the locomotion speed of mice was more than 3 cm/s. A raw rate map was constructed by dividing the raw spike map by a raw occupancy map. For the circular T-maze, the raw rate map was constructed separately for left and right choice trials to detect choice-dependent firing rate changes in the central arm (Wood et al., 2000; Frank et al., 2000). Within-place field peak firing rate, number of place fields, stability, and spatial information were computed from the smoothed rate map. For open fields, a two-dimensional Gaussian Kernel (SD = 1.84 cm) was applied to the rate map for smoothing. For the circular T-maze, a Gaussian Kernel (SD = 5.57 cm) was applied to the linearized rate map for smoothing. For the circular T-maze, a place field was defined as a continuous region of at least 8.3 cm (5 pixels) where the firing rate was above 50% of the local maximum firing rate and the peak firing rate of the area was >1 Hz. For open field, a place field was defined as a continuous region of at least 85 cm2 (100 pixels) where the firing rate was above 20% of the local maximum firing rate or 1Hz (larger value). Place map stability was defined by the pixel-by-pixel correlation coefficient between the firing rate maps of the first and second halves of the recording session (open fields) or the mean of the pixel-by-pixel correlation coefficient among each run trial (circular T-maze). The spatial information content (Skaggs et al., 1993) was calculated according to the following formulae:
where i = 1,2,…,N represents pixel identification number, pi is the probability of occupancy of pixel i, λi is the mean firing rate of pixel i, λ is the overall mean firing rate of the cell on the maze.
Choice-dependent activity
For the place fields on the central arm of the circular T-maze, place fields were calculated separately for right and left choice trials. Two-way analysis of variance (ANOVA) with two factors (position, left-right choice) were performed for each trial rate map within the place fields. The neuron was deemed as a splitter cell (Wood et al. 2000), if the P-value for the left-right choice factor was < 0.001.
Place field remapping
To assess the place field stability of each cell, pixel-by-pixel correlation between A-B, B-A’, and A-A’ was calculated. Place field remap index was calculated by subtracting the mean of the A-B and B-A’ correlations from the A-A’ correlation. For comparison of the scores among different types of neurons, we used only the scores from neurons which had stable place fields (stability > 0.5) in at least one of the open field session A, B or A’.
Population vector (PV) correlation was calculated for A-B, B-A’ and A-A’ to assess the place field remapping in each type of neuron populations. For calculating PVs, rate maps of n = 5, 10, 15, 20 units randomly selected from all units with stable place field were stacked. Random sampling was performed 1000 times iteratively for place field remapping index calculations. PVs were also calculated by stacking the rate maps of all the units and also all the units with stable place fields. Place field remapping index based on PV correlation was calculated by subtracting the mean of A-B and B-A’ PV correlations from A-A’ PV correlation.
Histological processing
After each experiment, 10 μA current was applied to one of more sites of each shank of the silicon probes for 5 s to generate electrolytic lesions to help identifying the location of the silicon probes. One to 3 days after the lesions, mice were overdosed with pentobarbital injection (100 mg/kg body weight), perfused with saline and 4% paraformaldehyde before their brains were rapidly removed. Coronal sections (50 μm) were cut on a vibratome (Leica, VT1000S) and collected in PBS. Brain sections were mounted in Fluoromount with DAPI (Sigma) and imaged with a wide-field fluorescence microscope (Zeiss, Axioscope) or a confocal laser-scanning microscope (Zeiss, LSM 700).
QUANTIFICATION AND STATISTICAL ANALYSIS
Statistical analysis
All statistical analyses were performed in Matlab (MathWorks). All tests were two-tailed. Non-parametric Mann-Whitney U test, Wilcoxon’s signed rank test, Kruskal-Wallis one-way analysis of variance, two-way analysis of variance, Kolmogorov-Smirnov test, Rayleigh test were used. Correlations were computed using Pearson’s correlation coefficient.
DATA AND SOFTWARE AVAILABILITY
LFP and spike data have been deposited in CRCNS.org and are freely available for further analyses.
ADDITIONAL RESOURCES
N/A
Supplementary Material
Highlights.
- Dentate granule cells and mossy cells have distinct physiological characteristics
- Granule cells have none or single place field and remap less in different mazes
- Mossy cells have mainly multiple place fields and remap more in different mazes
- Mossy cells rarely ‘inherit’ place fields from single granule cells
Acknowledgments
We thank Lisa Roux and Eran Stark for technical support and extensive discussion. We also thank Nathan Danielson, Antonio Fernández-Ruiz, Jennifer Gelinas, Dion Khodagholy, James Knierim, Attila Losonczy, Sam Mckenzie, and Ivan Soltesz for insightful comments on the manuscript, Anna Conti for help maintaining transgenic animals; Helen Scharfman and Edward Ziff for providing DRD2-Cre mice. This work was supported by the Nakajima Foundation, NIHMH54671, MH107396, NS 090583, NSF PIRE grant and the Simons Foundation.
Footnotes
Author contributions
Y.S. and G.B. designed the experiments; Y.S. performed the experiments and analyzed the data; and Y.S. and G.B. wrote the paper.
Publisher's Disclaimer: This is a PDF file of an unedited manuscript that has been accepted for publication. As a service to our customers we are providing this early version of the manuscript. The manuscript will undergo copyediting, typesetting, and review of the resulting proof before it is published in its final citable form. Please note that during the production process errors may be discovered which could affect the content, and all legal disclaimers that apply to the journal pertain.
References
- Acsády L, Kamondi A, Sík A, Freund T, Buzsáki G. GABAergic cells are the major postsynaptic targets of mossy fibers in the rat hippocampus. J Neurosci. 1998;18:3386–3403. doi: 10.1523/JNEUROSCI.18-09-03386.1998. [DOI] [PMC free article] [PubMed] [Google Scholar]
- de Almeida L, Idiart M, Lisman JE. The Input-Output Transformation of the Hippocampal Granule Cells: From Grid Cells to Place Fields. J Neurosci. 2009;29:7504–7512. doi: 10.1523/JNEUROSCI.6048-08.2009. [DOI] [PMC free article] [PubMed] [Google Scholar]
- Amaral DG. A Golgi study of cell types in the hilar region of the hippocampus in the rat. J Comp Neurol. 1978;182:851–914. doi: 10.1002/cne.901820508. [DOI] [PubMed] [Google Scholar]
- Amaral DG, Ishizuka N, Claiborne B. Chapter 1 Chapter Neurons, numbers and the hippocampal network. Prog Brain Res. 1990;83:1–11. doi: 10.1016/s0079-6123(08)61237-6. [DOI] [PubMed] [Google Scholar]
- Amaral DG, Lavenex P. Hippocampal neuroanatomy. In: Andersen P, Morris R, Amaral D, Bliss T, O’Keefe J, editors. The Hippocampus Book. Oxford University Press; New York: 2007. pp. 37–114. [Google Scholar]
- Barthó P, Hirase H, Monconduit L, Zugaro M, Harris KD, Buzsáki G. Characterization of neocortical principal cells and interneurons by network interactions and extracellular features. J Neurophysiol. 2004;92:600–608. doi: 10.1152/jn.01170.2003. [DOI] [PubMed] [Google Scholar]
- Berényi A, Somogyvári Z, Nagy AJ, Roux L, Long JD, Fujisawa S, Stark E, Leonardo A, Harris TD, Buzsáki G, et al. Large-scale, high-density (up to 512 channels) recording of local circuits in behaving animals. J Neurophysiol. 2014;111:1132–1149. doi: 10.1152/jn.00785.2013. [DOI] [PMC free article] [PubMed] [Google Scholar]
- Bland BH, Andersen P, Ganes T, Sveen O. Automated analysis of rhythmicity of physiologically identified hippocampal formation neurons. Exp Brain Res. 1980;38:205–219. doi: 10.1007/BF00236742. [DOI] [PubMed] [Google Scholar]
- Bragin A, Jandó G, Nádasdy Z, van Landeghem M, Buzsáki G. Dentate EEG spikes and associated interneuronal population bursts in the hippocampal hilar region of the rat. J Neurophysiol. 1995;73:1691–1705. doi: 10.1152/jn.1995.73.4.1691. [DOI] [PubMed] [Google Scholar]
- Buckmaster PS, Strowbridge BW, Kunkel DD, Schmiege DL, Schwartzkroin PA. Mossy cell axonal projections to the dentate gyrus molecular layer in the rat hippocampal slice. Hippocampus. 1992;2:349–362. doi: 10.1002/hipo.450020403. [DOI] [PubMed] [Google Scholar]
- Buckmaster PS, Wenzel HJ, Kunkel DD, Schwartzkroin PA. Axon arbors and synaptic connections of hippocampal mossy cells in the rat in vivo. J Comp Neurol. 1996;366:271–292. doi: 10.1002/(sici)1096-9861(19960304)366:2<270::aid-cne7>3.0.co;2-2. [DOI] [PubMed] [Google Scholar]
- Buzsáki G, Czéh G. Commissural and perforant path interactions in the rat hippocampus. Field potentials and unitary activity. Exp Brain Res. 1981;43:429–438. doi: 10.1007/BF00238387. [DOI] [PubMed] [Google Scholar]
- Buzsáki G, Lai-Wo SL, Vanderwolf CH. Cellular bases of hippocampal EEG in the behaving rat. Brain Res Rev. 1983;6:139–171. doi: 10.1016/0165-0173(83)90037-1. [DOI] [PubMed] [Google Scholar]
- Danielson NB, Kaifosh P, Zaremba JD, Losonczy A, Kheirbek MA, Danielson NB, Kaifosh P, Zaremba JD, Lovett-barron M, Tsai J. Distinct Contribution of Adult-Born Hippocampal Granule Cells to Context Encoding. Neuron. 2016;90:101–12. doi: 10.1016/j.neuron.2016.02.019. [DOI] [PMC free article] [PubMed] [Google Scholar]
- Deguchi Y, Donato F, Galimberti I, Cabuy E, Caroni P. Temporally matched subpopulations of selectively interconnected principal neurons in the hippocampus. Nat Neurosci. 2011;14:495–504. doi: 10.1038/nn.2768. [DOI] [PubMed] [Google Scholar]
- Diamantaki M, Frey M, Berens P, Preston-Ferrer P, Burgalossi A. Sparse activety of identified dentate granule cells during spatial exploration. eLife. 2016;5:e20252. doi: 10.7554/eLife.20252. [DOI] [PMC free article] [PubMed] [Google Scholar]
- Diba K, Buzsaki G. Hippocampal Network Dynamics Constrain the Time Lag between Pyramidal Cells across Modified Environments. J Neurosci. 2008;28:13448–13456. doi: 10.1523/JNEUROSCI.3824-08.2008. [DOI] [PMC free article] [PubMed] [Google Scholar]
- Diba K, Amarasingham A, Mizuseki K, Buzsaki G. Millisecond timescale synchrony among hippocampal neurons. J Neurosci. 2014;34:14984–14994. doi: 10.1523/JNEUROSCI.1091-14.2014. [DOI] [PMC free article] [PubMed] [Google Scholar]
- Dyhrfjeld-Johnsen J, Santhakumar V, Morgan RJ, Huerta R, Tsimring L, Soltesz I. Topological determinants of epileptogenesis in large-scale structural and functional models of the dentate gyrus derived from experimental data. J Neurophysiol. 2007;97:1566–1587. doi: 10.1152/jn.00950.2006. [DOI] [PubMed] [Google Scholar]
- Frank LM, Brown EN, Wilson M. Trajectory Encoding in the Hippocampus and Entorhinal Cortex. Neuron. 2000;27:169–178. doi: 10.1016/s0896-6273(00)00018-0. [DOI] [PubMed] [Google Scholar]
- Fujisawa S, Amarasingham A, Harrison MT, Buzsáki G. Behavior-dependent short-term assembly dynamics in the medial prefrontal cortex. Nat Neurosci. 2008;11:823–833. doi: 10.1038/nn.2134. [DOI] [PMC free article] [PubMed] [Google Scholar]
- Gilbert PE, Kesner RP, Lee I. Dissociating hippocampal subregions: double dissociation between dentate gyrus and CA1. Hippocampus. 2001;11:626–636. doi: 10.1002/hipo.1077. [DOI] [PubMed] [Google Scholar]
- Gothard KM, Hoffman KL, Battaglia FP, McNaughton BL. Dentate gyrus and ca1 ensemble activity during spatial reference frame shifts in the presence and absence of visual input. J Neurosci. 2001;21:7284–7292. doi: 10.1523/JNEUROSCI.21-18-07284.2001. [DOI] [PMC free article] [PubMed] [Google Scholar]
- GoodSmith D, Chen X, Wang C, Kim SH, Song H, Burgalossi A, Christian KM, Knierim JJ. Spatial representations of granule cells and mossy cells of the dentate gyrus. Neuron in review. doi: 10.1016/j.neuron.2016.12.026. [DOI] [PMC free article] [PubMed] [Google Scholar]
- Harris KD, Henze DA, Csicsvari J, Hirase H, Buzsáki G. Accuracy of tetrode spike separation as determined by simultaneous intracellular and extracellular measurements. J Neurophysiol. 2000;84:401–414. doi: 10.1152/jn.2000.84.1.401. [DOI] [PubMed] [Google Scholar]
- Hasselmo ME, Wyble BP. Free recall and recognition in a network model of the hippocampus: simulating effects of scopolamine on human memory function. Behav Brain Res. 1997;89:1–34. doi: 10.1016/s0166-4328(97)00048-x. [DOI] [PubMed] [Google Scholar]
- Hafting T, Fyhn M, Molden S, Moser MB, Moser EI. Microstructure of a spatial map in the entorhinal cortex. Nature. 2005;436:801–806. doi: 10.1038/nature03721. [DOI] [PubMed] [Google Scholar]
- Halasy K, Somogyi P. Subdivisions in the multiple GABAergic innervation of granule cells in the dentate gyrus of the rat hippocampus. Eur J Neurosci. 1993;5:411–429. doi: 10.1111/j.1460-9568.1993.tb00508.x. [DOI] [PubMed] [Google Scholar]
- Hazan L, Zugaro M, Buzsáki G. Klusters, NeuroScope, NDManager: A free software suite for neurophysiological data processing and visualization. J Neurosci Methods. 2006;155:207–216. doi: 10.1016/j.jneumeth.2006.01.017. [DOI] [PubMed] [Google Scholar]
- Henze DA, Buzsáki G. Hilar mossy cells: functional identification and activity in vivo. Prog Brain Res. 2007;163:199–216. doi: 10.1016/S0079-6123(07)63012-X. [DOI] [PubMed] [Google Scholar]
- Henze DA, Urban N, Barrionuevo G. The multifarious hippocampal mossy fiber pathway: a review. Neuroscience. 2000;98:407–427. doi: 10.1016/s0306-4522(00)00146-9. [DOI] [PubMed] [Google Scholar]
- Henze DA, Wittner L, Buzsáki G. Single granule cells reliably discharge targets in the hippocampal CA3 network in vivo. Nat Neurosci. 2002;5:790–795. doi: 10.1038/nn887. [DOI] [PubMed] [Google Scholar]
- Hosp JA, Strüber M, Yanagawa Y, Obata K, Vida I, Jonas P, Bartos M. Morpho-physiological criteria divide dentate gyrus interneurons into classes. Hippocampus. 2014;24:189–203. doi: 10.1002/hipo.22214. [DOI] [PMC free article] [PubMed] [Google Scholar]
- Hunsaker MR, Rosenberg JS, Kesner RP. The role of the dentate gyrus, CA3a,b, and CA3c for detecting spatial and environmental novelty. Hippocampus. 2008;18:1064–1073. doi: 10.1002/hipo.20464. [DOI] [PubMed] [Google Scholar]
- Ishizuka N, Weber J, Amaral DG. Organization of intrahippocampal projections originating from CA3 pyramidal cells in the rat. J Comp Neurol. 1990;295:580–623. doi: 10.1002/cne.902950407. [DOI] [PubMed] [Google Scholar]
- Isomura Y, Sirota A, Ozen S, Montgomery S, Mizuseki K, Henze Da, Buzsáki G. Integration and segregation of activity in entorhinal-hippocampal subregions by neocortical slow oscillations. Neuron. 2006;52:871–882. doi: 10.1016/j.neuron.2006.10.023. [DOI] [PubMed] [Google Scholar]
- Jinde S, Zsiros V, Jiang Z, Nakao K, Pickel J, Kohno K, Belforte JE, Nakazawa K. Hilar mossy cell degeneration causes transient dentate granule cell hyperexcitability and impaired pattern separation. Neuron. 2012;76:1189–1200. doi: 10.1016/j.neuron.2012.10.036. [DOI] [PMC free article] [PubMed] [Google Scholar]
- Jung MW, McNaughton BL. Spatial selectivity of unit activity in the hippocampal granular layer. Hippocampus. 1993;3:165–182. doi: 10.1002/hipo.450030209. [DOI] [PubMed] [Google Scholar]
- Kim J, Lee I. Hippocampus is necessary for spatial discrimination using distal cue-configuration. Hippocampus. 2011;21:609–621. doi: 10.1002/hipo.20784. [DOI] [PubMed] [Google Scholar]
- Knierim JJ, Kudrimoti HS, McNaughton BL. Place cells, head direction cells, and the learning of landmark stability. J Neurosci. 1995;15:1648–1659. doi: 10.1523/JNEUROSCI.15-03-01648.1995. [DOI] [PMC free article] [PubMed] [Google Scholar]
- Knierim JJ, Neunuebel JP. Tracking the flow of hippocampal computation: Pattern separation, pattern completion, and attractor dynamics. Neurobiol Learn Mem. 2016;129:38–49. doi: 10.1016/j.nlm.2015.10.008. [DOI] [PMC free article] [PubMed] [Google Scholar]
- Krueppel R, Remy S, Beck H. Dendritic Integration in Hippocampal Dentate Granule Cells. Neuron. 2011;71:512–528. doi: 10.1016/j.neuron.2011.05.043. [DOI] [PubMed] [Google Scholar]
- Langdon RB, Johnson JW, Barrionuevo G. Asynchrony of mossy fibre inputs and excitatory postsynaptic currents in rat hippocampus. J Physiol. 1993;472:157–176. doi: 10.1113/jphysiol.1993.sp019941. [DOI] [PMC free article] [PubMed] [Google Scholar]
- Lee I, Yoganarasimha D, Rao G, Knierim JJ. Comparison of population coherence of place cells in hippocampal subfields CA1 and CA3. Nature. 2004;430:456–459. doi: 10.1038/nature02739. [DOI] [PubMed] [Google Scholar]
- Leutgeb JK, Leutgeb S, Moser M, Moser EI. Pattern Separation in the Dentate Gyrus and CA3 of the Hippocampus. 2007:315. doi: 10.1126/science.1135801. [DOI] [PubMed] [Google Scholar]
- Leutgeb S, Leutgeb JK, Barnes Ca, Moser EI, McNaughton BL, Moser M-B. Independent codes for spatial and episodic memory in hippocampal neuronal ensembles. Science. 2005;309:619–623. doi: 10.1126/science.1114037. [DOI] [PubMed] [Google Scholar]
- Li XG, Somogyi P, Ylinen A, Buzsáki G. The hippocampal CA3 network: An in vivo intracellular labeling study. J Comp Neurol. 1994;339:181–208. doi: 10.1002/cne.903390204. [DOI] [PubMed] [Google Scholar]
- Lisman JE, Barnes C, Blackwood D, Whalley L, Christie J, Blackburn I, Clair D, St McInnes A, Blum K, Abbott L, et al. Relating hippocampal circuitry to function: recall of memory sequences by reciprocal dentate-CA3 interactions. Neuron. 1999;22:233–242. doi: 10.1016/s0896-6273(00)81085-5. [DOI] [PubMed] [Google Scholar]
- Lysetskiy M, Földy C, Soltesz I. Long- and short-term plasticity at mossy fiber synapses on mossy cells in the rat dentate gyrus. Hippocampus. 2005;15:691–696. doi: 10.1002/hipo.20096. [DOI] [PubMed] [Google Scholar]
- Marr D. Simple memory: a theory for archicortex. Philos Trans R Soc Lond B Biol Sci. 1971;262:23–81. doi: 10.1098/rstb.1971.0078. [DOI] [PubMed] [Google Scholar]
- McHugh TJ, Jones MW, Quinn JJ, Balthasar N, Coppari R, Elmquist JK, Lowell BB, Fanselow MS, Wilson MA, Tonegawa S. Dentate gyrus NMDA receptors mediate rapid pattern separation in the hippocampal network. Science. 2007;317:94–99. doi: 10.1126/science.1140263. [DOI] [PubMed] [Google Scholar]
- McNaughton BL, Morris RGM. Hippocampal synaptic enhancement and information storage within a distributed memory system. Trends Neurosci. 1987;10:408–415. [Google Scholar]
- McNaughton BL, Nadel L. Hebb-Marr networks and the neurobiological representation of action in space. In: Gluck MA, Rumelhart DE, editors. Neuroscience and connectionist theory. Hillsdale: Erlbaum; 1990. pp. 1–63. [Google Scholar]
- McNaughton BL, Barnes CA, O’Keefe J. The contributions of position, direction, and velocity to single unit activity in the hippocampus of freely-moving rats. Exp Brain Res. 1983;52:41–49. doi: 10.1007/BF00237147. [DOI] [PubMed] [Google Scholar]
- Mizumori SJ, McNaughton BL, Barnes CA. A comparison of supramammillary and medial septal influences on hippocampal field potentials and single-unit activity. J Neurophysiol. 1989;61:15–31. doi: 10.1152/jn.1989.61.1.15. [DOI] [PubMed] [Google Scholar]
- Mizuseki K, Sirota A, Pastalkova E, Buzsáki G. Theta oscillations provide temporal windows for local circuit computation in the entorhinal-hippocampal loop. Neuron. 2009;64:267–280. doi: 10.1016/j.neuron.2009.08.037. [DOI] [PMC free article] [PubMed] [Google Scholar]
- Mizuseki K, Royer S, Diba K, Buzsáki G. Activity dynamics and behavioral correlates of CA3 and CA1 hippocampal pyramidal neurons. Hippocampus. 2012;22:1659–1680. doi: 10.1002/hipo.22002. [DOI] [PMC free article] [PubMed] [Google Scholar]
- Muller RU, Kubie JL. The effects of changes in the environment on the spatial firing of hippocampal complex-spike cells. J Neurosci. 1987;7:1951–1968. doi: 10.1523/JNEUROSCI.07-07-01951.1987. [DOI] [PMC free article] [PubMed] [Google Scholar]
- Myers CE, Scharfman HE. A role for hilar cells in pattern separation in the dentate gyrus: A computational approach. Hippocampus. 2009;19:321–337. doi: 10.1002/hipo.20516. [DOI] [PMC free article] [PubMed] [Google Scholar]
- Nakashiba T, Cushman JD, Pelkey Ka, Renaudineau S, Buhl DL, McHugh TJ, Barrera VR, Chittajallu R, Iwamoto KS, McBain CJ, et al. Young Dentate Granule Cells Mediate Pattern Separation, whereas Old Granule Cells Facilitate Pattern Completion. Cell. 2012;149:188–201. doi: 10.1016/j.cell.2012.01.046. [DOI] [PMC free article] [PubMed] [Google Scholar]
- Neunuebel JP, Knierim JJ. Spatial firing correlates of physiologically distinct cell types of the rat dentate gyrus. J Neurosci. 2012;32:3848–3858. doi: 10.1523/JNEUROSCI.6038-11.2012. [DOI] [PMC free article] [PubMed] [Google Scholar]
- Neunuebel JP, Knierim JJ. CA3 retrieves coherent representations from degraded input: direct evidence for CA3 pattern completion and dentate gyrus pattern separation. Neuron. 2014;81:416–427. doi: 10.1016/j.neuron.2013.11.017. [DOI] [PMC free article] [PubMed] [Google Scholar]
- Nitz D, McNaughton B. Differential modulation of CA1 and dentate gyrus interneurons during exploration of novel environments. J Neurophysiol. 2004;91:863–872. doi: 10.1152/jn.00614.2003. [DOI] [PubMed] [Google Scholar]
- Penttonen M, Kamondi A, Sik A, Acsády L, Buzsáki G. Feed-forward and feed-back activation of the dentate gyrus in vivo during dentate spikes and sharp wave bursts. Hippocampus. 1997;7:437–450. doi: 10.1002/(SICI)1098-1063(1997)7:4<437::AID-HIPO9>3.0.CO;2-F. [DOI] [PubMed] [Google Scholar]
- Pernía-Andrade AJ, Jonas P. Theta-gamma-modulated synaptic currents in hippocampal granule cells in vivo define a mechanism for network oscillations. Neuron. 2014;81:140–152. doi: 10.1016/j.neuron.2013.09.046. [DOI] [PMC free article] [PubMed] [Google Scholar]
- Puighermanal E, Biever A, Espallergues J, Gangarossa G, De Bundel D, Valjent E. drd2-cre:ribotag mouse line unravels the possible diversity of dopamine d2 receptor-expressing cells of the dorsal mouse hippocampus. Hippocampus. 2015;25:858–875. doi: 10.1002/hipo.22408. [DOI] [PubMed] [Google Scholar]
- Rolls ET, Kesner RP. A computational theory of hippocampal function, and empirical tests of the theory. Prog Neurobiol. 2006;79:1–48. doi: 10.1016/j.pneurobio.2006.04.005. [DOI] [PubMed] [Google Scholar]
- Rose G, Diamond D, Lynch GS. Dentate granule cells in the rat hippocampal formation have the behavioral characteristics of theta neurons. Brain Res. 1983;266:29–37. doi: 10.1016/0006-8993(83)91306-9. [DOI] [PubMed] [Google Scholar]
- Royer S, Zemelman BV, Losonczy A, Kim J, Chance F, Magee JC, Buzsáki G. Control of timing, rate and bursts of hippocampal place cells by dendritic and somatic inhibition. Nat Neurosci. 2012;15 doi: 10.1038/nn.3077. [DOI] [PMC free article] [PubMed] [Google Scholar]
- Scharfman HE. Dentate hilar cells with dendrites in the molecular layer have lower thresholds for synaptic activation by perforant path than granule cells. J Neurosci. 1991;11:1660–1673. doi: 10.1523/JNEUROSCI.11-06-01660.1991. [DOI] [PMC free article] [PubMed] [Google Scholar]
- Scharfman HE. Evidence from simultaneous intracellular recordings in rat hippocampal slices that area CA3 pyramidal cells innervate dentate hilar mossy cells. J Neurophysiol. 1994;72:2167–2180. doi: 10.1152/jn.1994.72.5.2167. [DOI] [PubMed] [Google Scholar]
- Scharfman HE. The CA3 “back projection” to the dentate gyrus. Prog Brain Res. 2007;163:627–637. doi: 10.1016/S0079-6123(07)63034-9. [DOI] [PMC free article] [PubMed] [Google Scholar]
- Scharfman HE. The enigmatic mossy cell of the dentate gyrus. Nat Rev Neurosci. 2016;9:562–575. doi: 10.1038/nrn.2016.87. [DOI] [PMC free article] [PubMed] [Google Scholar]
- Scharfman HE, Smith KL, Goodman JH, Sollas AL. Survival of dentate hilar mossy cells after pilocarpine-induced seizures and their synchronized burst discharges with area CA3 pyramidal cells. Neuroscience. 2001;104:741–759. doi: 10.1016/s0306-4522(01)00132-4. [DOI] [PMC free article] [PubMed] [Google Scholar]
- Si B, Treves A. The role of competitive learning in the generation of DG fields from EC inputs. Cogn Neurodyn. 2009;3:177–187. doi: 10.1007/s11571-009-9079-z. [DOI] [PMC free article] [PubMed] [Google Scholar]
- Sik A, Penttonen M, Buzsáki G. Interneurons in the hippocampal dentate gyrus: an in vivo intracellular study. Eur J Neurosci. 1997;9:573–588. doi: 10.1111/j.1460-9568.1997.tb01634.x. [DOI] [PubMed] [Google Scholar]
- Skaggs WE, Mcnaughton BL, Gothard KM, Markus EJ. An Information-Theoretic Approach to Deciphering the Hippocampal Code 1993 [Google Scholar]
- Soltesz I, Bourassa J, Deschênes M. The behavior of mossy cells of the rat dentate gyrus during theta oscillations in vivo. Neuroscience. 1993;57:555–564. doi: 10.1016/0306-4522(93)90005-z. [DOI] [PubMed] [Google Scholar]
- Stark E, Abeles M. Unbiased estimation of precise temporal correlations between spike trains. J Neurosci Methods. 2009;179:90–100. doi: 10.1016/j.jneumeth.2008.12.029. [DOI] [PubMed] [Google Scholar]
- Stark E, Koos T, Buzsáki G. Diode probes for spatiotemporal optical control of multiple neurons in freely moving animals. J Neurophysiol. 2012;108:349–363. doi: 10.1152/jn.00153.2012. [DOI] [PMC free article] [PubMed] [Google Scholar]
- Stark E, Roux L, Eichler R, Senzai Y, Royer S, Buzsáki G. Pyramidal Cell-Interneuron Interactions Underlie Hippocampal Ripple Oscillations. Neuron. 2014;83:467–480. doi: 10.1016/j.neuron.2014.06.023. [DOI] [PMC free article] [PubMed] [Google Scholar]
- Treves A, Rolls ET. Computational analysis of the role of the hippocampus in memory. Hippocampus. 1994;4:374–391. doi: 10.1002/hipo.450040319. [DOI] [PubMed] [Google Scholar]
- Ujfalussy B, Kiss T, Érdi P. Parallel Computational Subunits in Dentate Granule Cells Generate Multiple Place Fields. PLoS Comput Biol. 2009;5:e1000500. doi: 10.1371/journal.pcbi.1000500. [DOI] [PMC free article] [PubMed] [Google Scholar]
- Vyleta NP, Borges-Merjane C, Jonas P. Plasticity-dependent, full detonation at hippocampal mossy fiber–CA3 pyramidal neuron synapses. eLife. 2016;5:e17977. doi: 10.7554/eLife.17977. [DOI] [PMC free article] [PubMed] [Google Scholar]
- Williams PA, Larimer P, Gao Y, Strowbridge BW. Semilunar GCs: glutamatergic neurons in the rat dentate gyrus with axon collaterals in the inner molecular layer. J Neurosci. 2007;27:13756–13761. doi: 10.1523/JNEUROSCI.4053-07.2007. [DOI] [PMC free article] [PubMed] [Google Scholar]
- Winter SS, Clark BJ, Taube JS, Moser EI, Kropff E, Moser MB, Taube JS, Boccara CN, Sargolini F, Thoresen VH, et al. Spatial navigation. Disruption of the head direction cell network impairs the parahippocampal grid cell signal. Science. 2015;347:870–874. doi: 10.1126/science.1259591. [DOI] [PMC free article] [PubMed] [Google Scholar]
- Wood ER, Dudchenko PA, Robitsek RJ, Eichenbaum H, Bostock E, Muller RU, Kubie JL, Czurko A, Hirase H, Csicsvari J, et al. Hippocampal neurons encode information about different types of memory episodes occurring in the same location. Neuron. 2000;27:623–633. doi: 10.1016/s0896-6273(00)00071-4. [DOI] [PubMed] [Google Scholar]
- Yassa MA, Stark CEL. Pattern separation in the hippocampus. Trends Neurosci. 2011;34:515–525. doi: 10.1016/j.tins.2011.06.006. [DOI] [PMC free article] [PubMed] [Google Scholar]
- Yoganarasimha D, Knierim JJ. Coupling between place cells and head direction cells during relative translations and rotations of distal landmarks. Exp Brain Res. 2005;160:344–359. doi: 10.1007/s00221-004-2016-9. [DOI] [PubMed] [Google Scholar]
Associated Data
This section collects any data citations, data availability statements, or supplementary materials included in this article.