Abstract
Previous studies of 3'-deoxy-3'-[18F]fluorothymidine (FLT) have only been performed in aggregate, and therefore the single-cell distribution of FLT is unknown. We use a novel in vitro radioluminescence microscopy technique to measure the differential distribution of FLT radiotracer with single cell level precision.
Methods
Using radioluminescence microscopy, we image the absolute uptake of FLT in live MDA-MB-231 cells grown under different serum conditions, and compare it to fluorescence microscopy of 5-Ethynyl-2'-deoxyuridine (EdU) incorporation in fixed cells.
Results
FLT uptake by serum-starved cells is heterogeneous but low. At the higher serum concentration, a subpopulation of FLT-avid cells emerges, consistent in its size with EdU staining. Such a dichotomous distribution is not typically observed with other radiotracers.
Conclusions
Our results suggest that increased FLT uptake by proliferating tumors is due to a greater fraction of cycling cells rather than a uniform change in FLT uptake by individual cells.
Introduction
In this study, we investigate the cellular distribution of 3'-deoxy-3'-[18F]fluorothymidine (FLT) using radioluminescence microscopy, a novel radionuclide imaging method with single-cell resolution.
FLT is often used with positron emission tomography (PET) to measure cancer proliferation in vivo, in a preclinical or clinical setting. However, the question of whether or not FLT truly measures proliferation remains controversial. While FDG (2-deoxy-2-(18F)fluoro-D-glucose)-PET is extensively used for tumor mapping, PET studies with FLT have been less reliable (1–3). Cellular proliferation is fundamentally driven by whether individual cells enter cell division or remain in an arrested state. Therefore, cellular proliferation is best estimated by measuring the fraction of cells that are actively advancing through the cell cycle. However, in vivo measurements using FLT-PET cannot provide this information because the information about the state of each individual cell is lost to averaging during the measurement process. This effect may contribute to the difficulty observed in interpreting in vivo FLT data.
Cell proliferation can be measured either by measuring the rate of DNA replication using labeled nucleotide analogues, or by probing cell-cycle-specific markers. Tritiated thymidine has long been used to measure incorporation of thymidine into DNA (4). In combination with microautoradiography, the method allows for the frequency of DNA-synthesizing cells to be determined in a semi-quantitative fashion. However, microautoradiography of tritiated compounds is technically challenging due to the long half-life of 3H and the preparation of autoradiographic emulsions. A more commonly used method is the 5-Bromo-2’-DeoxyUridine (BrdU) assay, which can be incorporated into DNA during replication as a substitute for thymidine (5). More recently, 5-Ethynyl-2'-deoxyuridine (EdU) has been used as a replacement for BrdU due to a simplified detection system (6), and is commercially available. However, these assays are typically terminal since the procedure calls for cell fixation. In addition, because BrdU and EdU are mutagenic and cytotoxic, they cannot be used in a clinical population. The S-phase fraction can also be measured using flow cytometry with DNA staining. Another popular approach is immunostaining using a marker of proliferation such as Ki67, which is only expressed in actively cycling cells (7–9). More recently, Raman spectroscopy has also been used to measure cell proliferation in vitro (10).
FLT is the only available method to assess tumor proliferation in vivo in a clinical setting, but its use has been hampered by its poor accuracy. FLT uptake correlates with thymidine kinase 1 (TK1) activity (11), which is strongly dependent on the cell cycle (12). TK1 is most highly expressed during the S-phase of the cell cycle; thus, a proliferating tumor, with a higher frequency of cells in the S-phase, is expected to take up FLT more avidly. Since FLT is not incorporated into the DNA, FLT can be used clinically without lasting toxicity. However, FLT measurements have limited accuracy in vivo. For one, the competition between the thymidine salvage pathway (which FLT measures) and de novo DNA synthesis (13) can complicate the analysis of FLT-PET scans obtained in patient populations. Further, tumors with high local thymidine concentrations are known to take up FLT less avidly regardless of their proliferation status (2).
In this study, we employ a single-cell imaging technique called radioluminescence microscopy to image the uptake of FLT in a human breast-cancer cell line under different proliferation conditions. Radioluminescence microscopy can visualize the uptake of PET tracers in vitro, with single-cell resolution, in a multi-modal microscopy environment that also includes fluorescence and brightfield imaging capabilities (14, 15). While the method has been applied to various radiotracers such as FHBG (15), FDG (14), and radiolabeled antibodies, the uptake of FLT has previously not been measured in single cells. With this study, we aim to demonstrate that FLT uptake is a specific marker of proliferation at the single-cell level. Given the cell-cycle-specific expression of TK1, we postulate that only a subpopulation of cells, which are actively replicating, will take up and retain FLT. We also aim to determine how these single-cell FLT measurements compare to EdU incorporation measured by fluorescence microscopy. In this manner, we hope to validate FLT as a marker of proliferation from a single-cell perspective and determine how EdU imaging compares to clinically used FLT. These data validate both the use of FLT as an in vitro imaging platform and provide a point of comparison for EdU measurements as they compare to clinically used FLT.
Methods
Radioluminescence microscopy setup
Radioluminescence imaging was performed using a bioluminescence microscope (LV200, Olympus) outfitted with a 40×/1.3 NA oil objective (UPLFLN40XO, Olympus), and a deep-cooled electron-multiplying charge-coupled device (EM-CCD; ImageEM C9100-14, Hamamatsu). All samples were imaged using 4×4 binning and an electron-multiplication gain of 1200. Fluorescence imaging was performed on Leica DM6000B microcope using a Hamamatsu C11440 fluorescence camera and a Leica DFC450 brightfield camera, with 20× magnification and an exposure time of 4 seconds.
Cell-based imaging experiments
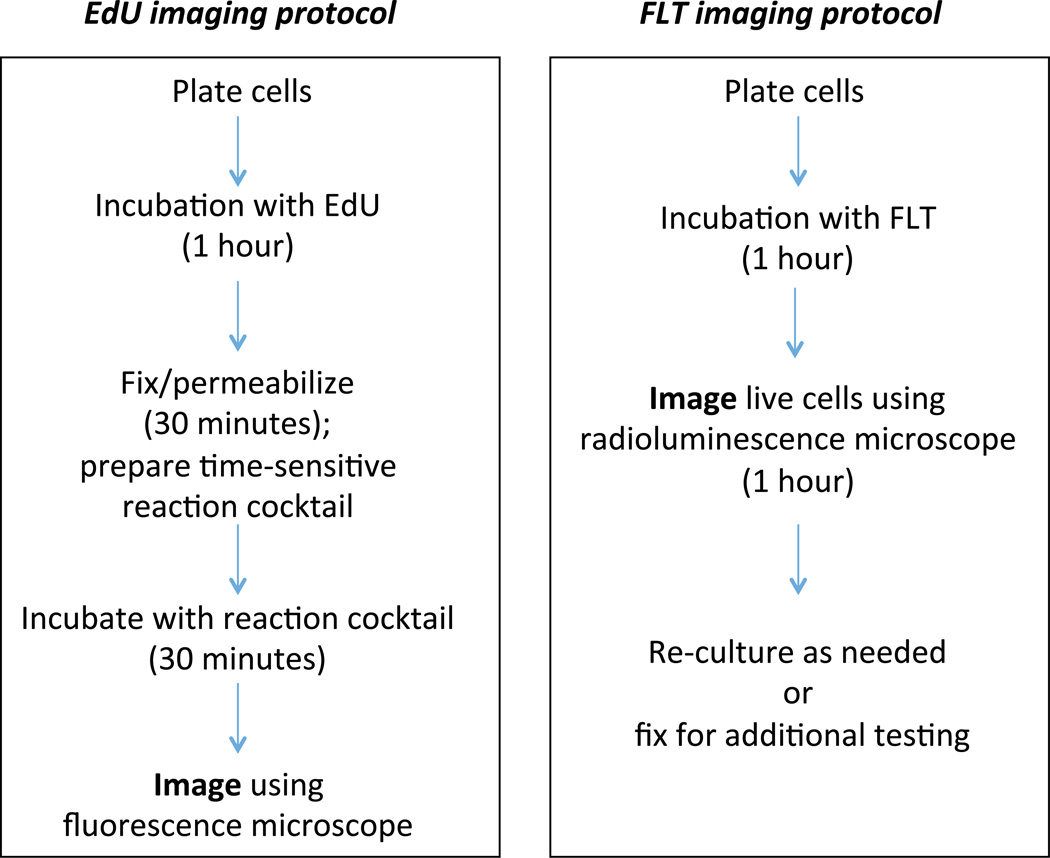
MDA-MB-231 human breast cancer cells were purchased from the American Type Culture Collection (ATCC, Manassas, VA) and cultured in DMEM (Gibco) medium supplemented with 10% fetal bovine serum. Glass-bottom dishes were coated with fibronectin (10 µg/ml) for 1h. The dish was then washed 3× with PBS, and 105 cells were seeded and left to adhere overnight. The next day, media was changed to the serum condition required, and cells were grown for 48 hours. Imaging was performed the following day. The two imaging protocols are summarized in Figure 1. For radioluminescence experiments, cells were incubated with FLT (18 MBq/mL for 60 min) or FDG (9 MBq/mL for 60 minutes after 30 min glucose fasting). The cells were then washed 3× with PBS, and a 500 mm-thick scintillator (CdWO4; two-face polished; MTI Corp., Richmond, CA) was placed on top of the cells. For FLT imaging, the cells were imaged using radioluminescence microscopy with a 15 min total exposure time, split into 12,000 frames (75 ms/frame). For FDG imaging, the total exposure time was 50 min, split into 30,000 frames (100 ms/frame). For fluorescence experiments, an EdU imaging kit (Life Technologies, C10337) and corresponding protocol was used (20 mM EdU for 1 hour at 37°C).
Figure 1.
A schematic comparing the steps required to image cells with EdU (left) or FLT (right).
Image analysis
Radioluminescence image reconstruction and analysis were performed using MATLAB R2012b (Mathworks, Natick, MA). The raw camera frames were processed using our methodology called “optical reconstruction of the beta-ionization track” (ORBIT), which is described in detail in a previous publication (16). Fluorescence micrographs were corrected for background effects by subtracting a dark image taken with a non-fluorescent sample and corrected for field flatness. Individual measurements of fluorescence of radiotracer activity were obtained by manually placing circular regions of interest (ROIs; diameter, 50 µm) on the brightfield micrograph, with similar ROIs on the background as controls. Cell radiotracer uptake or fluorescent signal was defined as the total pixel intensity within the ROI of the corrected images. Doublets or cell clusters were not quantified to avoid cross-talk between single cells. Threshold determination was done empirically by studying the data for any bimodal cell populations. The number of molecules of FLT was calculated using the number of observed decays per ROI as previously detailed (17). Briefly, the rate of radioactive decay, the number of frames, the time at which the acquisition was started, and the time taken to acquire the radioluminescence image were used to calculate the measured activity and therefore the number of FLT molecules per cell.
Results
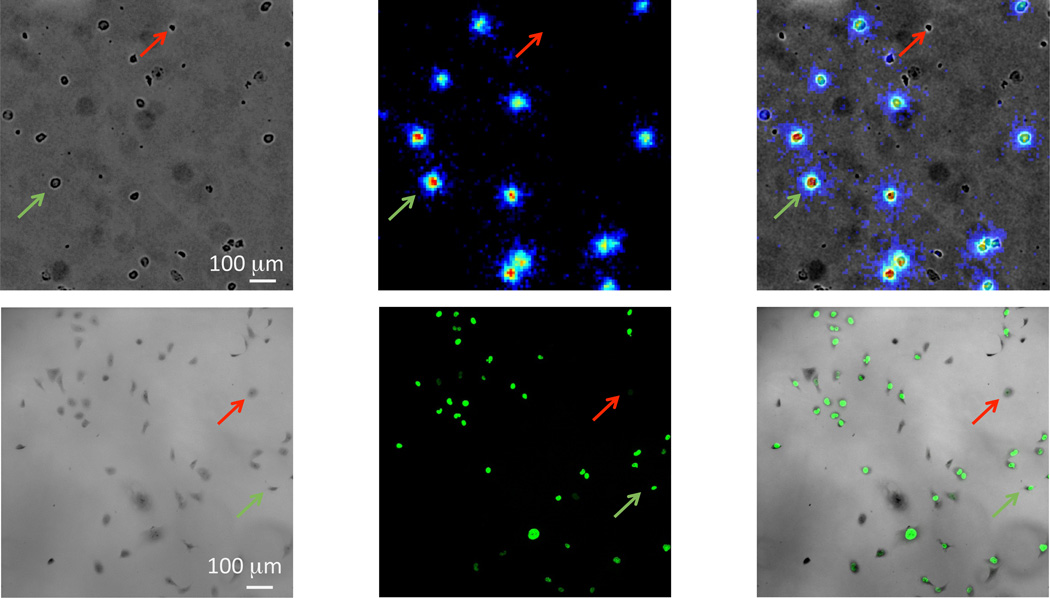
In Figure 2, we compare radioluminescence-based FLT imaging and fluorescence-based EdU imaging. These images demonstrate that it is possible to image FLT on a single-cell level. To acquire these data, MDA-MB-231 cells are grown for 48 h in high (20%) serum conditions, known to promote proliferation and increase the fraction of cells in S phase, where DNA replication occurs (18). Our first finding that is that FLT can be imaged using radioluminescence microscopy, allowing us to produce high quality images that demonstrate that the radiotracer is localized to individual cells. Given the high expression of TK1 by MDA-MB-231 cells (19), it is unsurprising that FLT is avidly taken up in these cells. Furthermore, despite the limited spatial resolution of radioluminescence microscopy (typically 20–25 µm), the images suggest that FLT is distributed throughout the cytoplasm, which is expected since FLT is not incorporated into the DNA. When a similar experiment is conducted using EdU, we observe that fluorescent microscopy can clearly identify individual cells that are in the S phase of cell division. In contrast to FLT, EdU is confined to the nucleus because the fixation and permeabilization steps of the staining protocol remove residual EdU from the cytoplasm. Fluorescence microscopy displays higher image quality than radioluminescence microscopy, with notably better spatial resolution and lower noise.
Figure 2.
Images of MDA-MB-231 cells imaged using FLT and radioluminescence microscopy (top row) or EdU and fluorescence microscopy (bottom row). The red arrows represent cells with no signal, while the green arrows represent cells with a positive fluorescence or radioluminescence signal.
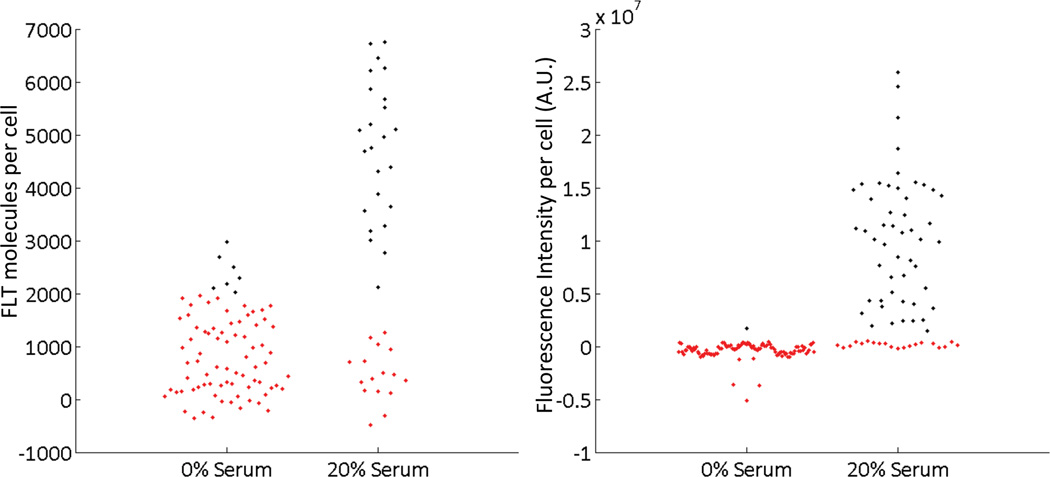
We next attempt to determine whether radioluminescence imaging of FLT uptake allows us to differentiate between cells that are proliferating rapidly and those that have undergone cell cycle arrest. As demonstrated previously, serum deprivation can cause cells to go into arrest and cell division to be stopped (20). We therefore grow cells in 0% serum and compare them to cells grown in 20% serum conditions. We observe that, at the 0% serum condition, EdU staining is almost entirely negative, with fewer than 1% of cells stained; in contrast, at the 20% serum condition, 71% of cells produce a positive signal (Figure 3). While only a certain subpopulation of cells are in the S phase at one time, EdU imaging is able to effectively differentiate between the two populations.
Figure 3.
Quantification of individual cell signals from FLT (left) and EdU (right). Both methods are able to distinguish between arrested cells grown in 0% serum conditions versus proliferating cells grown in 20% serum conditions.
When FLT signal is quantified from radioluminescence images for arrested cells (0% serum), we observe a key difference between FLT and EdU. Whereas EdU staining is almost entirely negative, uptake of FLT is weak but above background for most of the arrested cells (Figure 3). The uptake of FLT is heterogeneous in these cells, with a coefficient of variation of 77%.
At the high serum condition, the frequency distribution of FLT uptake in single cells appears to be bimodal (Figure 3). We therefore distinguish two subpopulations based on an empirical threshold of 2000 FLT molecules per cell (≈0.2 Bq/cell). The FLT-high subpopulation displays an average uptake of 5300 molecules per cell, nearly 5-fold higher than the FLT-low subpopulation (1100 molecules per cell). The FLT-low cell subpopulation is comparable in its uptake to the cells grown in 0% serum. Using the previously defined threshold, we observe that the number of FLT-positive cells ranges from 8% under 0% serum conditions to 61% under 20% serum conditions. However, these numbers should be considered with caution, as they are dependent on the threshold used to discriminate between the two populations.
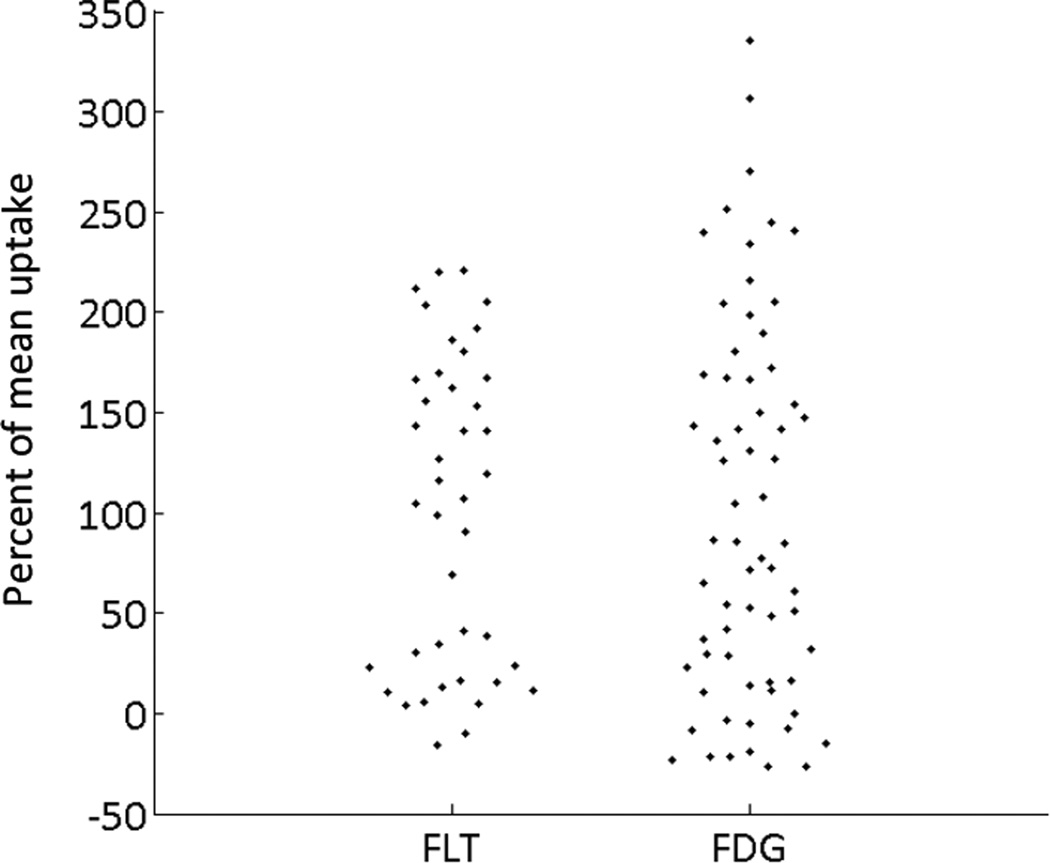
Finally, we compare the distribution of FLT and FDG uptake in the same cell line. (Figure 4) The uptake by single cells is normalized by the mean uptake for an easier comparison. We find that while the uptake of FDG follows a continuous distribution, with a number of cells concentrated around the mean, the FLT data appears to present a distinctive bimodal distribution, which may correspond to different proliferative states of cells.
Figure 4.
When individual cell data are quantified using FLT or FDG as the radiotracer, we observe different data distributions; while FLT (left) demonstrates two different cell distributions (which likely correspond to arrested- and proliferating cells), FDG produces a more continuous cell distribution.
Discussion
These data suggest that FLT is sensitive to the proliferation state of single cells. The side-by-side comparison with EdU demonstrates that the two tracers measure similar proliferation processes in cells, since the frequency of positive cells is similar for FLT and EdU. This single-cell side-by-side comparison of EdU and FLT is valuable not just to validate the use of FLT in a single cell setting, but also to create a point of comparison for EdU in conjunction with clinical uses of FLT.
As previously mentioned, the EdU imaging protocol involves the intercalation of the EdU molecule into DNA and is therefore localized to the nucleus, whereas FLT uptake simply measures the activity of TK1. Thus, the two assays are expected to produce related but different data. A key difference between the two methods is, of course, that the EdU protocol necessitates the fixation of cells prior to imaging. In contrast, FLT can image live cells directly, which allows for multimodal assays on the same cells or time-course measurements. An additional difference is that EdU staining requires multiple reagents and preparation steps, whereas the FLT imaging protocol simply requires an incubation step and a washing step, significantly decreasing the time between incubation and imaging. FLT uptake can also be measured in real time, as the molecule is being transported and retained by the cell. On the other hand, the actual process of fluorescence image acquisition is significantly less time-intensive than radioluminescence image acquisition, which can take anywhere between 15 minutes and 1 hour. Further, fixed cells can be mounted and saved for repeat analysis, whereas cells incubated with FLT can only be imaged as long as the radioactive tracer is actively decaying. The two imaging modalities therefore offer specific advantages and disadvantages.
The nucleoside analogues FLT and EdU both present a dichotomous distribution in their uptake by single proliferating cells but differ in several other ways. First, FLT is taken up by growth-arrested cells, albeit at a lower level, whereas EdU is virtually absent from these cells. This is because while both nucleoside analogues are being taken up by all cells, cytoplasmic EdU is washed away during the fixation and permeabilization step and, therefore, only cells that incorporate EdU into their DNA display a positive signal. This point is shown clearly in Fig. 3, which shows that EdU uptake by arrested cells is densely clustered around 0 but FLT uptake is above background. Another difference between EdU and FLT is that the two nucleoside analogues are measured through very different physical processes. While the incubation concentration of EdU is 20 mM EdU, the equivalent FLT concentration is seven orders of magnitude lower, at around 300 pM. This is because individual radionuclide decay can be detected with high sensitivity. However, because so few labeled molecules are present in the cell, radioluminescence microscopy images tend to look noisier, and the measured uptake values are subject to greater uncertainty due to counting noise.
In any given cell population, only a certain number of cells will be dividing at any given time, since the cell cycle is a property of individual cells. Therefore, we expect only those cells to be taking up thymidine and thymidine analogs. We do observe this dichotomous distribution in cells when studying FLT uptake but also notice some level of uptake even in serum-starved cells, which suggests that nucleoside transporters such as hENT1, hENT2, hCNT1, or hCNT3 (21), and enzymes such as TK1 may have some basal level of activity even in non-cycling cells (11). On average, FLT uptake by arrested cells is nearly 5-fold lower than that by proliferating cells. The level of FLT uptake in arrested cells is not significantly different between the various serum conditions. Therefore, aggregate FLT uptake, as measured on a PET scan, should be proportional to the frequency of actively cycling cells within the tumor.
In vitro methods have previously been used to measure FLT uptake in cells in the past, and have demonstrated good correlation of uptake with proliferation rate (11). However, single-cell measurements have not previously been done with FLT. We believe that this report will significantly aid in providing points of comparison between clinically used FLT data and single-cell proliferation measurements.
Conclusion
Our results show that increased uptake of FLT by proliferating tumors is due to a greater fraction of FLT-avid cells rather than a uniform change in FLT uptake by individual cells. This finding is consistent with the fact that FLT uptake is associated with expression of thymidine kinase 1 (TK1), which is only strongly expressed in actively dividing cells. We have found similarities between data collected on a single-cell level using FLT and EdU, and demonstrated that the distribution of FLT is atypical and significantly different from other radiotracers such as FDG. Together, these results suggest that, within the same patient, changes in FLT uptake are reflective of changes in the number of actively dividing cells, provided that other parameters remain the same.
Supplementary Material
Acknowledgments
We acknowledge funding from NIH grant R01CA186275, and support from the Stanford small-animal imaging facility and the Olympus Corporation for use of the LV200 microscope. We would like to thank Prof. Frederick Chin and Dr. Zheng Miao from the Stanford Radiochemistry facility, and Hongquan Li for assistance with image processing.
Footnotes
Disclosures: The authors declare no conflicts of interest.
Contributor Information
Debanti Sengupta, Stanford University School of Medicine, 1050 Arastradero Road, Palo Alto, CA 94304-5591, USA.
Guillem Pratx, Prof., Stanford University School of Medicine, 1050 Arastradero Road, Palo Alto, CA 94304-5591, USA.
References
- 1.Buck AK, Halter G, Schirrmeister H, et al. Imaging proliferation in lung tumors with PET: 18F-FLT versus 18F-FDG. J Nucl Med. 2003;44:1426–1431. [PubMed] [Google Scholar]
- 2.Zhang CC, Yan Z, Li W, et al. 18FFLT–PET Imaging Does Not Always “Light Up” Proliferating Tumor Cells. Clin Cancer Res. 2012;18:1303–1312. doi: 10.1158/1078-0432.CCR-11-1433. [DOI] [PubMed] [Google Scholar]
- 3.Troost EG, Vogel WV, Merkx MA, et al. 18F-FLT PET does not discriminate between reactive and metastatic lymph nodes in primary head and neck cancer patients. J Nucl Med. 2007;48:726–735. doi: 10.2967/jnumed.106.037473. [DOI] [PubMed] [Google Scholar]
- 4.Sen-Oran E, Ozmen V, Bilir A, et al. Is the thymidine labeling index a good prognostic marker in breast cancer? World J Surg Oncol. 2007;5:93. doi: 10.1186/1477-7819-5-93. [DOI] [PMC free article] [PubMed] [Google Scholar]
- 5.Thor AD, Liu S, Moore DH, II, Edgerton SM. Comparison of mitotic index, in vitro bromodeoxyuridine labeling, and MIB-1 assays to quantitate proliferation in breast cancer. J Clin Oncol. 1999;17:470–470. doi: 10.1200/JCO.1999.17.2.470. [DOI] [PubMed] [Google Scholar]
- 6.Salic A, Mitchison TJ. A chemical method for fast and sensitive detection of DNA synthesis in vivo. Proc Natl Acad Sci USA. 2008;105:2415–2420. doi: 10.1073/pnas.0712168105. [DOI] [PMC free article] [PubMed] [Google Scholar]
- 7.Urruticoechea A, Smith IE, Dowsett M. Proliferation marker Ki-67 in early breast cancer. J Clin Oncol. 2005;23:7212–7220. doi: 10.1200/JCO.2005.07.501. [DOI] [PubMed] [Google Scholar]
- 8.Keshgegian AA, Cnaan A. Proliferation markers in breast carcinoma. Mitotic figure count, S-phase fraction, proliferating cell nuclear antigen, Ki-67 and MIB-1. Am J Clin Pathol. 1995;104:42–49. doi: 10.1093/ajcp/104.1.42. [DOI] [PubMed] [Google Scholar]
- 9.Colozza M, Azambuja E, Cardoso F, Sotiriou C, Larsimont D, Piccart M. Proliferative markers as prognostic and predictive tools in early breast cancer: where are we now? Ann Oncol. 2005;16:1723–1739. doi: 10.1093/annonc/mdi352. [DOI] [PubMed] [Google Scholar]
- 10.Wei L, Hu F, Shen Y, et al. Live-cell imaging of alkyne-tagged small biomolecules by stimulated Raman scattering. Nat Methods. 2014;11:410–412. doi: 10.1038/nmeth.2878. [DOI] [PMC free article] [PubMed] [Google Scholar]
- 11.Rasey JS, Grierson JR, Wiens LW, Kolb PD, Schwartz JL. Validation of FLT uptake as a measure of thymidine kinase-1 activity in A549 carcinoma cells. J Nucl Med. 2002;43:1210–1217. [PubMed] [Google Scholar]
- 12.Munch-Petersen B, Cloos L, Jensen H, Tyrsted G. Human thymidine kinase 1. Regulation in normal and malignant cells. Adv Enzyme Regul. 1995;35:69–89. doi: 10.1016/0065-2571(94)00014-t. [DOI] [PubMed] [Google Scholar]
- 13.Been LB, Suurmeijer AJ, Cobben DC, Jager PL, Hoekstra HJ, Elsinga PH. 18FFLT-PET in oncology: current status and opportunities. Eur J Nucl Med Mol Imaging. 2004;31:1659–1672. doi: 10.1007/s00259-004-1687-6. [DOI] [PubMed] [Google Scholar]
- 14.Sengupta D, Miller S, Marton Z, Chin F, Nagarkar V, Pratx G. Bright Lu2O3: Eu Thin-Film Scintillators for High-Resolution Radioluminescence Microscopy. Adv Healthc Mater. 2015 doi: 10.1002/adhm.201500372. [DOI] [PMC free article] [PubMed] [Google Scholar]
- 15.Pratx G, Chen K, Sun C, et al. Radioluminescence microscopy: measuring the heterogeneous uptake of radiotracers in single living cells. PLoS One. 2012;7:e46285. doi: 10.1371/journal.pone.0046285. [DOI] [PMC free article] [PubMed] [Google Scholar]
- 16.Pratx G, Chen K, Sun C, et al. High-resolution radioluminescence microscopy of 18F-FDG uptake by reconstructing the β-ionization track. J Nucl Med. 2013;54:1841–1846. doi: 10.2967/jnumed.112.113365. [DOI] [PMC free article] [PubMed] [Google Scholar]
- 17.Türkcan S, Nguyen J, Vilalta M, et al. Single-Cell Analysis of 18FFluorodeoxyglucose Uptake by Droplet Radiofluidics. Anal Chem. 2015;87:6667–6673. doi: 10.1021/acs.analchem.5b00792. [DOI] [PMC free article] [PubMed] [Google Scholar]
- 18.Bell SP, Dutta A. DNA replication in eukaryotic cells. Annu Rev Biochem. 2002;71:333–374. doi: 10.1146/annurev.biochem.71.110601.135425. [DOI] [PubMed] [Google Scholar]
- 19.Direcks W, Berndsen S, Proost N, et al. 18FFDG and 18FFLT uptake in human breast cancer cells in relation to the effects of chemotherapy: an in vitro study. Br J Cancer. 2008;99:481–487. doi: 10.1038/sj.bjc.6604523. [DOI] [PMC free article] [PubMed] [Google Scholar]
- 20.Jang B-C, Sanchez T, Schaefers H-J, et al. Serum withdrawal-induced post-transcriptional stabilization of cyclooxygenase-2 mRNA in MDA-MB-231 mammary carcinoma cells requires the activity of the p38 stress-activated protein kinase. J Biol Chem. 2000;275:39507–39515. doi: 10.1074/jbc.M003224200. [DOI] [PubMed] [Google Scholar]
- 21.Paproski RJ, Ng AM, Yao SY, Graham K, Young JD, Cass CE. The role of human nucleoside transporters in uptake of 3 ′ -deoxy-3 ′ -fluorothymidine. Mol Pharmacol. 2008;74:1372–1380. doi: 10.1124/mol.108.048900. [DOI] [PubMed] [Google Scholar]
Associated Data
This section collects any data citations, data availability statements, or supplementary materials included in this article.


