. 2017 Jan 10;6:e21052. doi: 10.7554/eLife.21052

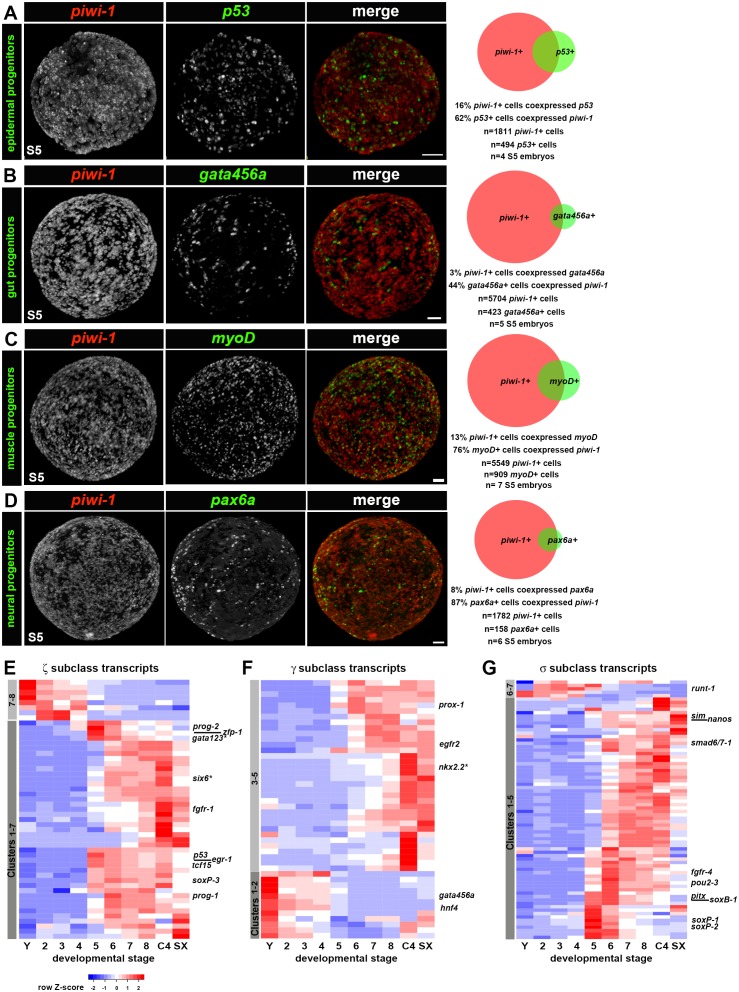
Figure 6. Adult lineages arise within the piwi-1+ blastomere population as organogenesis begins.

(AD) Developmental transcription factors implicated in tissue specific differentiation programs are expressed in subpopulations of piwi-1+ cells during S5. Fluorescent WISH with piwi-1 (red) and p53 (A), gata456a (B), myoD (C) and pax6a (D) (green) riboprobes on S5 embryos. Embryos in (B-D) were costained with VAL-like, a temporary embryonic pharynx specific marker (also in red). Right: Venn diagrams depict percentages of cells that were single or double positive for piwi-1 and the indicated TFs. Scale bars: 100 µm. (EG) Hierarchical clustering of zeta (ζ, E), gamma (γ, F) and sigma (σ, G) neoblast subclass-enriched transcripts during embryogenesis (Y and S2–S8), and in asexual (C4) and virgin sexual (SX) adults.

DOI: http://dx.doi.org/10.7554/eLife.21052.052

Figure 6—source data 1. Behavior of ζ, γ and σ adult asexual neoblast subclass-enriched transcripts during embryogenesis.
Hierarchical clustering of Zeta (ζ) , Gamma (γ) and Sigma (σ) subclass transcripts was performed using normalized RPKM data from the single embryo RNA-Seq developmental time course. Average RPKM values for Y, S2–S8 embryos and for C4 and SX adults are included. Transcripts with enriched at one or more embryonic stages are flagged.
DOI: 10.7554/eLife.21052.053

Figure 6.

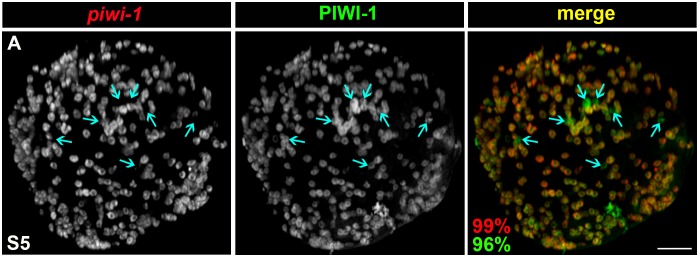
Figure 6—figure supplement 1. PIWI-1 protein may perdure in cells committed to differentiation.

Figure 6—figure supplement 1.

(A) Fluorescent WISH costaining on S5 embryos using riboprobes against piwi-1 (red) and antibodies against PIWI-1 protein (green). Cyan arrows: single positive cells for which PIWI-1 protein, but not piwi-1 mRNA, was detected. Scale bar: 100 µm. 99 ± 0.4% piwi-1+ cells were double positive for PIWI-1 protein, n = 4,152 piwi-1+ cells scored. 96 ± 3.1% PIWI-1 positive cells were double positive for piwi-1 mRNA, n = 4,296 PIWI-1+ cells scored. n = 4 S5 embryos.