. 2016 Dec 28;5:e21022. doi: 10.7554/eLife.21022

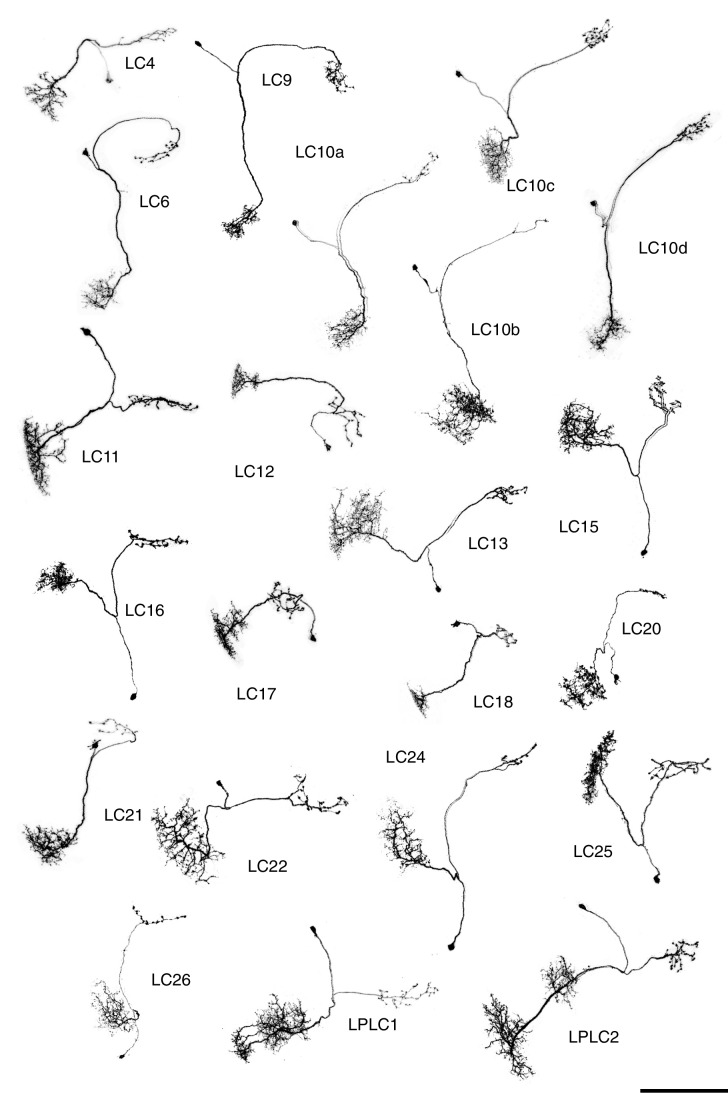
Figure 7. Single cell shapes of LC neurons.

Maximum intensity projection images of MCFO labeled single cells were manually segmented to exclude other labeled cells or background signal and converted to inverted grayscale images. Cells are shown in a similar orientation (with dorsal approximately up and lateral approximately to the left) and at the same scale. Scale bar represents 50 µm.

DOI: http://dx.doi.org/10.7554/eLife.21022.017

Figure 7.

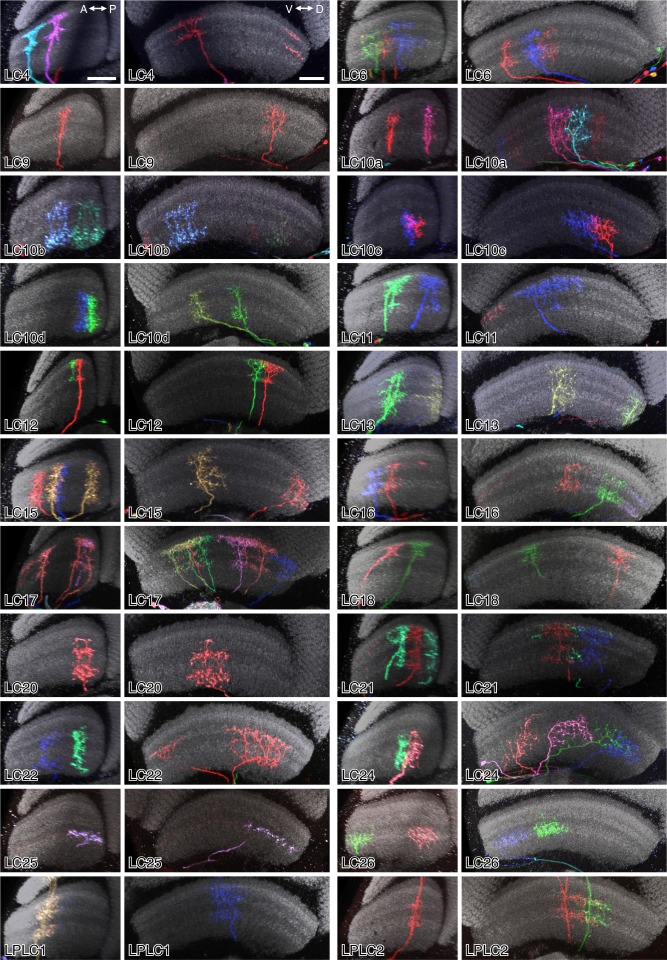
Figure 7—figure supplement 1. Layer patterns of single cells of 22 LC neuron types.

Figure 7—figure supplement 1.

Images are reoriented views (generated using Vaa3D) of MCFO labeled LC neurons. Anti-Brp neuropil marker is in grey. For each cell type, two different views, along the AP and along the DV axes of the lobula, respectively, are shown. The two panels for a cell type can either show the same specimen in two views or two different specimens. Scale bars in the LC4 panels represent 20 µm; images of other cell types are shown at very similar scale.
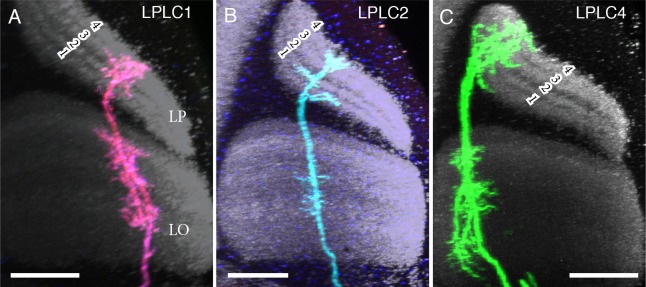
Figure 7—figure supplement 2. Single cell labeling of LPLC arbors in lobula and lobula plate.

Figure 7—figure supplement 2.

(A) LPLC1. (B) LPLC2. (C) LPLC4. Numbers indicate the four LP layers (Fischbach and Dittrich, 1989). Similar to lobula layers, the LP layers can be identified by changes in the intensity of anti-Brp labeling: Each LP layer shows a band of strong anti-Brp signal flanked by weaker labeling. All three LPLC cell types have processes in all lobula plate layers and several layers of the lobula but differ in details of arbor structure and layer patterns. For example, lobula layers of LPLC4 (mainly Lo2, Lo4 and Lo6) are different from both LPLC1 (Lo2-Lo4 and Lo5B) and LPLC2 (Lo4 and Lo5B). The presence of processes in multiple lobula plate layers, as shown by all LPLC types, could support responses to stimuli that combine different directions of motion, such as a visual loom (Schilling and Borst, 2015). Scale bars represent 20 µm.