

Abstract
Statistical learning (SL) is believed to enable language acquisition by allowing individuals to learn regularities within linguistic input. However, neural evidence supporting a direct relationship between SL and language ability is scarce. We investigated whether there are associations between event-related potential (ERP) correlates of SL and language abilities while controlling for the general level of selective attention. Seventeen adults completed tests of visual SL, receptive vocabulary, grammatical ability, and sentence completion. Response times and ERPs showed that SL is related to receptive vocabulary and grammatical ability. ERPs indicated that the relationship between SL and grammatical ability was independent of attention while the association between SL and receptive vocabulary depended on attention. The implications of these dissociative relationships in terms of underlying mechanisms of SL and language are discussed. These results further elucidate the cognitive nature of the links between SL mechanisms and language abilities.
Keywords: implicit learning, statistical learning, sequential learning, P300, P600
1. Introduction
Historically, two areas of controversy in the study of language are: (1) to what extent language is innately specified versus learned through experience and (2) to what extent the mechanisms activated during language acquisition are specific to language processing (i.e., domain-specificity, Chomsky, 2011; Gallistel, 2011; Newport, 2011). Increasingly, research findings and theory have suggested that language is largely experience-dependent and mediated by domain-general processes that allow organisms to perceive and learn environmental patterns (Aslin & Newport, 2012; Christiansen & Chater, 2015; Erickson & Thiessen, 2015; Saffran, Aslin, & Newport, 1996). This type of implicit learning or statistical learning (SL) can be defined as the ability to extract probabilities from a series of discrete elements and to form expectations about upcoming events based on that information (Fiser & Aslin, 2001; Kirkham, Slemmer, & Johnson, 2002; Krogh, Vlach, & Johnson, 2013; Saffran, 2003; Siegelman & Frost, 2015; Turk-Browne, Scholl, Johnson, & Chun, 2010). SL can be construed as arising from general principles of cortical plasticity, in which experience with a specific type of input leads to improvements in the processing and efficiency of neural networks that are devoted to processing that type of input (Reber, 2013).
SL is particularly important for the development of language (Arciuli & Torkildsen, 2012; Conway & Pisoni, 2008; Gervain & Mehler, 2010; Gogate & Hollich, 2010; Kuhl, 2004; Reber, 1967) including the acquisition of word boundaries (Saffran et al., 1996), syntax (Ullman, 2004), word order (Conway, Bauernschmidt, Huang, & Pisoni, 2010), and receptive vocabulary (Ellis, Robledo, & Deák, 2014). The link between SL and language ability is further supported by research showing that impairments to SL may contribute to some of the observed language and learning difficulties (Nicolson & Fawcett, 2007; Ullman & Pierpont, 2005) such as in dyslexia (Du & Kelly, 2013; Howard, Howard, Japikse, & Eden, 2006), specific language impairment (Evans, Saffran, & Robe-Torres, 2009), autism (Jeste et al., 2015), and populations with language delays caused by a period of deafness early in development (Conway, Pisoni, Anaya, Karpicke, & Henning, 2011).
Early in the study of SL, most research focused on understanding its underlying mechanisms, processes, and constraints. More recently, research endeavors have taken an individual-differences approach to determine whether SL abilities are associated with language skill as a way to provide a more direct empirical connection between the two constructs. In these studies, performance on SL tasks has been found to be significantly correlated with measures of language performance (e.g., Arciuli & Simpson, 2012; Conway et al., 2010; Ellis et al., 2014; Misyak, Christiansen, & Tomblin, 2010; Spencer, Kaschak, Jones, & Lonigan, 2014). However, with few exceptions such as Morgan-Short et al. (2014, 2015) who reported correlations between SL performance measured with the Weather Prediction Task (Foerde, Knowlton, & Poldrack, 2006) and neural activation of second language learning in adults, most of this research has been based only on behavioral data. This represent a potential limitation because behavioral measures can only assess the final result of a complex chain of multiple operations that may include perceptual/cognitive mechanisms, response selection, and motor preparation and execution. In contrast, neural measures such as event-related potentials (ERPs) follow more directly (in real-time) the processing of information of the cognitive mechanisms of interest (e.g. Coch & Holcomb, 2003; Schwartz, Federmeier, van Petten, Salmon, & Kutas, 2003). Additionally such measures do not necessarily require an overt motor response.
Therefore the nature of the linkage between SL and language ability could be further explored with a neurophysiological approach. This approach remains to date very limited (Christiansen, Conway, & Onnis, 2012; Tabullo, Sevilla, Segura, Zanutto, Wainselboim, 2013). For example, Christiansen et al. (2012) measured the ERP correlates of SL using an artificial language paradigm that required participants to learn the mapping between a visual scene of unfamiliar shapes and non-word sequences. The visual scenes and non-word sequences were generated according to an artificial grammar that specified the structural relations among the stimuli. After the artificial grammar had been learned, violations of the structural regularities elicited ERP correlates of SL that were very similar in amplitude and scalp topography to a modulation of the P600 component, an ERP correlate of syntactic violations in natural language. This similarity was further confirmed statistically by the lack of significant difference between the P600 effects (ERP to syntactic violations minus ERP to syntactically correct trials) observed with both artificial and natural language grammars and a significant correlation between the ERP effects on the two tasks. The authors argued that the P600 generated by the two types of syntactic violations were indistinguishable and hence that SL (observed with the artificial grammar paradigm) and language processing (observed with syntactic processing within a natural grammar paradigm) tap into the same underlying neural mechanisms providing evidence for a domain-general processing mechanism underlying both artificial and natural grammar processing, albeit still within a language-like context.
However, to further test the extent to which domain-general SL is related to natural language processing, it is necessary to employ SL tasks that are even less language-like than the one used by Christiansen et al. (2012). For instance, that study incorporated non-word sequences that are likely to tap into phonological coding processes. Christiansen et al. (2012) also incorporated an artificial language and grammar that was meant to (at least superficially) reflect basic aspects of natural language, with both a referent system (or vocabulary) and a simple form of syntax. Thus, the SL task used in this experiment incorporated elements of language (phonology, visual referent system, etc.) and therefore may have been limited in its ability to fully examine the domain-generality of SL.
One experimental task that might be useful in this regard is that used by Jost, Conway, Purdy, Walk, and Hendricks (2015). In this variation of the standard oddball paradigm (Squires, Squires, & Hillyard, 1975), participants were presented with sequences of visual, non-linguistic stimuli (colored circles; randomly assigned between participants). Some stimuli were “standards” (i.e., that were presented repeatedly). The remaining “deviant” stimuli belonged to one of two different categories: predictor or target. The participants were asked to respond to the target stimuli by pressing a button. Participants were not told that the other type of deviant stimuli—the predictor stimuli—would precede the target with one of three different levels of fixed contingent probability in relation to the target (i.e., “high”, “low”, and “null” predictability with 90%, 20%, and 0% probabilities of the target following each predictor type, respectively). With exposure to the three predictor-target probabilities, participants learned these statistical associations as revealed by a late positive ERP component that increased with predictor-target probability. The ERP component displayed the greatest amplitude for the “high” compared to the “low” or “null” predictors and hence was interpreted as an ERP index of SL.
Jost et al. (2015) proposed that the observed late positivity was a P300, an ERP component reflecting stimulus evaluation-based decision or categorization processes as well as memory updating of contextual representations (for a review, see Polich, 2007). However, given the late latency of the ERP effect reported by Jost et al. (2015), an alternative interpretation could be that they found a modulation of the P600 component. (Note that Coulson, King, and Kutas (1998) have suggested that the P300 and P600 may actually be the same ERP component, but see Frisch, Kotz, von Cramon, and Friederici, 2003). Interestingly, there is extensive evidence that the P600 is a correlate of syntactic violation for both artificial grammar paradigms (Christiansen et al., 2012; Friederici, Steinhauer, & Pfeifer, 2002) and natural grammar paradigms (Gunter, Stowe, & Mulder, 1997; Hagoort, Brown, & Groothusen, 1993; Neville, Nicol, Barss, Forster, & Garrett, 1991). Therefore, it is possible that the component observed by Jost et al. (2015) was in fact a P600 reflecting statistical rule-based predictor-target contingency variation. These results may thus provide further, albeit somewhat indirect, support for a link between SL and language processing. To provide a more direct test of this relationship, here we examine whether ERP correlates elicited in a task similar to Jost et al. (2015) are associated with participants' language ability.
In the present study, the statistical structure of input sequences provided to participants was similar to the one used by Jost et al. (2015). Therefore, we expected to find a similar late positivity that would increase with target predictability, i.e. with predictor-target statistical contingency. Hence, our operational definition of SL at the neurophysiological level was a centro-parietal late positive ERP effect (between experimental “Predictability” conditions with varying predictor-target statistical contingency). In addition, similar to most behavioral studies of SL such as serial reaction time tasks (Nissen & Bullemer, 1987), our operational definition of SL was also defined by participants' response times (RTs) on the SL task with faster RT to targets as predictability (predictor-target statistical contingency) increases i.e. fastest RT when the target follows the “high predictability” (HP) rather than the “low predictability” (LP) stimuli.
To test the relationship between SL and language ability, we used three measures of language performance. Given that SL has been implicated in vocabulary acquisition (Ellis et al., 2014; Howard et al., 2006), receptive vocabulary was measured with the “Peabody Picture Vocabulary Test IV” (PPVT-IV; Dunn & Dunn, 2007). Because previous research has suggested a link between SL and performance on natural language grammar (e.g., Christiansen et al., 2012; Tabullo et al., 2013), the second was a measure of grammatical ability, the “Grammaticality Judgment” subtest of the Comprehensive Assessment of Spoken Language (CASL; Carrow-Woolfolk, 1999). The last measure assessed the ability to predict words within a sentence: the “Sentence Completion” subtest of the CASL (Carrow-Woolfolk, 1999). This was included because Conway et al. (2010) observed a behavioral correlation between SL and the ability to predict the final words in spoken sentences.
One additional contribution of the present study is that it also examines whether the ERP correlates of SL are related to language ability while controlling for each individual's general level of selective attention. This control is important to demonstrate the specificity of the relationship between SL and language ability. Indeed, general selective attention could, in principle, affect performance on any task (e.g. Schneider & Shiffrin, 1977) including SL (for a review, see Daltrozzo & Conway, 2014) and language assessments. Thus, it is possible that inter-individual variability in attention may become a confounding variable if not controlled. That is, a given participant may devote a high level of attention to an SL task and also to language assessments thereby scoring better on all measures compared to a participant who devotes less attention and thereby scores lower overall. This general cognitive effect, if not controlled, could drive any observed interactions between SL and language ability. Therefore, in the present study we attempted to control for attention by requiring participants to complete an additional task measuring general selective attention, and then treating it as a covariate in our analyses.
We predicted that, consistent with previous evidence of a link between SL and language ability, our behavioral (i.e. RT effect between two experimental conditions of target “Predictability”: HP and LP) and neurophysiological (i.e. centro-parietal late positive ERP effect between HP and LP) operational definitions of visual SL would be associated with measures of language ability in adults independently of variations of attention.
2. Materials and Methods
In this within-subject design, participants were first assessed for their general level of selective attention with a Flanker task (Eriksen & Eriksen, 1974) and then completed a visual SL task while ERPs were recorded. Finally, participants were administered three standardized measures of language ability.
2.1 Participants
Seventeen participants (11 females, M = 23.94 years, SD = 8.61, 18-49 years) from Georgia State University participated in the study to receive class credit. Participants reported no language, cognitive, neurological, or psychological deficits. All were native English speakers and all except two were right-handed according to the Edinburg Handedness Inventory (Oldfield, 1971). All participants provided written informed consent to the study, which was conducted in accordance with the guidelines of the Declaration of Helsinki and approved by the local Ethics Committee (the Institutional Review Board of Georgia State University).
2.1 Reliability of our Measures
The reliability of our behavioral and neurophysiological measures were computed from the data of our sample of participants using the standard Cronbach's α coefficient (Cronbach, 1951) as well as the “greatest lower bound” (glb, Woodhouse & Jackson, 1977) because the glb is a better lower bound estimate of the reliability than α (Sijtsma, 2009) with: α < glb < true reliability < 1. α and glb were computed using the cronbach() function from the psy library and the glb() function from the psych library in R version 3.2.0.
2.2 Language Measures
Participants were administered three standardized measures of language: the Peabody Picture Vocabulary Test, 4th Edition (PPVT-IV; Dunn & Dunn, 2007); and the Grammaticality Judgment (GJ) and Sentence Completion (SC) subtests of the Comprehensive Assessment of Spoken Language (CASL; Carrow-Woolfolk, 1999). While the CASL is only normed through age 21 years and 11 months, some of our participants exceeded that age. Consequently, we chose to analyze raw scores for all measures instead of standardized scores that depend on the CASL norms. Although the CASL subtests were not intended for use with participants above the age of 21, the raw scores still give an absolute measure of grammatical and sentence prediction abilities, which is appropriate for the purpose of the present study that is focused on these abilities in each of our participants in relation to the other participants of the study rather than in relation to an age-peer population norm.
Peabody Picture Vocabulary Test-IV
The PPVT-IV is a widely used assessment of standard American English receptive vocabulary in which examinees are asked to select from four full-color drawings the one that best depicts the meaning of a spoken word. There are a total of 228 items representing various parts of speech on the test, each of which is scored as correct or incorrect, for a maximum possible raw score of 228. However, items are arranged into sets of 12, and administration discontinues when a participant responds incorrectly to eight items within one set. Dunn and Dunn (2007) provide Cronbach's α by age range. Our participants spanned 6 age ranges: 17-18 α = .96, 19-21 α = .95, 22-24 α = .93, 25-30 α = .95, 31-40 α = .94, and 41-50 α = .97. Based on the data of our sample of participants (from the 45 items that were completed by all participants and where the standard deviation across participants was not null) we computed the lower bound of the reliability of the PPVT-IV measure according to α and glb (see “Reliability of our Measures” section above): α = .734; glb = .849.
Grammaticality Judgment
The GJ subtest is part of the Syntactic Language Category of the CASL. It measures an individual's ability to identify and correct grammatical errors within a sentence. Errors are assessed in ten syntactic areas: noun-verb agreement, noun number, verb tense, pronouns, negatives, prepositions, irregular forms, direct/indirect objects, active/passive voice coordination, and embedding. Sentences both with and without errors are read aloud to the examinee, and he or she is asked to determine if “the sentence is the correct way to speak in class.” If not, the participant is asked to change a single word to correct the sentence. Practice sentences include, “The boy are happy” (for which the correction could be “The boys are happy” or “The boy is happy”) and “My mother is at home” (which is correct as is). High performance on this test requires both grammar ability and metalinguistic skill that allows for separately attending to the meaning and form of a sentence. According to Carrow-Woolfolk (1999), the ability to judge grammaticality is different from the ability to choose appropriate morphemes and requires that basic sentence patterns of the native language, English in this case, be stored at a deep level. The GJ subtest measures how deep an examinee's knowledge is by scoring ability to recognize an error (1 point) and the ability to correct it (1 point) separately. The maximum raw score is 103. Carrow-Woolfolk provides Spearman-Brown adjusted Rasch split-half internal reliability calculations by age band. Our participants spanned two age bands and beyond: 16-19 r = .90 and 19-22 r = .85. Based on the data of our sample of participants (from the 13 items that were completed by all participants and where the standard deviation across participants was not null) we computed the lower bound of the reliability of the GJ measure according to α and glb (see “Reliability of our Measures” section above): α = .696; glb = .905.
Sentence Completion
The SC subtest is part of the Lexical/Semantic Language Category of the CASL. It measures an individual's ability to retrieve and express one of a handful of appropriate words that will accurately complete a spoken sentence. The examiner reads a sentence aloud leaving out the last word. The examinee is tasked with completing the sentence using a single grammatically and semantically correct word that is not already contained in the sentence. Appropriate responses include nouns, verbs, adjectives, and adverbs. An example of a practice item is, “In order to start the car, Dad must turn the ____”. Acceptable responses include “key” or “ignition”. As the test advances, sentences become much longer and more complex with more complicated vocabulary and concepts. Performance on this assessment requires understanding of sentence context and use of it to make a prediction, and retrieve and orally express an appropriate word. Understanding of vocabulary, grammar, and event knowledge and memory are critical. The maximum raw score for this subtest is 61. Spearman-Brown split-half reliability for 16-19 years is reported as .76 and for 19-22 years as .82. Based on the data of our sample of participants (from the 26 items that were completed by all participants and where the standard deviation across participants was not null; since the glb computation on 26 items resulted in a non-positive definite matrix, the computation was performed on only 25 items) we computed the lower bound of the reliability of the SC measure according to α and glb (see “Reliability of our Measures” section above): α = .487; glb =.696.
2.3 Flanker Task: Control of the general level of selective attention
To control for possible variations in the general level of selective attention across participants, we measured the performance on a Flanker task (Eriksen & Eriksen, 1974; Shalev & Tsal, 2003), which was collected immediately before the SL task. The Flanker task is a visual search task measuring a person's ability to detect relevant information in the midst of irrelevant information (Eriksen & Eriksen, 1974). This task is commonly used to test response inhibition and selective attention (Casey et al., 2000; Fenske & Eastwood, 2003; Hübner, Steinhauser, & Lehle, 2010; Lavie, Hirst, de Fockert, & Viding, 2004). It comprises a central target (e.g., ‘<’) flanked by non-target stimuli, which either match the direction of the target in half of the trials (congruent stimuli; e.g. ‘≪≪<’) or are in the opposite direction of the target in the rest of the trials (incongruent stimuli; e.g. ‘≫<≫’). A directional response (left or right) is assigned to the target stimulus. Response times for incongruent trials are typically longer than for congruent trials—a difference known as the Flanker effect (Eriksen & Eriksen, 1974). The Flanker task allows the testing of how well attention is restricted to a particular object or location (Fenske & Eastwood, 2003) and thus can be used as a measure of selective attention (Lavie et al., 2004). Participants were required to give a speeded left- or right-hand response to indicate the direction of the target. The number of correct button-press responses with the left and right hand was counterbalanced across congruent and incongruent experimental conditions. A new trial was presented immediately after the participant's response. Immediately after the Flanker task, participants were administered the SL task. Flanker effect scores were computed for accurate trials only by subtracting mean response times for incongruent trials from mean response times for congruent trials. Wöstmann et al. (2013) report a Cronbach α of 0.68 for this measure. Based on the data of our sample of participants we computed the lower bound of the reliability of the Flanker Effect measure according to α and glb (see “Reliability of our Measures” section above): α = .472, glb = .910.
2.4 Sequential Learning Task
In the SL task (Figure 1.A) colored circles appeared in the center of the computer screen on a dark background similar to those used in Jost et al. (2015). Stimuli were displayed for 500ms followed by a dark screen displayed for an additional 500ms. Thus, the visual stimuli were presented with a 1000ms stimulus onset asynchrony.
Figure 1.
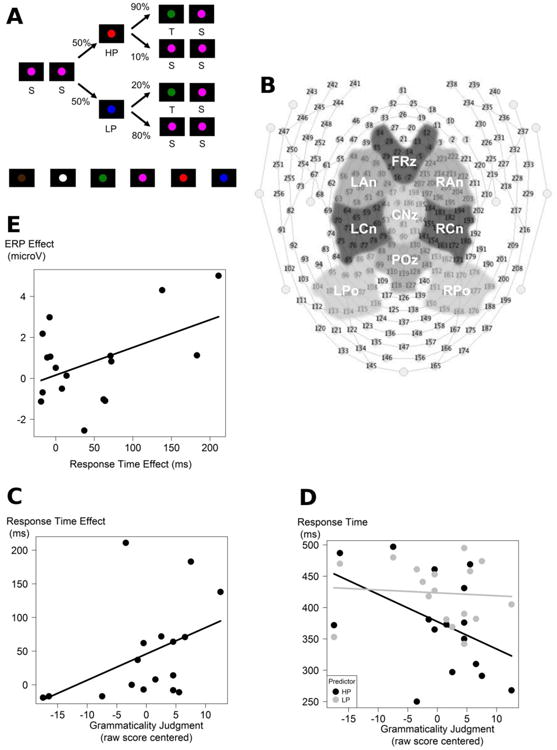
A) Sample sequence of colored circles. HP: “High Predictability” predictor, LP: “Low Predictability” predictor, T: Target, S: Standard. For each participant, HP, LP, T, and S were pseudo-randomly assigned to one of six colored circles (brown, white, green, pink, red, and blue; see bottom of the figure). B) 256 Electrical Geodesic Inc. sensor net for EEG recordings and the nine regions of interest. Left (LAn), middle (FRz), and right anterior (RAn); left (LCn), middle (CNz), and right central (RCn); and left (LPo), middle (POz), and right posterior (RPo) regions used for topographic analyses. C) Scatter plot between the SL Response Time (RT) effect and the Grammaticality Judgment (GJ) raw score centered. RT effect: RT in the Low Predictability condition (LP) minus RT in the High Predictability condition (HP). Vertical unit: millisecond. D) Scatter plot between the RT in the high and low predictability conditions and the GJ raw score centered. This figure indicates reduced RT as GJ raw score increased in only the HP condition (dark line), i.e. higher SL with higher GJ raw score was related to learning the predictor-target statistical contingency in the HP condition. The grey line indicates RT as a function of GJ raw score in the LP condition. Vertical unit: millisecond. E) Scatter plot between the neurophysiological and behavioral operational definitions of sequential learning. SL ERP effect (ERP in the HP condition minus ERP in the LP condition) over the centro-parietal (POz) region of interest between 500ms and 1000ms (Unit: microvolts) - SL RT effect (RT in the LP condition minus RT in the HP condition) (Unit: ms).
Participants were instructed to press a button as quickly as possible when a given “target” stimulus was presented. Each participant was presented with a target selected pseudo-randomly from among a set of six colored circles stimuli. Unbeknownst to the participants, the sequence of stimuli followed a set of fixed statistical regularities (see Figure 1.A). For each participant, in addition to the target stimulus, one of the stimuli was pseudo-randomly chosen as a “standard” stimulus, one as a “high predictability” (HP) predictor, and one as a “low predictability” (LP) predictor. During each trial the standard stimulus was repeated a pseudorandom number of times. Next, one of the two (HP or LP) predictors was presented, each with a 50% probability of occurrence. The HP predictor was followed by the target in 90% of the trials and by the standard in 10% of the trials. The LP predictor was followed by the target in 20% of the trials and by the standard in 80% of the trials. Each trial concluded with a second series of standards of a random length.
For each predictability condition (HP and LP) there were 50 trials for a total of 100 trials divided amongst five blocks of 20 trials. All trials were randomly ordered across the two predictability conditions (HP and LP) in a continuous fashion such that the participant was unable to distinguish one trial from another. A break lasting a minimum of 30 seconds was given between each block. Stimuli were presented on a Dell Optiplex 755 computer running E-Prime version 2.0.8.90.
2.5 Electroencephalography Acquisition
While the participant performed the SL task, the electroencephalograph (EEG) was recorded from 256 scalp electrodes using an Electrical Geodesic Inc. sensor net (Figure 1.B) and was pre-processed using Net Station version 4.3.1 with subsequent processing using custom scripts written in MATLAB (version R2012b 8.0.0783, MathWorks) and the EEGLAB toolbox (version 10.2.2.2.4a; Delorme & Makeig, 2004). Active electrode impedances were kept below 50 kΩ. The EEG was acquired with a 0.1 to 100 Hz band-pass filter at 250 Hz with vertex reference and then re-referenced to the average reference, resampled to 256 Hz (to allow filtering with Fast Fourier Transformation), and low-pass filtered at 30 Hz. Participants were instructed to refrain from blinking throughout the experiment. Eye blink artifacts were corrected by independent component analysis. Other remaining artifacts were removed manually. This procedure removed 18.2% of the trials [HP: M = 17.5%, SD = 12.5; LP: M = 18.8%, SD = 14.0; two-tailed paired Student: t(16) = 0.723, p = .480, N = 17; Wilcoxon matched-pairs signed-ranks test: W = -11, p = .762, n pairs = 15, two pairs excluded because values in each sample were equal]. The continuous EEG was segmented into epochs -200ms to + 1000ms with respect to the predictor onset. ERPs were baseline-corrected at 200ms prestimulus. Separate ERPs were computed for each participant, predictability condition, and electrode. All experimental sessions were conducted in a 132 square foot double-walled, sound-deadened acoustic chamber.
2.6 Statistical procedures
Individual mean response times (RT) of the SL task to target stimuli following the HP and LP predictors and mean amplitude ERPs time-locked to the predictors between 500ms and 1000ms (time-window based on the grand average; Figure 2) were analyzed with separate linear mixed models (LMM, see Supplementary Materials and Methods), one for each language score.
Figure 2. Grand averaged ERPs.

N=17 participants; Nine regions of interest (see Figure 1.B); Grand averaged ERPs in response to the HP (solid thick lines) and LP (dotted thin lines) predictors (positivity upward in microvolts; time in seconds).
To estimate the lower bound of the reliability of our behavioral and our neurophysiological operational definitions of SL based on the data of our sample of participants, we computed the SL RT effect (RT in the LP condition minus RT in the HP condition) and the SL ERP effect (mean ERP between 500ms and 1000ms over the centro-parietal ROI (POz) in the HP condition minus corresponding mean ERP in the LP condition). The lower bounds of the corresponding reliabilities are: α = .892 and glb = .974 for the SL RT effect; and α = .897 and glb = .944 for the SL ERP effect.
3. Results
3.1 Language Measures Mean and Correlation
The mean raw scores on the three language measures were: GJ: M = 78.5, SD = 7.9; PPVT-IV: M = 205.9, SD = 7.3; and SC: M = 49.1, SD = 3.2. These scores were uncorrelated [GJ vs. PPVT-IV: rs = .095, p = .717; GJ vs. SC: rs = -.150, p = .565; PPVT-IV vs. SC: rs = .440, p = .077; N=17; two-tailed].1
3.2 Sequential Learning Task Response Times
The applied LMMs for the analysis of the RTs are described in Table 1 and Table 2 (See Supplementary Material). The LMM on individual mean RTs showed a main effect of Predictability [F(1,15) = 8.04; p = .013] indicating faster responses to the target following the HP predictor (M = 379ms, SD = 71) compared to the LP predictor (M = 424ms, SD = 51) but no interaction that reached significance between Predictability and any of the language scores, although the interaction with GJ was marginally significant [PPVT-IV raw score: F(1,15) = 2.08, p = .169; GJ raw score: F(1,15) = 3.46, p = .083; SC raw score: F(1,15) = 0.65, p = .432]. Because the 2-way interactions were not significant, Attention was not included in any of the models.
Table 1.
| Likelihood Ratio Tests
| |||||||||
|---|---|---|---|---|---|---|---|---|---|
| Model | Model Specifications | df | AIC | BIC | LL | Deviance | χ2 | df | p |
| Behavioral Data | |||||||||
|
| |||||||||
| GJ | |||||||||
|
| |||||||||
| m1 | RT ∼ Predictability * GJ + (1 | Participant) | 6 | 381 | 390 | -185 | 369 | |||
|
| |||||||||
| PPVT | |||||||||
|
| |||||||||
| m2 | RT∼ Predictability * PPVT + (1 | Participant) | 6 | 383 | 392 | -186 | 371 | |||
|
| |||||||||
| SC | |||||||||
| m3 | RT ∼ Predictability * SC + (1 | Participant) | 6 | 386 | 395 | -187 | 374 | |||
|
| |||||||||
| Neurophysiological Data | |||||||||
|
| |||||||||
| GJ | |||||||||
|
| |||||||||
| m4 | EEG mean 500-1000ms ∼ Predictability * ROI * GJ + (1 | ROI) + (1 | Participant) | 39 | 16186 | 16437 | -8054 | 16108 | |||
| m5 | EEG mean 500-1000ms ∼ Predictability * ROI * GJ + (1 | ROI) + (1 | Participant) + Attention:Predictability:ROI:GJ | 57 | 16115 | 16482 | -8001 | 16001 | 107 | 18 | <.001 |
|
| |||||||||
| PPVT | |||||||||
|
| |||||||||
| m6 | EEG mean 500-1000ms ∼ Predictability * ROI * PPVT + (1 | ROI) + (1 | Participant) | 39 | 16545 | 16796 | -8234 | 16467 | |||
| m7 | EEG mean 500-1000ms ∼ Predictability * ROI * PPVT + (1 | ROI) + (1 | Participant) + Attention:Predictability:ROI:PPVT | 57 | 16496 | 16862 | -8191 | 16382 | 85.6 | 18 | <.001 |
|
| |||||||||
| SC | |||||||||
|
| |||||||||
| m8 | EEG mean 500-1000ms ∼ Predictability * ROI * SC + (1 | ROI) + (1 | Participant) | 39 | 16591 | 16842 | -8257 | 16513 | |||
Table 2.
| Baseline Model m1 | Baseline Model m2 | Baseline Model m3 | |||||||||
|---|---|---|---|---|---|---|---|---|---|---|---|
| Fixed Effects | Estimate | SE | p | Fixed Effects | Estimate | SE | p | Fixed Effects | Estimate | SE | p |
| Intercept | 377.59 | 14.90 | 0.000 | Intercept | 377.59 | 15.34 | 0.000 | Intercept | 377.59 | 15.98 | 0.000 |
| LP | 45.88 | 16.18 | 0.013 | LP | 45.88 | 16.82 | 0.016 | LP | 45.88 | 17.57 | 0.020 |
| GJ | -4.37 | 1.93 | 0.033 | PPVT | -3.86 | 2.18 | 0.088 | SC | -0.85 | 5.21 | 0.871 |
| LP:GJ | 3.90 | 2.10 | 0.083 | LP:PPVT | 3.45 | 2.39 | 0.169 | LP:SC | 4.63 | 5.73 | 0.432 |
| Random Effects | SD | SD | SD | ||||||||
|
| |||||||||||
| Participant | 39.35 | 39.94 | 41.46 | ||||||||
| Residual | 47.16 | 49.02 | 51.22 | ||||||||
Given the marginal significance of the interactions between Predictability and GJ raw score (p = .083), we tested the correlations between the SL RT effect (RT in the LP condition minus RT in the HP condition) and the GJ raw score, which revealed a positive relationship between the GJ raw score and the SL RT effect [rs = .522, p = .031; N = 17; two-tailed] (see Figure 1.C). The Figure 1.D additionally shows the regression lines for each Predictability condition separately, indicating that RTs to the HP condition were faster as the GJ score increase.
In sum, the behavioral results indicate that with exposure, participants were able (at least in the HP condition) to extract the statistical structure embedded within the sequences as reflected by quicker responses to the target when following a HP predictor than when following a LP predictor. This behavioral measure of SL appeared to be related to the GJ raw score with larger SL RT effect associated with higher performance on this language measure.
3.3 SL Task: Event-Related Potentials
Figure 2 displays the grand averaged ERPs across all participants time-locked to the two predictors (HP and LP) at the nine regions of interest used for topographic analyses. Visual inspection suggests a larger centro-parietal late positivity between approximately 500ms and 1000ms for the HP predictor compared to the LP predictor, replicating the general effect observed by Jost et al. (2015).
The applied LMMs for the analysis of the ERPs are described in Table 1, Table 3, Table 4, and Table 5 (See Supplementary Material). The LMM on the mean amplitude ERPs time-locked to the predictors between 500ms and 1000ms (time-window based on the grand average, Figure 2) revealed a main effect of Predictability [F(1,4522.0) = 51.16; p < .001] indicating SL had occurred according to our neurophysiological operational definition. To test the correlation between our behavioral and our neurophysiological operational definition of SL, we computed the mean SL ERP effect (i.e. the mean amplitude of the ERP in the HP condition minus the mean amplitude of the ERP in the LP condition) over the centro-parietal (POz) ROI between 500ms and 1000ms. The trend for a positive correlation between SL RT effect (RT in the LP condition minus RT in the HP condition) and SL ERP effect did not reach significance with the Spearman test [rs = .306, p = .232; N=17; two-tailed] (Figure 1.E).
Table 3.
| Baseline Model m4 | Full Model m5 | ||||
|---|---|---|---|---|---|
| Fixed Effects | Estimate | SE | Estimate | SE | p |
| Intercept | -0.5827 | 2.2940 | -0.5725 | 4.4780 | 0.958 |
| LP | -0.0097 | 0.1235 | -0.0133 | 0.1260 | 0.937 |
| LCn | 0.9703 | 3.2380 | 0.9556 | 6.3300 | 0.953 |
| LPo | 1.7650 | 3.2380 | 1.8580 | 6.3300 | 0.932 |
| FRz | -0.6438 | 3.2380 | -0.6426 | 6.3300 | 0.965 |
| CNz | 0.3361 | 3.2380 | 0.3045 | 6.3300 | 0.980 |
| POz | 1.6180 | 3.2380 | 1.6650 | 6.3300 | 0.935 |
| RAn | 0.0866 | 3.2380 | 0.0739 | 6.3300 | 0.995 |
| RCn | 0.7352 | 3.2380 | 0.7793 | 6.3300 | 0.961 |
| RPo | 1.5910 | 3.2380 | 1.7660 | 6.3300 | 0.935 |
| GJ | -0.0037 | 0.0213 | -0.0060 | 0.0236 | 0.862 |
| LP:LCn | -0.5542 | 0.1746 | -0.5357 | 0.1783 | 0.002 |
| LP:LPo | -0.9620 | 0.1746 | -1.0370 | 0.1783 | 0.000 |
| LP:FRz | 0.5987 | 0.1746 | 0.5887 | 0.1783 | 0.001 |
| LP:CNz | -0.0273 | 0.1746 | -0.0344 | 0.1783 | 0.876 |
| LP:POz | -0.7717 | 0.1746 | -0.8167 | 0.1783 | 0.000 |
| LP:RAn | 0.1346 | 0.1746 | 0.0871 | 0.1783 | 0.441 |
| LP:RCn | -0.1803 | 0.1746 | -0.2395 | 0.1783 | 0.302 |
| LP:RPo | -0.4394 | 0.1746 | -0.5978 | 0.1783 | 0.012 |
| LP:GJ | -0.0665 | 0.0156 | -0.0657 | 0.0169 | 0.000 |
| LCn:GJ | 0.0552 | 0.0156 | 0.0585 | 0.0169 | 0.000 |
| LPo:GJ | 0.1294 | 0.0156 | 0.1086 | 0.0169 | 0.000 |
| FRz:GJ | -0.0060 | 0.0156 | -0.0063 | 0.0169 | 0.701 |
| CNz:GJ | 0.0772 | 0.0156 | 0.0843 | 0.0169 | 0.000 |
| POz:GJ | 0.1167 | 0.0156 | 0.1061 | 0.0169 | 0.000 |
| RAn:GJ | 0.0298 | 0.0156 | 0.0326 | 0.0169 | 0.057 |
| RCn:GJ | 0.0793 | 0.0156 | 0.0693 | 0.0169 | 0.000 |
| RPo:GJ | 0.1150 | 0.0156 | 0.0755 | 0.0169 | 0.000 |
| LP:LCn:GJ | -0.0174 | 0.0221 | -0.0216 | 0.0239 | 0.431 |
| LP:LPo:GJ | -0.0610 | 0.0221 | -0.0441 | 0.0239 | 0.006 |
| LP:FRz:GJ | 0.0393 | 0.0221 | 0.0416 | 0.0239 | 0.075 |
| LP:CNz:GJ | 0.0027 | 0.0221 | 0.0043 | 0.0239 | 0.904 |
| LP:POz:GJ | -0.0205 | 0.0221 | -0.0104 | 0.0239 | 0.353 |
| LP:RAn:GJ | 0.0066 | 0.0221 | 0.0173 | 0.0239 | 0.765 |
| LP:RCn:GJ | -0.0254 | 0.0221 | -0.0120 | 0.0239 | 0.250 |
| LP:RPo:GJ | -0.0489 | 0.0221 | -0.0132 | 0.0239 | 0.027 |
| Attention:HP:LAn:GJ | — | — | -0.0001 | 0.0002 | 0.813 |
| Attention:LP:LAn:GJ | — | — | 0.0000 | 0.0002 | 0.878 |
| Attention:HP:LCn:GJ | — | — | 0.0000 | 0.0002 | 0.917 |
| Attention:LP:LCn:GJ | — | — | -0.0001 | 0.0002 | 0.808 |
| Attention:HP:LPo:GJ | — | — | -0.0005 | 0.0002 | 0.024 |
| Attention:LP:LPo:GJ | — | — | -0.0001 | 0.0002 | 0.571 |
| Attention:HP:FRz:GJ | — | — | -0.0001 | 0.0002 | 0.792 |
| Attention:LP:FRz:GJ | — | — | 0.0000 | 0.0002 | 0.960 |
| Attention:HP:CNz:GJ | — | — | 0.0001 | 0.0002 | 0.620 |
| Attention:LP:CNz:GJ | — | — | 0.0002 | 0.0002 | 0.459 |
| Attention:HP:POz:GJ | — | — | -0.0003 | 0.0002 | 0.193 |
| Attention:LP:POz:GJ | — | — | 0.0000 | 0.0002 | 0.845 |
| Attention:HP:RAn:GJ | — | — | 0.0000 | 0.0002 | 0.954 |
| Attention:LP:RAn:GJ | — | — | 0.0003 | 0.0002 | 0.221 |
| Attention:HP:RCn:GJ | — | — | -0.0003 | 0.0002 | 0.215 |
| Attention:LP:RCn:GJ | — | — | 0.0000 | 0.0002 | 0.842 |
| Attention:HP:RPo:GJ | — | — | -0.0010 | 0.0002 | 0.000 |
| Attention:LP:RPo:GJ | — | — | -0.0001 | 0.0002 | 0.584 |
|
| |||||
| Random Effects | SD | SD | |||
|
| |||||
| Participant | 0.5926 | 0.6071 | |||
| ROI | 2.2881 | 4.475 | |||
| Residual | 1.3945 | 1.3809 | |||
Table 4.
| Baseline Model m6 | Full Model m7 | ||||
|---|---|---|---|---|---|
| Fixed Effects | Estimate | SE | Estimate | SE | p |
| Intercept | -0.5827 | 1.7780 | -0.5426 | 2.3220 | 0.980 |
| LP | -0.0097 | 0.1284 | -0.0818 | 0.1291 | 0.530 |
| LCn | 0.9703 | 2.5060 | 0.9166 | 3.2770 | 0.980 |
| LPo | 1.7650 | 2.5060 | 1.7280 | 3.2770 | 0.970 |
| FRz | -0.6438 | 2.5060 | -0.6045 | 3.2770 | 0.980 |
| CNz | 0.3361 | 2.5060 | 0.3312 | 3.2770 | 0.990 |
| POz | 1.6180 | 2.5060 | 1.5680 | 3.2770 | 0.970 |
| RAn | 0.0866 | 2.5060 | 0.1161 | 3.2770 | 1.000 |
| RCn | 0.7352 | 2.5060 | 0.7468 | 3.2770 | 0.980 |
| RPo | 1.5910 | 2.5060 | 1.6020 | 3.2770 | 0.970 |
| PPVT | 0.0022 | 0.0246 | -0.0053 | 0.0253 | 0.840 |
| LP:LCn | -0.5542 | 0.1816 | -0.4820 | 0.1826 | 0.010 |
| LP:LPo | -0.9620 | 0.1816 | -0.9216 | 0.1826 | 0.000 |
| LP:FRz | 0.5987 | 0.1816 | 0.5997 | 0.1826 | 0.000 |
| LP:CNz | -0.0273 | 0.1816 | 0.0299 | 0.1826 | 0.870 |
| LP:POz | -0.7717 | 0.1816 | -0.6738 | 0.1826 | 0.000 |
| LP:RAn | 0.1346 | 0.1816 | 0.1336 | 0.1826 | 0.460 |
| LP:RCn | -0.1803 | 0.1816 | -0.1230 | 0.1826 | 0.500 |
| LP:RPo | -0.4394 | 0.1816 | -0.3927 | 0.1826 | 0.030 |
| LP:PPVT | -0.0148 | 0.0183 | -0.0014 | 0.0185 | 0.940 |
| LCn:PPVT | 0.0569 | 0.0183 | 0.0669 | 0.0185 | 0.000 |
| LPo:PPVT | 0.0848 | 0.0183 | 0.0917 | 0.0185 | 0.000 |
| FRz:PPVT | -0.0067 | 0.0183 | -0.0141 | 0.0185 | 0.450 |
| CNz:PPVT | 0.0379 | 0.0183 | 0.0388 | 0.0185 | 0.040 |
| POz:PPVT | 0.0572 | 0.0183 | 0.0665 | 0.0185 | 0.000 |
| RAn:PPVT | -0.0266 | 0.0183 | -0.0321 | 0.0185 | 0.080 |
| RCn:PPVT | -0.0072 | 0.0183 | -0.0094 | 0.0185 | 0.610 |
| RPo:PPVT | 0.0159 | 0.0183 | 0.0139 | 0.0185 | 0.450 |
| LP:LCn:PPVT | -0.0314 | 0.0258 | -0.0449 | 0.0262 | 0.090 |
| LP:LPo:PPVT | -0.0450 | 0.0258 | -0.0525 | 0.0262 | 0.050 |
| LP:FRz:PPVT | 0.0224 | 0.0258 | 0.0223 | 0.0262 | 0.400 |
| LP:CNz:PPVT | -0.0015 | 0.0258 | -0.0122 | 0.0262 | 0.640 |
| LP:POz:PPVT | -0.0126 | 0.0258 | -0.0309 | 0.0262 | 0.240 |
| LP:RAn:PPVT | 0.0444 | 0.0258 | 0.0446 | 0.0262 | 0.090 |
| LP:RCn:PPVT | 0.0306 | 0.0258 | 0.0199 | 0.0262 | 0.450 |
| LP:RPo:PPVT | -0.0065 | 0.0258 | -0.0152 | 0.0262 | 0.560 |
| Attention:HP:LAn:PPVT | — | — | -0.0008 | 0.0005 | 0.170 |
| Attention:LP:LAn:PPVT | — | — | 0.0006 | 0.0005 | 0.270 |
| Attention:HP:LCn:PPVT | — | — | 0.0003 | 0.0005 | 0.630 |
| Attention:LP:LCn:PPVT | — | — | 0.0003 | 0.0005 | 0.640 |
| Attention:HP:LPo:PPVT | — | — | -0.0001 | 0.0005 | 0.920 |
| Attention:LP:LPo:PPVT | — | — | 0.0006 | 0.0005 | 0.320 |
| Attention:HP:FRz:PPVT | — | — | -0.0015 | 0.0005 | 0.010 |
| Attention:LP:FRz:PPVT | — | — | -0.0002 | 0.0005 | 0.770 |
| Attention:HP:CNz:PPVT | — | — | -0.0007 | 0.0005 | 0.220 |
| Attention:LP:CNz:PPVT | — | — | -0.0004 | 0.0005 | 0.480 |
| Attention:HP:POz:PPVT | — | — | 0.0002 | 0.0005 | 0.730 |
| Attention:LP:POz:PPVT | — | — | -0.0003 | 0.0005 | 0.580 |
| Attention:HP:RAn:PPVT | — | — | -0.0013 | 0.0005 | 0.020 |
| Attention:LP:RAn:PPVT | — | — | 0.0001 | 0.0005 | 0.900 |
| Attention:HP:RCn:PPVT | — | — | -0.0010 | 0.0005 | 0.080 |
| Attention:LP:RCn:PPVT | — | — | -0.0007 | 0.0005 | 0.200 |
| Attention:HP:RPo:PPVT | — | — | -0.0010 | 0.0005 | 0.080 |
| Attention:LP:RPo:PPVT | — | — | -0.0005 | 0.0005 | 0.370 |
|
| |||||
| Random Effects | SD | SD | |||
|
| |||||
| Participant | 0.6059 | 0.6147 | |||
| ROI | 1.7694 | 2.3154 | |||
| Residual | -0.0005 | 1.4394 | |||
Table 5.
| Baseline Model m8 | |||
|---|---|---|---|
| Fixed Effects | Estimate | SE | p |
| Intercept | -0.5827 | 1.0120 | 0.992 |
| LP | -0.0097 | 0.1291 | 0.940 |
| LCn | 0.9703 | 1.4150 | 0.992 |
| LPo | 1.7650 | 1.4150 | 0.990 |
| FRz | -0.6438 | 1.4150 | 0.993 |
| CNz | 0.3361 | 1.4150 | 0.994 |
| POz | 1.6180 | 1.4150 | 0.991 |
| RAn | 0.0866 | 1.4150 | 0.997 |
| RCn | 0.7352 | 1.4150 | 0.993 |
| RPo | 1.5910 | 1.4150 | 0.991 |
| SC | 0.0322 | 0.0572 | 0.579 |
| LP:LCn | -0.5542 | 0.1825 | 0.002 |
| LP:LPo | -0.9620 | 0.1825 | 0.000 |
| LP:FRz | 0.5987 | 0.1825 | 0.001 |
| LP:CNz | -0.0273 | 0.1825 | 0.881 |
| LP:POz | -0.7717 | 0.1825 | 0.000 |
| LP:RAn | 0.1346 | 0.1825 | 0.461 |
| LP:RCn | -0.1803 | 0.1825 | 0.323 |
| LP:RPo | -0.4394 | 0.1825 | 0.016 |
| LP:SC | 0.0069 | 0.0420 | 0.870 |
| LCn:SC | 0.0279 | 0.0420 | 0.506 |
| LPo:SC | 0.0225 | 0.0420 | 0.593 |
| FRz:SC | -0.0342 | 0.0420 | 0.416 |
| CNz:SC | -0.1008 | 0.0420 | 0.016 |
| POz:SC | -0.0709 | 0.0420 | 0.091 |
| RAn:SC | -0.0920 | 0.0420 | 0.029 |
| RCn:SC | -0.0973 | 0.0420 | 0.021 |
| RPo:SC | -0.0902 | 0.0420 | 0.032 |
| LP:LCn:SC | -0.0248 | 0.0594 | 0.677 |
| LP:LPo:SC | -0.0686 | 0.0594 | 0.248 |
| LP:FRz:SC | -0.0301 | 0.0594 | 0.612 |
| LP:CNz:SC | 0.0093 | 0.0594 | 0.876 |
| LP:POz:SC | 0.0273 | 0.0594 | 0.646 |
| LP:RAn:SC | 0.0122 | 0.0594 | 0.837 |
| LP:RCn:SC | -0.0008 | 0.0594 | 0.990 |
| LP:RPo:SC | 0.0222 | 0.0594 | 0.709 |
| Random Effects | SD | ||
|
| |||
| Participant | 0.6191 | ||
| ROI | 0.9967 | ||
| Residual | 1.4573 | ||
We also found an interaction between Predictability, GJ raw score, and ROI [F(8,4522.0) = 2.06; p = .036] together with an interaction between Predictability, GJ raw score, ROI, and general level of selective attention (Flanker effect centered) [F(18,208.7) = 5.94; p < .001] as depicted on Figure 3 and Figure 4. These interactions remained significant after McCarthy and Wood (1985) correction [F(8,4522.0) = 3.56; p < .001 and F(18,208.7) = 3.21; p < .001; respectively]. Figure 3 and Figure 4 indicate that the relationship between the centro-parietal SL ERP effects and GJ raw score was similar between high and low attention. Specifically, the figures reveal that in the centro-parietal ROI (POz), higher amplitudes for the HP condition (but not the LP condition) are associated with higher language (GJ) scores, and this was true for high and low general selective attention. As indicated in Figure 3 and Figure 4, the interaction with the general level of selective attention stems mostly from ERP effects at frontal and central ROIs (i.e. LAn, FRz, RAn, LCn, and CNz) with larger (absolute) ERP effects (across GJ scores) under high compared to low attention while the ERP effects at POz, (our operational definition of SL ERP effect, see Introduction) remains similar between high and low attention.
Figure 3. Predictability Condition × GJ raw score interaction for each ROI under low attention.
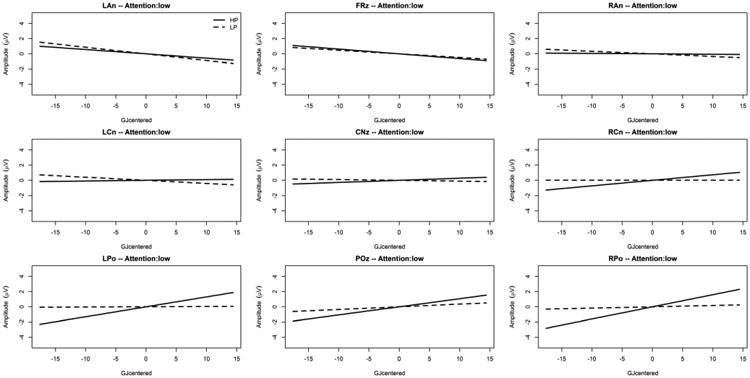
The x-axis is the mean-centered GJ raw score, and the y-axis is the LMM estimated ERP mean amplitude between 500ms and 1000ms post predictor onset (positivity upward in microvolts). The solid gray line is the simple effect of the mean-centered GJ raw score in the “High Predictability” condition (HP, predictor followed in 90% of the trials by the target), and the broken gray line is the simple effect of the mean-centered GJ raw score in the “Low Predictability” condition (LP, predictor followed in 20% of the trials by the target).
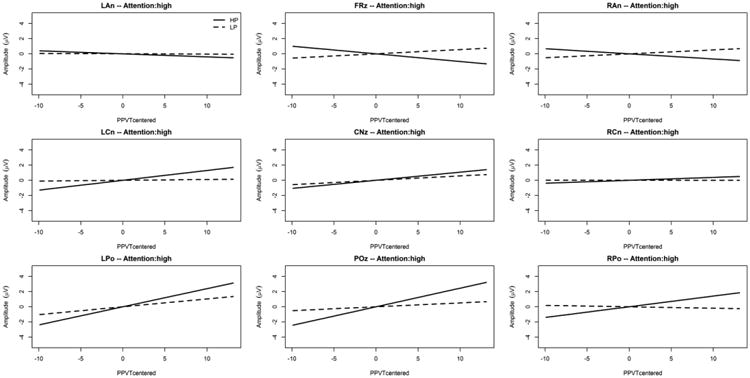
Figure 4. Predictability Condition × GJ raw score interaction for each ROI under high attention.
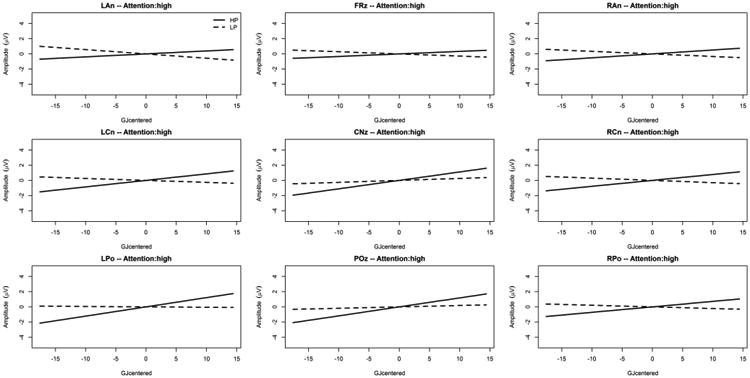
The x-axis is the mean-centered GJ raw score, and the y-axis is the LMM estimated ERP mean amplitude between 500ms and 1000ms post predictor onset (positivity upward in microvolts). The solid gray line is the simple effect of the mean-centered GJ raw score in the “High Predictability” condition (HP, predictor followed in 90% of the trials by the target), and the broken gray line is the simple effect of the mean-centered GJ raw score in the “Low Predictability” condition (LP, predictor followed in 20% of the trials by the target).
In addition, an interaction was found between Predictability, PPVT-IV raw score centered, and ROI [F(8,4522.0) = 3.08; p = .002] together with an interaction between Predictability, PPVT-IV raw score, ROI, and general level of selective attention (Flanker effect centered) [F(18,208.7) = 4.74; p < .001] as depicted on Figure 5 and Figure 6. These interactions remained significant after McCarthy and Wood (1985) correction [F(8,4522.0) = 3.97; p < .001 and F(18,208.7) = 3.74; p < .001; respectively]. Figure 5 and Figure 6 indicate that the relationship between SL ERP effects and PPVT-IV raw score differed between high and low attention. Specifically, the figures reveal that in the centro-parietal (POz) ROI, higher amplitudes for the HP condition (but not the LP condition) are associated with higher language (PPVT-IV) scores, but this was true only for high general selective attention. As indicated in Figure 5 and Figure 6, the interaction with the general level of selective attention stems not only from the ERP effects at POz, (our operational definition of SL ERP effect, see Introduction) but also from ERP effects at other cortical sites (i.e. frontal and central ROIs) with large (absolute) ERP effects (across PPVT-IV scores) under high compared to low attention.
Figure 5. Predictability Condition × PPVT-IV raw score interaction for each ROI under low attention.
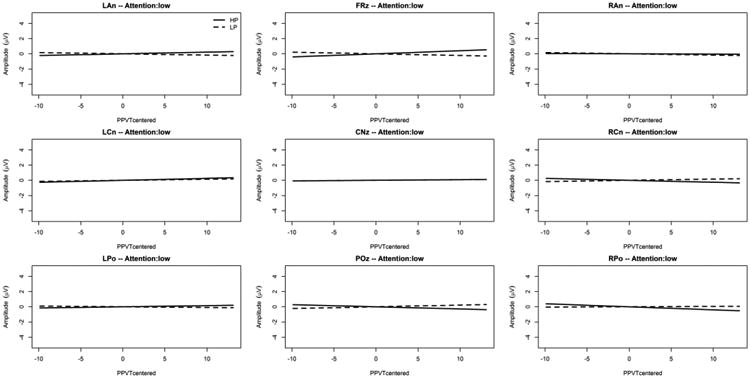
The x-axis is the mean-centered PPVT-IV raw score, and the y-axis is the LMM estimated ERP mean amplitude between 500ms and 1000ms post predictor onset (positivity upward in microvolts). The solid gray line is the simple effect of the mean-centered PPVT-IV raw score in the “High Predictability” condition (HP, predictor followed in 90% of the trials by the target), and the broken gray line is the simple effect of the mean-centered PPVT-IV raw score in the “Low Predictability” condition (LP, predictor followed in 20% of the trials by the target).
Figure 6. Predictability Condition × PPVT-IV raw score interaction for each ROI under high attention.
The x-axis is the mean-centered PPVT-IV raw score, and the y-axis is the LMM estimated ERP mean amplitude between 500ms and 1000ms post predictor onset (positivity upward in microvolts). The solid gray line is the simple effect of the mean-centered PPVT-IV raw score in the “High Predictability” condition (HP, predictor followed in 90% of the trials by the target), and the broken gray line is the simple effect of the mean-centered PPVT-IV raw score in the “Low Predictability” condition (LP, predictor followed in 20% of the trials by the target).
Finally, Predictability and SC raw score centered [F(8,4522.0) = 0.021; p = .884] and Predictability, SC raw score centered, and ROI did not interact significantly [F(8,4522.0) = 0.655; p = .732]. All the above-mentioned LMM are compared in Table1 (See Supplementary Material).
In sum, these neurophysiological results indicate that participants were able to extract the statistical structure embedded within the sequences. Importantly, the centro-parietal SL ERP effects appeared to be related to the GJ raw score independently of the general level of selective attention, with larger ERP effects being associated with higher performance on this measure of grammatical ability. On the other hand, larger centro-parietal SL ERP effects were associated with higher performance on receptive vocabulary according to the PPVT-IV raw score but only for participants who scored high on general selective attention according to the Flanker task. Finally, no ERP effects were associated with the measure of sentence completion (SC).
4. Discussion
The aim of this study was to investigate whether visual SL is related to language ability. Visual SL was assessed with a predictor-target task that contained statistical contingencies (modeled after Jost et al., 2015). Language ability was assessed with three tasks that explored receptive vocabulary (the PPVT-IV; Dunn & Dunn, 2007), grammatical ability (the GJ subtest of the CASL; Carrow-Woolfolk, 1999), receptive vocabulary (the PPVT-IV), and sentence completion (the SC subtest of the CASL; Carrow-Woolfolk, 1999). Consistent with our prediction, the results indicated—both at a behavioral and neurophysiological level—that visual SL is related to language performance. Importantly, late centro-parietal ERPs indicated: (1) a relationship between SL and grammatical ability in both low and high general selective attention groups, and (2) a relationship between SL and receptive vocabulary only in the high general selective attention group. Next, we discuss these findings in more detail and consider the implications of this dissociation in terms of the underlying memory systems and mechanisms (e.g., procedural vs. declarative and implicit vs. explicit) that are involved in language processing.
4.1 Behavioral and neurophysiological correlates of statistical learning
The behavioral data demonstrated that SL occurred as indicated by a SL RT effect: faster RTs to the target when it was highly predictable by the preceding stimulus (i.e. when the target followed the predictor with a 90% probability in the “HP condition”) compared to RTs to the target when it was less predictable by the preceding stimulus (i.e. when the target followed the predictor with a 20% probability in the “LP condition”). The size of this SL RT effect was 45ms, which is in the typical range of RT effects previously reported in the SL literature (e.g. Baldwin & Kutas, 1997; Eimer, Goschke, Schlaghecken, & Stürmer, 1996; Ferdinand, Mecklinger, & Kray, 2008).
SL was further confirmed with the ERP findings. Visual inspection of grand averages (Figure 2) in the present study suggests a larger centro-parietal positivity between 500ms and 1000ms in response to the HP compared to the LP predictor. This SL ERP effect showed a trend for a positive correlation with the SL RT effect (Figure 1.E) in line with the assumption that the late centro-parietal ERP effect between HP and LP conditions reflects an index of SL. Furthermore, the SL ERP effect observed in the present study closely replicates the findings of Jost et al. (2015), who found a larger centro-parietal positivity in a similar time-window in response to the HP predictor (followed in 90% of the trials by the target, as in our paradigm) compared to the LP predictor (followed in 20% of the trials by the target, also like in our paradigm). Given the similar design to the study of Jost et al. (2015) this replication was expected. Jost et al. (2015) interpreted the occurrence of the P300 to the HP predictor stimuli as an indication that participants formed an association or mental “chunk” between the HP predictor and the target. This interpretation is consistent with previous suggestions that this ERP component reflects chunking processes (Verleger, 1988) and that chunking processes are an important aspect of implicit learning and SL (Perruchet & Pacton, 2006). Perruchet and Pacton proposed that through tracking statistical contingencies, participants form chunks between highly associated stimuli. In the present study, this means that participants essentially treat the HP predictor at some level to be equivalent to the target itself. This interpretation converges with one view of the P300 wherein this component reflects target detection and evaluation processes during sequence processing (Van Zuijen, Simoens, Paavilainen, Näätänen, & Tervaniemi, 2006). An alternative explanation is that the positive ERP component elicited in the present study could be a P600, a component known to be elicited by syntactic violations from grammars of natural languages (Hagoort et al., 1993) and from artificial grammars (Christiansen et al., 2012). However, the P600 component is typically elicited for violations of syntactic or grammatical structure. Since the current task did not manipulate syntactic violation per se, the observed component here may differ from a typical P600. The possible link between SL and natural language ability is explored further in section 4.2.
4.2 Relations between statistical learning and language ability
Results from the LMM and correlational analyses revealed that the SL RT effect was related to our measure of grammatical ability (i.e. the GJ raw score). While the LMM analysis suggested a relationship with our measure of receptive vocabulary (i.e., the PPVT-IV raw score), correlational analyses were not able to confirm this result. At a neurophysiological level, our ERP measure of SL—the centro-parietal SL ERP effect, which may be interpreted as a P300 (or possibly a P600 effect, see discussion above)—was related to grammatical ability as evidenced by an interaction between predictor type (HP versus LP), GJ raw score, and ROI between 500ms and 1000ms (with a larger centro-parietal positive amplitude in response to the HP predictor compared to the LP predictor for participants with higher GJ raw score). That is, greater visual SL was related to a higher GJ raw score. This relationship was found to be similar (at the centro-parietal cortical area, the cortical site used to define our operational definition of SL ERP effect) in both the high and low general selective attention groups. In addition, a similar interaction was found with another language measure assessing receptive vocabulary (i.e. the PPVT-IV raw score). However, this later interaction was observed only in the high general selective attention group.
From an information processing point of view, the link between SL and grammatical ability is likely due to SL mechanisms that are used to encode structural and grammatical regularities in spoken language (Christiansen et al., 2012). These results are consistent with previous research demonstrating links between SL and grammatical ability (Christiansen et al., 2012; Conway et al., 2011; Kidd, 2012). One contribution of the current study is that the association between visual SL (according to our ERP operational definition of SL) and grammatical ability of the natural language did not appear to depend on the participants' general level of selective attention (as measured by a Flanker task). Thus, this result suggests that visual SL (the ability to encode statistical regularities and to use this information to predict upcoming units in the visual modality) and grammatical ability of the natural language share implicit mechanisms (i.e. mechanisms that do not require attention to be activated, Shiffrin and Schneider, 1977) and might depend more upon procedural and sequential memory. The same cannot be said of the relationship between visual SL and receptive vocabulary. Indeed, the centro-parietal SL ERP effect interaction with the PPVT-IV raw score varied dramatically with attention, being present only in the high general selective attention group. Possibly, SL and the processing of vocabulary would share explicit mechanisms (i.e. mechanisms that do require attention to be activated; Shiffrin and Schneider, 1977) and relies more on declarative memory. In fact, the dissociation between the SL—grammatical ability and the SL—receptive vocabulary relationships is in line with the Ullman's dual-system model of language (Ullman, 2004), which posits exclusive associations between procedural/sequential memory (a type of implicit or automatic learning) and grammatical processing on one end and declarative memory (a type of explicit memory) and semantic/vocabulary processing on the other end.
The third measure of language, which assessed an individual's ability to retrieve and express one of the few appropriate words that would accurately complete a spoken sentence (the SC raw score) did not interact with SL. Indeed, this measure depends not only on a correct syntactic analysis of the to-be-completed sentences and on single-word vocabulary processing (which may explain the low–though non-significant–correlation between the PPVT-IV and the SC score) of each words of a sentence, but also on other mechanisms required to: 1) analyze the semantic content at the sentential level, and 2) retrieve an appropriate word to complete the sentence. These other mechanisms likely rely on explicit cognitive control processes and require a higher level of attention (e.g., Daltrozzo, Wioland, & Kotchoubey, 2012; January, Trueswell, & Tompson-Schill, 2009). Because of the likely involvement of these more attention-demanding—mechanisms, it is possible that the SC task is less sensitive to variations in SL ability but more sensitive to variations in aspects of cognitive control or executive function (January et al., 2009). Alternatively or as a complementary explanation, the lack of interaction between SL and SC while interactions were found between SL and PPVT-IV and GJ could stem from differences of reliability between these language measures (higher than .849 and .905 for the PPVT-IV and GJ scores, respectively, but only higher than .696 for the SC score).
The above-mentioned difference in results between our three measures of language is also consistent with our correlational results, which showed that these language measures were essentially unrelated to each other in our sample of adults (with a very low correlation coefficient between the GJ score and the two other language scores and a low correlation between the PPVT-IV and the SC score). This lack of correlation further supports the idea that these three measures are not assessing the performance of a general language ability, but instead measure separate, somewhat independent skills.
The above-mentioned difference in results between our three measures of language is also consistent with our correlational results, which showed that these language measures were essentially unrelated to each other in our sample of adults. This lack of correlation further supports the idea that these three measures are not measuring the performance of a general language ability, but instead separate, somewhat independent skills.
Importantly, not only was the link between SL and grammatical ability not due to individual variations in general selective attention, but the link between SL and language performance overall also did not appear to be simply due to individual variations in perceptual processing. Indeed, visual processing performance was controlled for in our task because our measures of SL were not absolute measures but relative measures. Our tests of interactions with language performance were with the two levels of the Predictor condition (i.e. HP and LP). That is, we tested how the RT effect (RT differences between HP and LP conditions) and ERP effects (ERP differences between HP and LP conditions) varied with language performance. Therefore, assuming that visual processing performance was similar between the HP and the LP conditions, none of the reported interactions or correlation between language skills and the SL RT effect or SL ERP effect could be explained by a variation of visual processing performance across participants.
While general selective attention and perceptual processing can hardly explain the reported relationships between SL and language abilities, the fact that our measures of SL were not absolute measures but relative measures (between our HP and LP experimental conditions) cannot fully rule out that other cognitive abilities (e.g., intelligence or working memory) may underlie these relationships (Misyak & Christiansen, 2012). Although several studies indicate that SL is weakly correlated with these other cognitive abilities (e.g. McGeorge, Crawford, & Kelly, 1997; Reber, Walkenfeld, & Hernstadt, 1991), further studies will be required to fully address these issues.
Our discussion of ERP effects reported in this study focused mostly on those observed at the centro-parietal cortical site because our ERP operational definition of SL was at this scalp location (see Introduction), however ERP effects between HP and LP found also at other locations including the frontal area could have driven our reported interaction between the SL ERP effect, GJ, and attention. With a very similar paradigm, Jost et al. (2015) reported also large frontal ERP effects between various target predictability conditions. There are several possible (competing or complementary) interpretations for the source(s) of these frontal ERP effects, e.g. the modulations of a Contingent Negative Variation (Walter, Cooper, Aldridge, Mccallum, & Winter, 1964) or a Slow Negative Wave (Lang & Kotchoubey, 2000) or the opposite scalp projection of a dipole source (oriented along the frontal to centro-parietal direction) of the SL ERP effect. These issues are discussed more extensively in Daltrozzo and Conway (2014).
While there is a clear positive trend between the SL (RT effect) and a language (GJ raw score) behavioral measure (Figure 1.C), the linear correlation is not highly significant p = .03. Indeed, the sample size of N = 17 limits the statistical power of the analysis. This issue limits also the statistical power of the tested interactions between the SL and the language behavioral measures. However, even under these conditions of statistical power, we were still able to find a marginally significant interaction between these behavioral measures.
4.3 General Discussion
The fact that the observed relationship between SL and language ability was with a visual non-linguistic SL task suggests that, at least to some extent, the processes involved in SL are domain-general (Kirkham et al., 2002). This stands in contrast to other research findings suggesting that SL may be mediated by a distributed set of modality-specific mechanisms, each tied to a particular type of input (Conway & Christiansen, 2005; Frost, Armstrong, Siegelman, & Christiansen, 2015). Conway and Pisoni (2008) suggested that there may be a combination of modality-specific and domain-general processes involved in SL, each relying on different neural substrates, which could help account for both the presence of stimulus-specificity in SL tasks but also findings revealing associations between non-linguistic SL and language measures (Shafto, Conway, Field, & Houston, 2012). Future research is needed to disentangle the role of domain-generality and domain-specificity in SL and how each is used in the service of language processing.
It is important to note that, despite using advanced analyses, the present approach cannot determine directional causation, as we relied notably upon interactions between pre-existing language ability and SL effects rather than using an experimental manipulation to modify SL or language ability. Therefore, even though our results provide evidence of a link between SL and language ability, and even though evidence of this link extends beyond our study, being strengthened by previous behavioral (Conway et al. 2010) and neurophysiological studies (Christiansen et al. 2012; Tabullo et al. 2013), the correlational nature of this approach does not allow us to make a causal conclusion about the relationship between SL and language performance. As most of the previous SL research has emphasized, it seems likely that the association between SL and language is due to SL playing a causal role in the acquisition and processing of language. On the other hand, it is at least possible that the causal direction goes in the opposite direction, with better language abilities somehow causing better learning in SL tasks. Future research could fruitfully attempt to disentangle the causal nature of this relationship. This may be achieved for instance through training studies that attempt to increase SL ability and then test if language performance improves via cognitive transfer (Conway, Gremp, Walk, Bauernschmidt, & Pisoni, 2012; Smith, Conway, Bauernschmidt, & Pisoni, 2015).
Finally, as per Newman et al. (2012), we modeled ROIs with an unstructured random effect (see Supplementary Materials and Methods). Thus theoretically, our model allowed ROIs to freely correlate. However, it is in principle possible to model the spatial correlation within and across ROIs. However, this approach could in practice be problematic because it corresponds to more complex models, requiring more parameters to estimate, hence a higher risk of lack of estimation convergence.
In sum, the current findings suggest that language ability is based in part on neural mechanisms that are devoted to learning statistical contingencies in the environment, whether the input is linguistic or not. ERPs indicated that the relationship between SL and grammatical ability was independent of attention, while the association between SL and receptive vocabulary depended on attention. The relationships between SL mechanisms and these two language abilities in turn do not appear to be mediated by differences in perceptual processing. These results contribute to the debate about the nature of language, suggesting that it is both experience-dependent and based on domain-general pattern learning mechanisms. This finding in turn provides the theoretical basis for future exploration of the efficacy of cognitive training approaches to enhance SL and language, which could be a boon for individuals with a learning or communication disorder, such as dyslexia, specific language impairment, autism, or other language delays.
Supplementary Material
Acknowledgments
This research was funded by the National Institute of Health (grant R01DC012037 to CMC) and the Georgia State University's Language and Literacy Initiative. We are grateful to A. Tremblay, A.J. Newman, S. Sims, J. Trapani, A. Ghali, G. Signiski, Lauterbach A., and Raley P. for their help with data acquisition and analysis.
Footnotes
Spearman's correlation rs was used throughout the manuscript because this correlation coefficient is less sensitive to outliers than Pearson's and thus more appropriate for small sample sizes.
Publisher's Disclaimer: This is a PDF file of an unedited manuscript that has been accepted for publication. As a service to our customers we are providing this early version of the manuscript. The manuscript will undergo copyediting, typesetting, and review of the resulting proof before it is published in its final citable form. Please note that during the production process errors may be discovered which could affect the content, and all legal disclaimers that apply to the journal pertain.
References
- Arciuli J, Simpson IC. Statistical learning is related to reading ability in children and adults. Cognitive Science. 2012;36:286–304. doi: 10.1111/j.1551-6709.2011.01200.x. [DOI] [PubMed] [Google Scholar]
- Arciuli J, Torkildsen JVK. Advancing our understanding of the link between statistical learning and language acquisition: The need for longitudinal data. Frontiers in Psychology. 2012;3:324. doi: 10.3389/fpsyg.2012.00324. [DOI] [PMC free article] [PubMed] [Google Scholar]
- Aslin RN, Newport EL. Statistical learning: From acquiring specific items to forming general rules. Current Directions in Psychological Science. 2012;2:170–176. doi: 10.1177/0963721412436806. [DOI] [PMC free article] [PubMed] [Google Scholar]
- Baldwin KB, Kutas M. An ERP analysis of implicit structured sequence learning. Psychophysiology. 1997;34:74–86. doi: 10.1111/j.1469-8986.1997.tb02418.x. [DOI] [PubMed] [Google Scholar]
- Carrow-Woolfolk E. Comprehensive assessment of spoken language (CASL) Circle Pines, MN: American Guidance Service; 1999. [Google Scholar]
- Casey BJ, Thomas KM, Welsh TF, Badgaiyan RD, Eccard CH, Jennings JR, Crone EA. Dissociation of response conflict, attentional selection, and expectancy with functional magnetic resonance imaging. Proceedings of the National Academy of Sciences of the United States of America. 2000;97:8728–8733. doi: 10.1073/pnas.97.15.8728. [DOI] [PMC free article] [PubMed] [Google Scholar]
- Chomsky N. Language and other cognitive systems. What is special about language? Language Learning and Development. 2011;7:263–278. [Google Scholar]
- Christiansen MH, Chater N. The language faculty that wasn't: A usage-based account of natural language recursion. Frontiers in Psychology. 2015;6:1182. doi: 10.3389/fpsyg.2015.01182. [DOI] [PMC free article] [PubMed] [Google Scholar]
- Christiansen MH, Conway CM, Onnis L. Similar neural correlates for language and sequential learning: Evidence from event-related brain potentials. Language and Cognitive Processes. 2012;27:231–256. doi: 10.1080/01690965.2011.606666. [DOI] [PMC free article] [PubMed] [Google Scholar]
- Coch D, Holcomb PJ. The N400 in beginning readers. Developmental Psychobiology. 2003;43:146–166. doi: 10.1002/dev.10129. [DOI] [PubMed] [Google Scholar]
- Conway CM, Bauernschmidt A, Huang SS, Pisoni DB. Implicit statistical learning in language processing: Word predictability is the key. Cognition. 2010;114:356–371. doi: 10.1016/j.cognition.2009.10.009. [DOI] [PMC free article] [PubMed] [Google Scholar]
- Conway CM, Christiansen MH. Modality-constrained statistical learning of tactile, visual, and auditory sequences. Journal of Experimental Psychology Learning, Memory, and Cognition. 2005;31:24. doi: 10.1037/0278-7393.31.1.24. [DOI] [PubMed] [Google Scholar]
- Conway CM, Gremp MA, Walk AD, Bauernschmidt A, Pisoni DB. Can we enhance domain-general learning abilities to improve language function? In: Rebuschat P, Williams J, editors. Statistical Learning and Language Acquisition. Boston: Walter de Gruyter; 2012. pp. 305–336. [Google Scholar]
- Conway CM, Pisoni DB. Neurocognitive basis of implicit learning of sequential structure and its relation to language processing. Annals of the New York Academy of Sciences. 2008;1145:113–131. doi: 10.1196/annals.1416.009. [DOI] [PMC free article] [PubMed] [Google Scholar]
- Conway CM, Pisoni DB, Anaya EM, Karpicke J, Henning SC. Implicit sequence learning in deaf children with cochlear implants. Developmental Science. 2011;14:69–82. doi: 10.1111/j.1467-7687.2010.00960.x. [DOI] [PMC free article] [PubMed] [Google Scholar]
- Cronbach LJ. Coefficient alpha and the internal structure of tests. Psychometrika. 1951;16:297–334. [Google Scholar]
- Coulson S, King J, Kutas M. Expect the unexpected: event-related brain response to morphosyntactic violations. Language and Cognitive Processes. 1998;13:21–58. [Google Scholar]
- Daltrozzo J, Conway C. Neurocognitive mechanisms of statistical-sequential learning: What do event-related potentials tell us? Frontiers in Human Neuroscience. 2014;8:437. doi: 10.3389/fnhum.2014.00437. [DOI] [PMC free article] [PubMed] [Google Scholar]
- Daltrozzo J, Wioland N, Kotchoubey B. The N400 and Late Positive Complex (LPC) Effects Reflect Controlled Rather than Automatic Mechanisms of Sentence Processing. Brain Sciences. 2012;2:267–297. doi: 10.3390/brainsci2030267. [DOI] [PMC free article] [PubMed] [Google Scholar]
- Delorme A, Makeig S. EEGLAB: an open source toolbox for analysis of single-trial EEG dynamics including independent component analysis. Journal of Neuroscience Methods. 2004;134:9–21. doi: 10.1016/j.jneumeth.2003.10.009. [DOI] [PubMed] [Google Scholar]
- Du W, Kelly SW. Implicit sequence learning in dyslexia: a within-sequence comparison of first-and higher-order information. Annals of dyslexia. 2013;63(2):154–170. doi: 10.1007/s11881-012-0077-1. [DOI] [PubMed] [Google Scholar]
- Dunn LM, Dunn DM. Peabody Picture Vocabulary Test-Fourth Edition. Bloomington (MN): Pearson; 2007. [Google Scholar]
- Eimer M, Goschke T, Schlaghecken F, Stürmer B. Explicit and implicit learning of event sequences: evidence from event-related brain potentials. Journal of Experimental Psychology Learning, Memory, and Cognition. 1996;22:970–987. doi: 10.1037//0278-7393.22.4.970. [DOI] [PubMed] [Google Scholar]
- Ellis E, Robledo M, Deák GO. Contingency learning in infancy and its relation to later vocabulary. Language Learning and Development. 2014;10:36–50. [Google Scholar]
- Erickson LC, Thiessen ED. Statistical learning of language: Theory, validity, and predictions of a statistical learning account of language acquisition. Developmental Review. 2015;37:66–108. [Google Scholar]
- Eriksen BA, Eriksen CW. Effects of noise letters upon the identification of a target letter in a nonsearch task. Perception and Psychophysics. 1974;16:143–149. [Google Scholar]
- Evans JL, Saffran JR, Robe-Torres K. Statistical learning in children with specific language impairment. Journal of Speech, Language, and Hearing Research. 2009;52:321–335. doi: 10.1044/1092-4388(2009/07-0189). [DOI] [PMC free article] [PubMed] [Google Scholar]
- Ferdinand NK, Mecklinger A, Kray J. Error and deviance processing in implicit and explicit sequence learning. Journal of Cognitive Neuroscience. 2008;20:629–642. doi: 10.1162/jocn.2008.20046. [DOI] [PubMed] [Google Scholar]
- Fenske MJ, Eastwood JD. Modulation of focused attention by faces expressing emotion: evidence from flanker tasks. Emotion. 2003;3:327. doi: 10.1037/1528-3542.3.4.327. [DOI] [PubMed] [Google Scholar]
- Foerde K, Knowlton BJ, Poldrack R. Modulation of competing memory systems by distraction. Proceedings of the National Academy of Sciences. 2006;103:11778–11783. doi: 10.1073/pnas.0602659103. [DOI] [PMC free article] [PubMed] [Google Scholar]
- Fiser J, Aslin RN. Unsupervised statistical learning of higher-order spatial structures from visual scenes. Psychological Science. 2001;12:499–504. doi: 10.1111/1467-9280.00392. [DOI] [PubMed] [Google Scholar]
- Friederici AD, Steinhauer K, Pfeifer E. Brain signatures of artificial language processing: evidence challenging the critical period hypothesis. Proceedings of the National Academy of Sciences of the United States of America. 2002;99:529–534. doi: 10.1073/pnas.012611199. [DOI] [PMC free article] [PubMed] [Google Scholar]
- Frisch S, Kotz SA, von Cramon DY, Friederici AD. Why the P600 is not just a P300: the role of the basal ganglia. Clinical Neurophysiology. 2003;114:336–340. doi: 10.1016/s1388-2457(02)00366-8. [DOI] [PubMed] [Google Scholar]
- Frost R, Armstrong BC, Siegelman N, Christiansen MH. Domain generality versus modality specificity: The paradox of statistical learning. Trends in Cognitive Sciences. 2015;19:117–125. doi: 10.1016/j.tics.2014.12.010. [DOI] [PMC free article] [PubMed] [Google Scholar]
- Gallistel CR. Prelinguistic thought. Language Learning and Development. 2011;7:253–262. [Google Scholar]
- Gervain J, Mehler J. Speech perception and language acquisition in the first year of life. Annual Review of Psychology. 2010;61:191–218. doi: 10.1146/annurev.psych.093008.100408. [DOI] [PubMed] [Google Scholar]
- Gogate LJ, Hollich G. Invariance detection within an interactive system: A perceptual gateway to language development. Psychological Review. 2010;117:496–516. doi: 10.1037/a0019049. [DOI] [PubMed] [Google Scholar]
- Gunter TC, Stowe LA, Mulder G. When syntax meets semantics. Psychophysiology. 1997;34:660–676. doi: 10.1111/j.1469-8986.1997.tb02142.x. [DOI] [PubMed] [Google Scholar]
- Hagoort P, Brown CM, Groothusen J. The syntactic positive shift (SPS) as an ERP-measure of syntactic processing. Language and Cognitive Processes. 1993;8:439–483. [Google Scholar]
- Howard JH, Jr, Howard DV, Japikse KC, Eden GF. Dyslexics are impaired on implicit higher-order sequence learning, but not on implicit spatial context learning. Neuropsychologia. 2006;44:1131–1144. doi: 10.1016/j.neuropsychologia.2005.10.015. [DOI] [PubMed] [Google Scholar]
- Hübner R, Steinhauser M, Lehle C. A dual-stage two-phase model of selective attention. Psychological Review. 2010;117:759–784. doi: 10.1037/a0019471. [DOI] [PubMed] [Google Scholar]
- January D, Trueswell JC, Tompson-Schill SL. Co-localization of Stroop and syntactic ambiguity resolution in Broca's area: Implications for the neural basis of sentence processing. Journal of Cognitive Neuroscience. 2009;21:2434–2444. doi: 10.1162/jocn.2008.21179. [DOI] [PMC free article] [PubMed] [Google Scholar]
- Jeste SS, Kirkham N, Senturk D, Hasenstab K, Sugar C, Kupelian C, Baker E, Sanders A, Shimizu C, Norona A, Paparella T, Freeman SFN, Johnson SP. Electrophysiological evidence of heterogeneity in visual statistical learning in young children with ASD. Developmental Science. 2015;18:90–105. doi: 10.1111/desc.12188. [DOI] [PMC free article] [PubMed] [Google Scholar]
- Jost E, Conway CM, Purdy JD, Walk AM, Hendricks MA. Exploring the neurodevelopment of visual statistical learning using event-related brain potentials. Brain Research. 2015;1597:95–107. doi: 10.1016/j.brainres.2014.10.017.. [DOI] [PMC free article] [PubMed] [Google Scholar]
- Kidd E. Implicit statistical learning is directly associated with the acquisition of syntax. Developmental Psychology. 2012;48:171–184. doi: 10.1037/a0025405. [DOI] [PubMed] [Google Scholar]
- Kirkham NZ, Slemmer JA, Johnson SP. Visual statistical learning in infancy: Evidence for a domain general learning mechanism. Cognition. 2002;83:B35–B42. doi: 10.1016/s0010-0277(02)00004-5. [DOI] [PubMed] [Google Scholar]
- Krogh L, Vlach HA, Johnson SP. Statistical learning across development: Flexible yet constrained. Frontiers in Psychology. 2013;3:598. doi: 10.3389/fpsyg.2012.00598. [DOI] [PMC free article] [PubMed] [Google Scholar]
- Kuhl PK. Early language acquisition: Cracking the speech code. Nature reviews Neuroscience. 2004;5:831–843. doi: 10.1038/nrn1533. [DOI] [PubMed] [Google Scholar]
- Lang S, Kotchoubey B. Learning effects on event-related brain potentials. Neuroreport. 2000;11:3327–3331. doi: 10.1097/00001756-200010200-00013. [DOI] [PubMed] [Google Scholar]
- Lavie N, Hirst A, de Fockert JW, Viding E. Load theory of selective attention and cognitive control. Journal of Experimental Psychology General. 2004;133:339. doi: 10.1037/0096-3445.133.3.339. [DOI] [PubMed] [Google Scholar]
- McCarthy G, Wood CC. Scalp distribution of event-related potentials: An ambiguity associated with analysis of variance models. Electroencephalography and Clinical Neurophysiology. 1985;62:203–208. doi: 10.1016/0168-5597(85)90015-2. [DOI] [PubMed] [Google Scholar]
- McGeorge P, Crawford JR, Kelly SW. The relationships between psychometric intelligence and learning in an explicit and an implicit task. Journal of Experimental Psychology: Learning, Memory, and Cognition. 1997;23:239–245. doi: 10.1037//0278-7393.23.1.239. [DOI] [PubMed] [Google Scholar]
- Misyak JB, Christiansen MH. Statistical learning and language: An individual differences study. Language Learning. 2012;62(1):302–331. [Google Scholar]
- Misyak JB, Christiansen MH, Tomblin JB. Online individual differences in statistical learning predict language processing. Frontiers in Psychology. 2010;1:31. doi: 10.3389/fpsyg.2010.00031. [DOI] [PMC free article] [PubMed] [Google Scholar]
- Morgan-Short K, Deng Z, Brill-Schuetz KA, Faretta-Stutenberg M, Wong PCM, Wong FCK. A view of the neural representation of second language syntax through artificial language learning under implicit contexts of exposure. Studies in Second Language Acquisition. 2015;37(2):383–419. doi: 10.1017/S0272263115000030. [DOI] [Google Scholar]
- Morgan-Short K, Faretta-Stutenberg M, Brill KA, Carpenter H, Wong P. Declarative and procedural memory as individual differences in second language acquisition. Bilingualism: Language and Cognition. 2014;17(1):56–72. [Google Scholar]
- Neville H, Nicol JL, Barss A, Forster KI, Garrett MF. Syntactically based sentence processing classes: evidence from event-related brain potentials. Journal of Cognitive Neuroscience. 1991;3:151–165. doi: 10.1162/jocn.1991.3.2.151. [DOI] [PubMed] [Google Scholar]
- Newman AJ, Tremblay A, Nichols ES, Neville HJ, Ullman MT. The influence of language proficiency on lexical semantic processing in native and late learners of English. Journal of Cognitive Neuroscience. 2012;24:1205–1223. doi: 10.1162/jocn_a_00143. [DOI] [PMC free article] [PubMed] [Google Scholar]
- Newport E. The modularity issue in language acquisition: A rapprochement? Comments on Gallistel and Chomsky. Language Learning and Development. 2011;7:279–286. doi: 10.1080/15475441.2011.605309. [DOI] [PMC free article] [PubMed] [Google Scholar]
- Nicolson RI, Fawcett AJ. Procedural learning difficulties: Reuniting the developmental disorders? Trends in Neurosciences. 2007;30:135–141. doi: 10.1016/j.tins.2007.02.003. [DOI] [PubMed] [Google Scholar]
- Nissen MJ, Bullemer P. Attentional requirements of learning: Evidence from performance measures. Cognitive Psychology. 1987;19:1–32. [Google Scholar]
- Oldfield RC. The assessment and analysis of handedness: the Edinburgh inventory. Neuropsychologia. 1971;9:97–113. doi: 10.1016/0028-3932(71)90067-4. [DOI] [PubMed] [Google Scholar]
- Perruchet P, Pacton S. Implicit learning and statistical learning: one phenomenon, two approaches. Trends in Cognitive Sciences. 2006;10:233–238. doi: 10.1016/j.tics.2006.03.006. [DOI] [PubMed] [Google Scholar]
- Polich J. Updating P300: An integrative theory of P3a and P3b. Clinical Neurophysiology. 2007;118:2128–2148. doi: 10.1016/j.clinph.2007.04.019. [DOI] [PMC free article] [PubMed] [Google Scholar]
- Reber AS. Implicit learning of artificial grammars. Journal of Verbal Learning and Verbal Behavior. 1967;6:855–863. [Google Scholar]
- Reber AS, Walkenfeld FF, Hernstadt R. Implicit and explicit learning: Individual differences and IQ. Journal of Experimental Psychology: Learning, Memory, and Cognition. 1991;17:888–896. doi: 10.1037//0278-7393.17.5.888. [DOI] [PubMed] [Google Scholar]
- Reber PJ. The neural basis of implicit learning and memory: A review of neuropsychological and neuroimaging research. Neuropsychologia. 2013;51(10):2026–2042. doi: 10.1016/j.neuropsychologia.2013.06.019. [DOI] [PubMed] [Google Scholar]
- Saffran JR. Statistical learning learning: Mechanisms and constraints. Current Directions in. Psychological Science. 2003;12:110–114. [Google Scholar]
- Saffran JR, Aslin RN, Newport EL. Statistical learning by 8-month-old infants. Science. 1996;274:1926–1928. doi: 10.1126/science.274.5294.1926. [DOI] [PubMed] [Google Scholar]
- Schneider W, Shiffrin RM. Controlled and automatic human information processing: I. Detection, search, and attention. Psychological Review. 1977;84:1–66. [Google Scholar]
- Schwartz TJ, Federmeier KD, van Petten C, Salmon D, Kutas M. Electrophysiological analysis of context effects in Alzheimer's disease. Neuropsychology. 2003;17:187–201. doi: 10.1037/0894-4105.17.2.187. [DOI] [PubMed] [Google Scholar]
- Shafto CL, Conway CM, Field SL, Houston DM. Visual sequence learning in infancy: Domain-general and domain-specific associations with language. Infancy. 2012;17:247–271. doi: 10.1111/j.1532-7078.2011.00085.x. [DOI] [PMC free article] [PubMed] [Google Scholar]
- Shalev L, Tsal Y. The Wide Attentional Window A Major Deficit of Children with Attention Difficulties. Journal of Learning Disabilities. 2003;36:517–527. doi: 10.1177/00222194030360060301. [DOI] [PubMed] [Google Scholar]
- Shiffrin RM, Schneider W. Controlled and automatic human information processing: II. Perceptual learning, automatic attending and a general theory. Psychological Review. 1977;84:127. [Google Scholar]
- Siegelman N, Frost R. Statistical learning as an individual ability: Theoretical perspectives and empirical evidence. Journal of Memory and Language. 2015;81:105–120. doi: 10.1016/j.jml.2015.02.001. [DOI] [PMC free article] [PubMed] [Google Scholar]
- Sijtsma K. On the use, the misuse, and the very limited usefulness of Cronbach's alpha. Psychometrika. 2009;74:107–120. doi: 10.1007/s11336-008-9101-0. [DOI] [PMC free article] [PubMed] [Google Scholar]
- Smith GNL, Conway CM, Bauernschmidt A, Pisoni DB. Can we improve structured sequence processing? Exploring the direct and indirect effects of computerized training using a mediational model. PloS One. 2015;10:e0127148. doi: 10.1371/journal.pone.0127148. [DOI] [PMC free article] [PubMed] [Google Scholar]
- Spencer M, Kaschak MP, Jones JL, Lonigan CJ. Statistical learning is related to early literacy-related skills. Reading and Writing. 2014;28:467–490. doi: 10.1007/s11145-014-9533-0. [DOI] [PMC free article] [PubMed] [Google Scholar]
- Squires NK, Squires KC, Hillyard SA. Two varieties of long-latency positive waves evoked by unpredictable auditory stimuli in man. Electroencephalography and Clinical Neurophysiology. 1975;38:387–401. doi: 10.1016/0013-4694(75)90263-1. [DOI] [PubMed] [Google Scholar]
- Tabullo Á, Sevilla Y, Segura E, Zanutto S, Wainselboim A. An ERP study of structural anomalies in native and semantic free artificial grammar: Evidence for shared processing mechanisms. Brain Research. 2013;1527:149–160. doi: 10.1016/j.brainres.2013.05.022. [DOI] [PubMed] [Google Scholar]
- Turk-Browne NB, Scholl BJ, Johnson MK, Chun MV. Implicit perceptual anticipation triggered by statistical learning. The Journal of Neuroscience. 2010;30:11177–11187. doi: 10.1523/JNEUROSCI.0858-10.2010. [DOI] [PMC free article] [PubMed] [Google Scholar]
- Ullman MT. Contribution of memory circuits to language: The declarative/procedural model. Cognition. 2004;92:231–270. doi: 10.1016/j.cognition.2003.10.008. [DOI] [PubMed] [Google Scholar]
- Ullman MT, Pierpont EI. Specific language impairment is not specific to language: The procedural deficit hypothesis. Cortex. 2005;41:399–433. doi: 10.1016/s0010-9452(08)70276-4. [DOI] [PubMed] [Google Scholar]
- Van Zuijen T, Simoens V, Paavilainen P, Näätänen R, Tervaniemi M. Implicit, intuitive, and explicit knowledge of abstract regularities in a sound sequence: An event-related brain potential study. Journal of Cognitive Neuroscience. 2006;18:1292–1303. doi: 10.1162/jocn.2006.18.8.1292. [DOI] [PubMed] [Google Scholar]
- Verleger R. Event-related potentials and cognition: A critique of the context updating hypothesis and an alternative interpretation of P3. Behavioral and Brain Sciences. 1988;11:343–437. [Google Scholar]
- Walter WG, Cooper R, Aldridge VJ, Mccallum WC, Winter AL. Contingent Negative Variation: An electric sign of sensorimotor association and expectancy in the human brain. Nature. 1964;203:380–384. doi: 10.1038/203380a0. [DOI] [PubMed] [Google Scholar]
- Wöstmann NM, Aichert DS, Costa A, Rubia K, Möller HJ, Ettinger U. Reliability and plasticity of response inhibition and interference control. Brain and cognition. 2013;81(1):82–94. doi: 10.1016/j.bandc.2012.09.010. [DOI] [PubMed] [Google Scholar]
- Woodhouse B, Jackson PH. Lower bounds for the reliability of the total score on a test composed of non-homogeneous items: II: A search procedure to locate the greatest lower bound. Psychometrika. 1977;42:579–591. [Google Scholar]
Associated Data
This section collects any data citations, data availability statements, or supplementary materials included in this article.