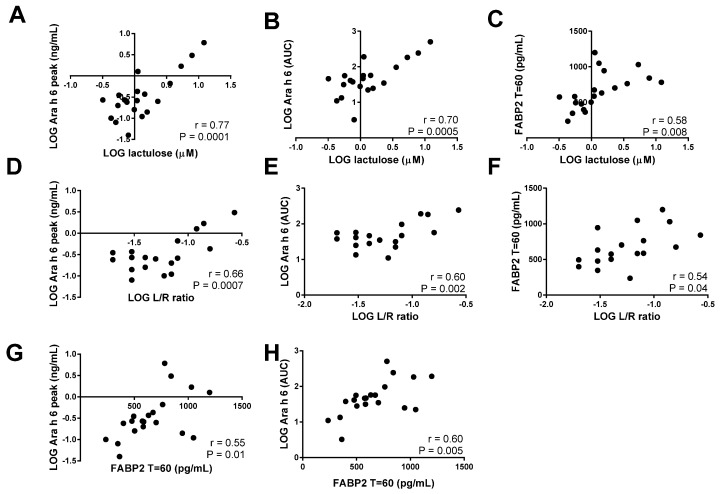
Figure 5.
Correlation analysis of intestinal integrity markers and levels of Ara h 6. Correlations are shown with the calculated Pearson’s correlation coefficients (r) and statistical significance. Correlations are made between the lactulose levels and the peak levels of Ara h 6 (A) and the Ara h 6 AUC values (B), between the Lactulose-over-l-rhamnose (L/R) ratio and the peak levels of Ara h 6 (D) and the Ara h 6 area under the curve (AUC) values (E), and between fatty acid binding protein 2 (FABP2) levels after 60 min and lactulose levels (C), L/R ratio (F), Ara h 6 peak levels (G), and Ara h 6 AUC (H). LOG = logarithm.

