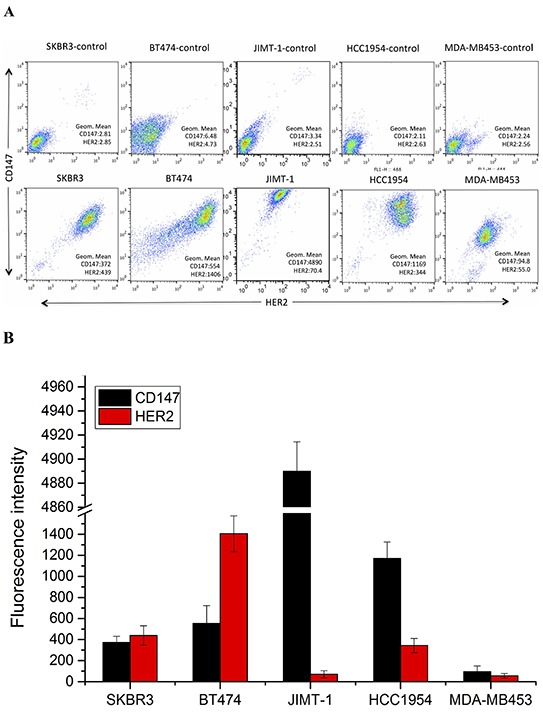
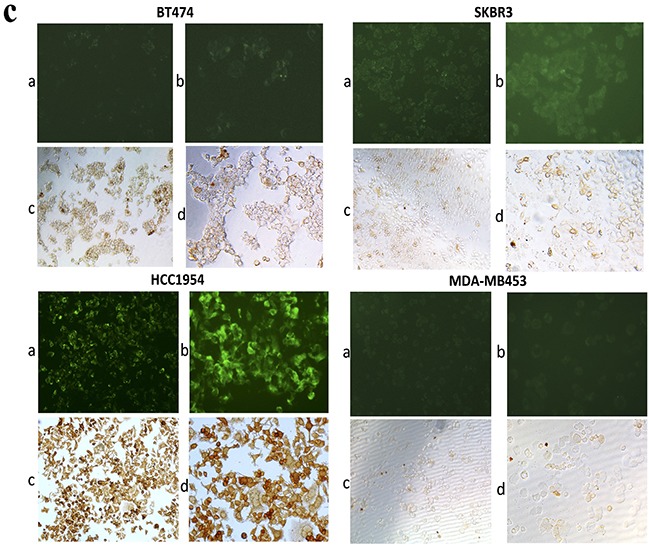
Figure 2. CD147 and HER2 expression in different HER2-positive cancer cell lines.


A. and B. CD147 and HER2 protein expression in cancer cells, as measured by FACS. C. CD147 protein expression in BT474, SKBR3, HCC1954 and MDA-MB453 cells; a and b were detected by IF under 100× and 200× magnification; and c and d were detected by ICC under 100× and 200× magnification.
