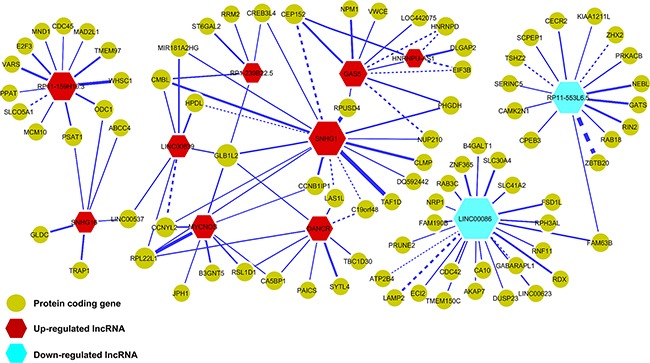
Figure 4. Co-expression network of lncRNAs and protein-coding genes in MYCN amplified neuroblastoma.

Nodes represent the lncRNAs and coding genes whereas edges represent the z-scores of expression correlation between lncRNAs and coding genes. Red nodes represent up-regulated lncRNAs and blue ones represent down-regulated lncRNAs. Yellow nodes represent protein-coding genes. Node size and edge width are proportional to the degree of a node and z-score, respectively. Dashed edges indicate that the connected lncRNA and coding gene pairs also appeared in the MYCN non-amplified network.
