
Figure 6. SNHG1 is a prognostic marker for neuroblastoma.
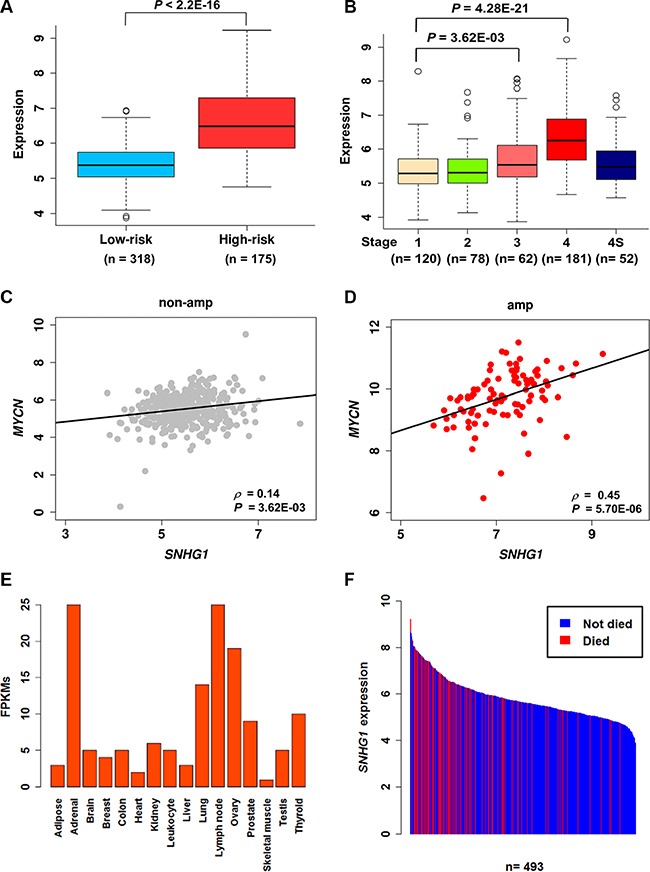
(A, B) Boxplots showing the normalized log2RPM expression values of SNHG1 in different risk groups and stages in a NB cohort (n = 493). The P-values presented were determined by Mann-Whitney-Wilcoxon test (A) and Dunn's multiple comparison test (B). (C, D) Scatter plots showing the correlation between MYCN and SNHG1 in MYCN non-amplified (n = 401) and MYCN amplified patients (n = 92). SCC and the corresponding P-values are displayed. (E) Bar chart showing the ordered expression levels across 16 normal human tissues, based on the RNA-seq data from the Illumina Body Map project. (F) Bar chart showing the ordered expression levels of SNHG1 per survival status of the patient. Here, blue and red bars represent patients did not die and died of disease, respectively.